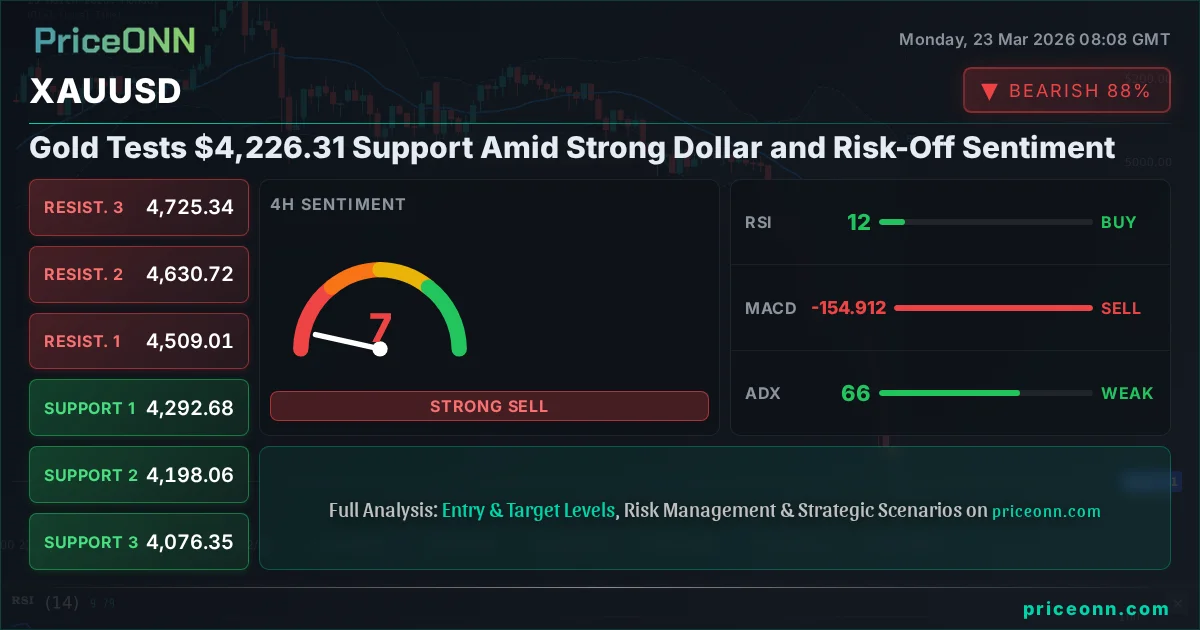
Gold Tests $4,226.31 Support Amid Strong Dollar and Risk-Off Sentiment
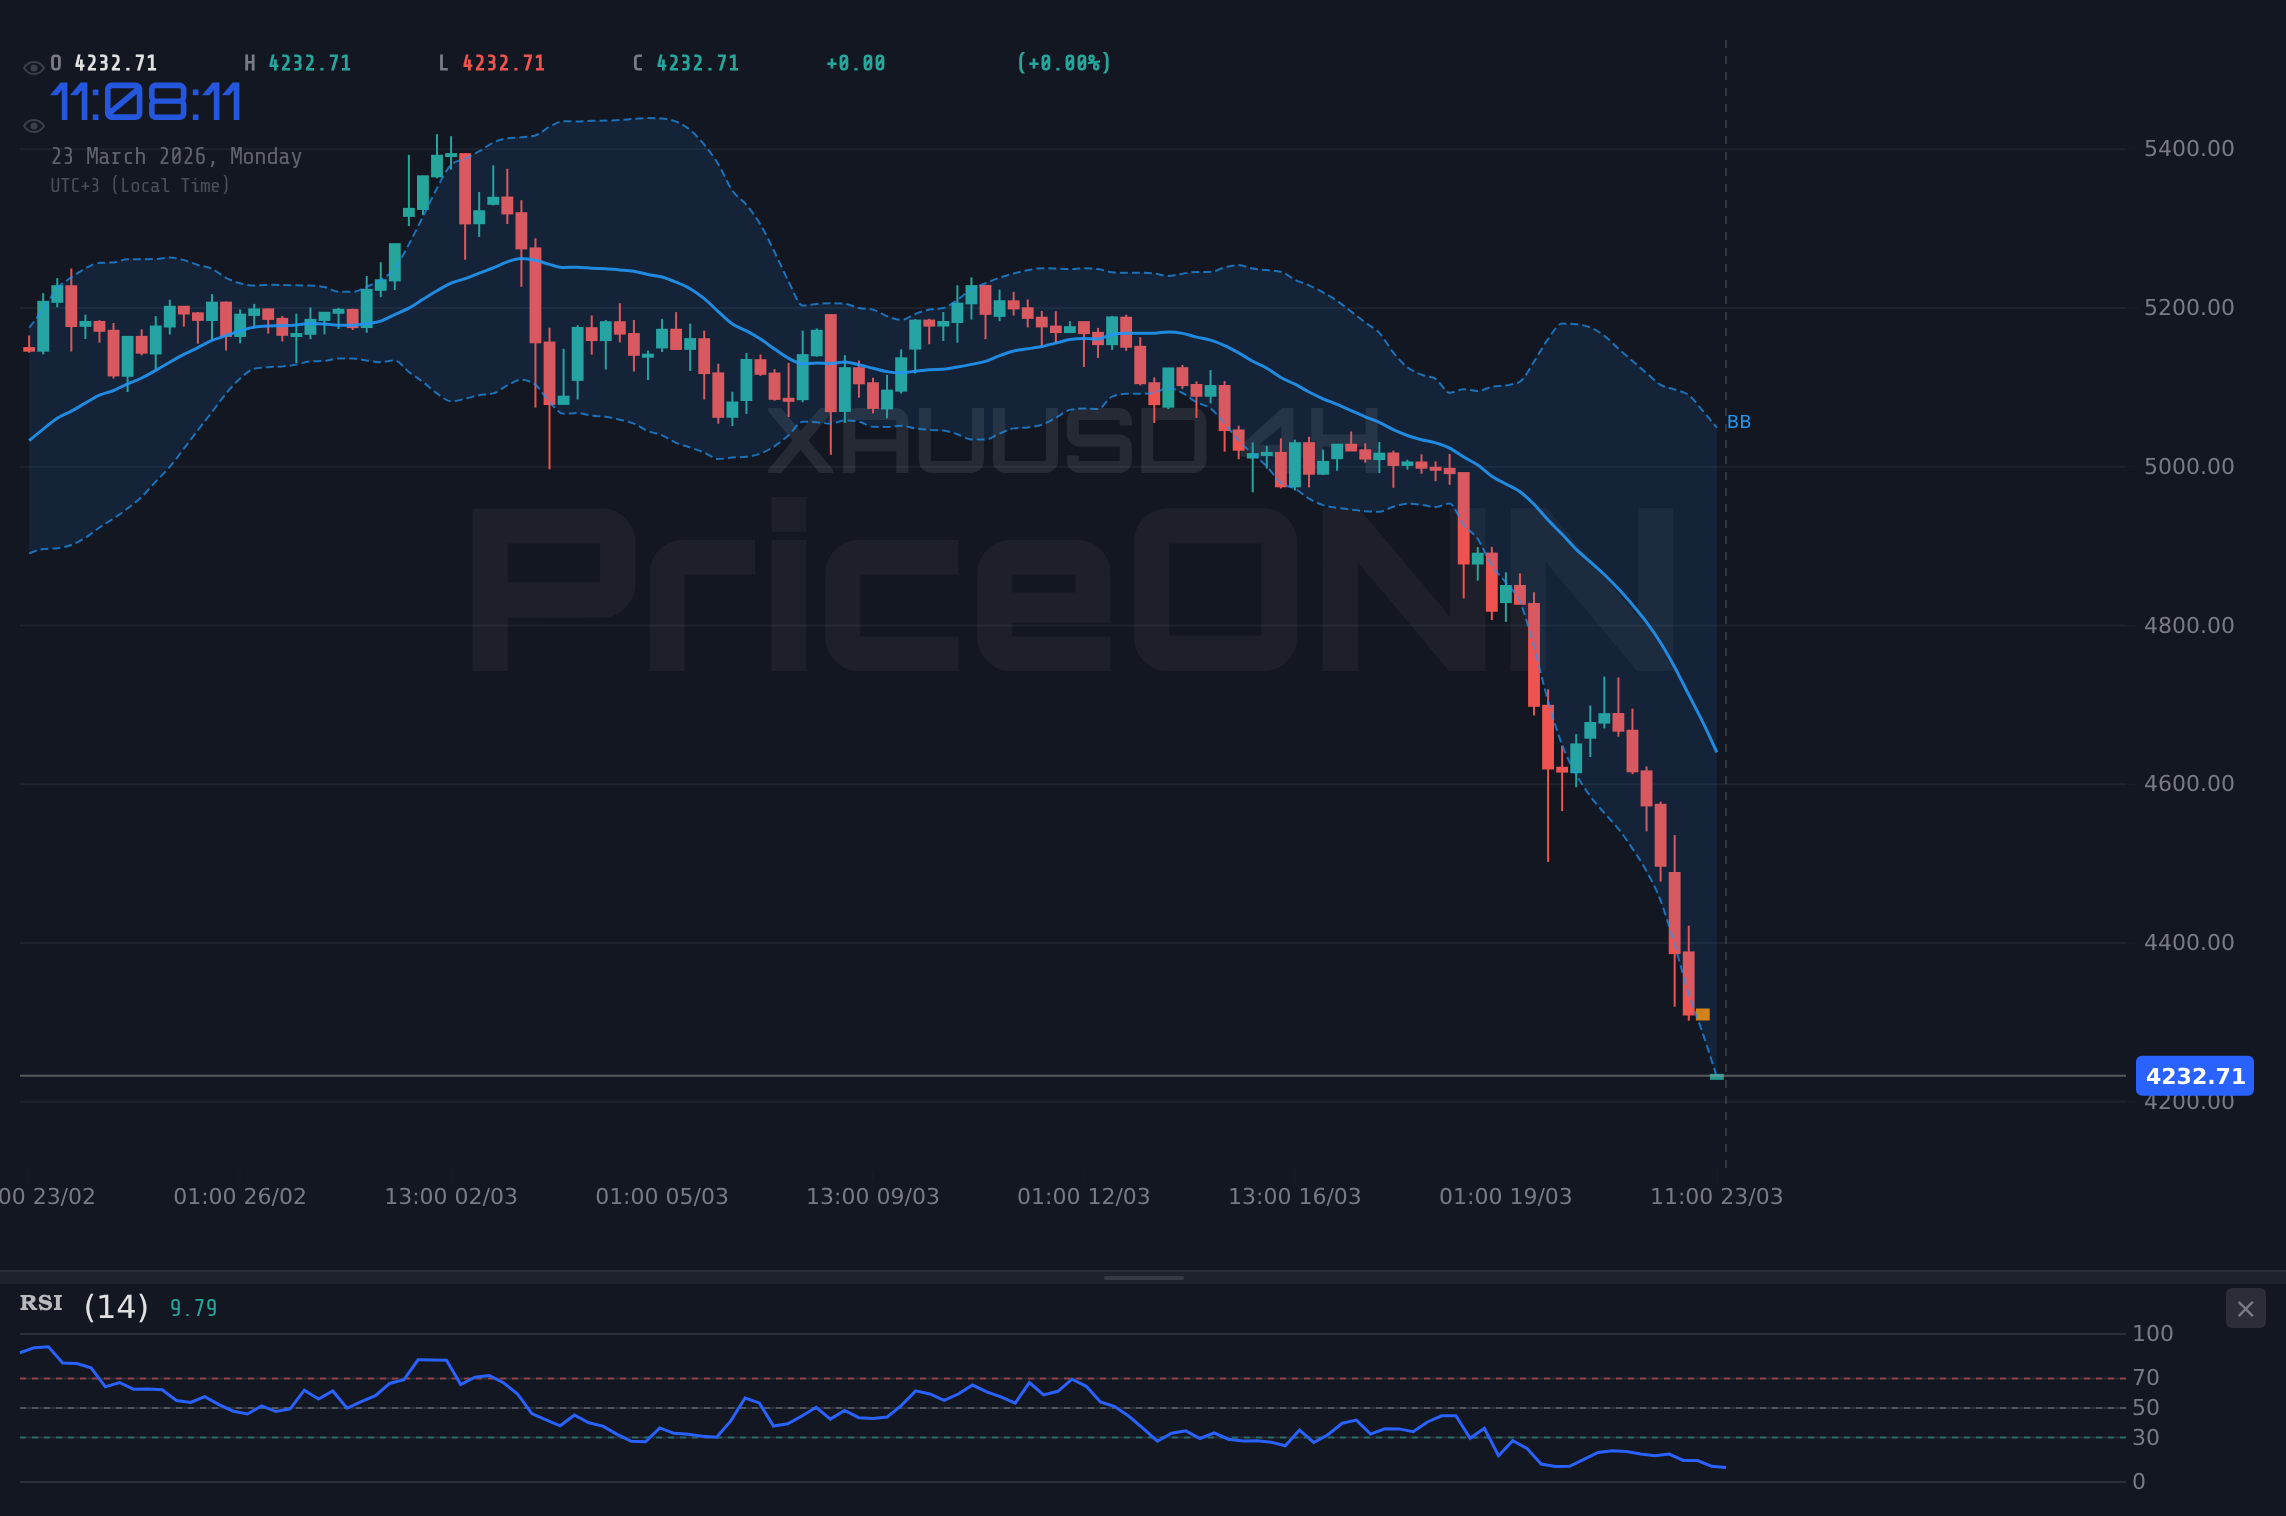
Gold (XAUUSD) is trading at $4,226.31, testing key support levels as a strengthening US Dollar and escalating geopolitical tensions weigh on the precious metal. Technical indicators suggest a neutral trend on the daily chart, but short-term momentum remains bearish.
Gold, currently hovering around the critical $4,226.31 mark, is facing significant headwinds as a potent combination of a surging US Dollar and heightened geopolitical anxieties pressures the precious metal. The daily chart paints a picture of a neutral trend, yet the immediate technical signals, particularly on the 1-hour and 4-hour timeframes, clearly indicate bearish momentum. This divergence between the short-term sell-off and the longer-term indecision creates a fascinating, albeit volatile, environment for traders. Understanding the intricate dance between safe-haven demand, inflation fears, and central bank policy expectations is paramount for navigating this complex market landscape.
- XAUUSD is trading at $4,226.31, testing key support levels as bearish momentum builds on shorter timeframes.
- The US Dollar Index (DXY) is strong, currently at 99.61, which typically exerts downward pressure on gold prices.
- Geopolitical tensions and inflation concerns are creating a risk-off environment, but the dollar's strength is currently dominating safe-haven flows into gold.
- Short-term technical indicators (RSI 19.42 on 1H, 11.92 on 4H) show extreme oversold conditions, hinting at a potential short-term bounce, but the ADX at 50.74 (1H) and 65.57 (4H) confirms a very strong downtrend.
The Dollar's Ascent and Gold's Dilemma
Navigating the Cross-Market Currents
The US Dollar Index (DXY) has been on a steady climb, currently trading at 99.61. This strengthening dollar is a significant headwind for gold. Historically, a stronger dollar makes dollar-denominated commodities like gold more expensive for holders of other currencies, thus dampening demand. We are seeing this inverse correlation play out vividly, with the DXY’s upward trajectory coinciding with gold’s retreat from its recent highs. The DXY’s current technical setup, with RSI at 65.28 and Stochastic in the overbought zone, suggests further upside potential, which could continue to pressure gold prices downwards in the near term. This dynamic is crucial for any trader looking at gold's next move; the dollar’s direction is a primary driver.
Furthermore, the broader risk sentiment is decidedly bearish. Equity markets, represented by the SP500 and Nasdaq, are showing significant declines. The SP500 is down 1.23% at 6455.45, while the Nasdaq has shed 1.37% to 23662.27. This risk-off environment often boosts safe-haven assets. Typically, this would translate into increased demand for gold. However, the current market narrative seems to favor the US dollar as the primary safe-haven destination, overshadowing gold's traditional role. This is a complex interplay: while geopolitical fears (as highlighted by news of escalating Middle East tensions) should theoretically support gold, the dominant force currently appears to be the dollar’s strength, fueled by inflation concerns and anticipation of further central bank action.
Inflationary Pressures and the Central Bank Conundrum
The persistent rise in oil prices, with Brent crude trading at $113.22 and WTI at $100.97, continues to stoke inflation fears. This should, in theory, make gold an attractive inflation hedge. However, the market’s reaction is more nuanced. While inflation is a long-term supportive factor for gold, the immediate concern for traders appears to be the central banks’ response to this inflation. The anticipation of potential interest rate hikes, or at least a hawkish monetary policy stance, is strengthening the dollar and simultaneously creating headwinds for non-yielding assets like gold. The market is caught in a tug-of-war between the inflationary appeal of gold as a store of value and the yield advantage offered by a strengthening dollar in a higher interest rate environment.
The latest economic data and central bank commentary are critical here. While specific Fed minutes or CPI/NFP data aren't provided for this period, the general market sentiment described by the DXY's strength and oil's rise suggests a backdrop of persistent inflation. This implies that central banks, particularly the Federal Reserve, may feel compelled to maintain or even tighten their hawkish stance. This expectation is a key driver behind the dollar’s strength and acts as a significant impediment to gold’s upward potential, even amidst rising geopolitical risks. The market is pricing in a scenario where inflation remains sticky, forcing central banks to prioritize price stability over growth, which generally benefits the dollar at the expense of gold.
The current environment presents a conflict: rising geopolitical risks and inflation usually favor gold as a safe haven and inflation hedge. However, a strong US Dollar, driven by anticipated central bank tightening, is currently overpowering these bullish factors. Traders must monitor the DXY and Fed policy expectations closely as they are key determinants of gold’s short-term direction.
The Bear's Grip: Short-Term Technicals
1-Hour and 4-Hour Charts Scream Sell
Zooming into the intraday charts reveals a starkly bearish picture for gold. On the 1-hour timeframe, the trend is decisively downwards with 100% strength. The RSI(14) is deeply entrenched in oversold territory at 19.42, suggesting a potential for a short-term bounce, but this is overshadowed by a very strong downtrend indicated by the ADX at 50.74. The MACD is negative, and prices are trading below the middle Bollinger Band, reinforcing the bearish sentiment. The Stochastic Oscillator also indicates oversold conditions, with %K at 16.55 and %D at 15.39, but the overall signal is a strong 'SELL', with 6 sell signals versus only 2 buy signals.
The 4-hour chart echoes this bearish conviction, albeit with even stronger trend strength (ADX at 65.57). The RSI is even lower, at 11.92, signaling extreme oversold conditions that could precede a bounce, but the trend is undeniably down. The MACD is below its signal line, and prices are hugging the lower Bollinger Band, a sign of significant selling pressure. Stochastic confirms the oversold state with K=8 and D=27.03, and the overall signal is heavily skewed towards selling (1 buy, 7 sell). While these oversold readings might tempt some traders to look for a short-covering rally, the overwhelming trend strength on these shorter timeframes suggests that any bounce is likely to be temporary unless major fundamental shifts occur.
Daily Chart: A Neutral Standoff
Shifting to the daily timeframe, the picture becomes less clear-cut, reflecting a neutral trend with 50% strength. Here, the RSI stands at 24.02, still in oversold territory but less extreme than the intraday charts, offering a sliver of hope for a potential reversal. The MACD remains negative, and prices are below the middle Bollinger Band, indicating a bearish bias. However, the ADX at 22.48 suggests a medium-strength downtrend, which is considerably weaker than the intraday trends. The Stochastic Oscillator shows %K at 7.58 and %D at 10.56, firmly in oversold territory, but the overall signal balance is mixed, leaning towards sell (3 buy, 5 sell). This daily neutrality suggests that while the short-term is dominated by sellers, the larger trend is not yet decisively broken, leaving room for a potential recovery if key levels hold.
The support levels on the daily chart are identified at 4404.6, 4311.83, and 4146.3. Resistance is seen at 4662.9, 4828.43, and 4921.2. The current price of $4,226.31 is significantly below the daily resistance levels and is approaching the lower end of the daily support structure, particularly the 4404.6 level. The question now is whether the extreme oversold conditions on the shorter timeframes, combined with the neutral stance on the daily chart, are enough to spark a meaningful bounce, or if the overwhelming bearish momentum will drag prices lower towards the more significant support levels.
The Scenarios Unfold: Mapping Gold's Path
The Bull's Roadmap: A Cautious Rebound
For gold to stage a convincing recovery, several conditions must be met. The primary trigger would be a sustained break above the immediate 1-hour resistance level at $4,299.17. This initial move would need to be supported by increasing volume and a shift in momentum indicators. A subsequent break and hold above the 4-hour resistance at $4,509.01 would be crucial for confirming a bullish reversal. If these levels are cleared, the next target would be the daily resistance at $4,662.9. This scenario hinges on a significant shift in market sentiment, perhaps driven by unexpected geopolitical escalation that redirects safe-haven flows back to gold, or a dovish pivot from central banks that weakens the dollar.
The invalidation for this bullish scenario would be a decisive close below the 1-hour support at $4,152.23. A break below this level, especially with strong volume, would suggest that the current oversold conditions are merely a pause before further declines. In such a case, the next targets would quickly shift lower, potentially testing the 4-hour support at $4,076.35 and even the daily support at $4,146.3. The probability of this scenario playing out in the immediate short term (next 24-48 hours) is relatively low, perhaps around 25%, given the current overwhelming bearish technicals and strong dollar.
Where Bears Take Control: A Deeper Dive
The bearish scenario remains the dominant technical narrative in the short to medium term. The immediate trigger for further downside would be a failure to hold the 1-hour support at $4,152.23. A break below this level would likely accelerate selling pressure, targeting the 4-hour support at $4,076.35. If this level also gives way, the next significant psychological and technical barrier would be the daily support at $4,146.3. A sustained break below $4,146.3 would open the door to much lower levels, potentially targeting the $4,000 psychological mark and beyond, possibly down to the $4,005.29 and $4,084.16 levels identified on the 1-hour chart as further support.
The invalidation for this bearish outlook would be a strong bullish reversal signal, perhaps a close above the $4,299.17 resistance and subsequently above the $4,509.01 level. Until then, the path of least resistance appears to be downwards. The high ADX values on the intraday charts (50.74 on 1H, 65.57 on 4H) suggest that the current downtrend has significant momentum and is unlikely to reverse without a substantial catalyst. The probability of this bearish scenario playing out, leading to a test of lower support levels within the next week, is estimated at around 60%, reflecting the current technical and fundamental pressures.
The Waiting Game: Consolidation and Indecision
A neutral scenario, characterized by consolidation and range-bound trading, is also plausible, particularly if the market awaits clearer direction from upcoming economic data or central bank communications. In this case, gold might oscillate between the immediate intraday support around $4,152.23 and resistance near $4,299.17. This range could persist if the dollar's strength falters slightly without a clear bearish signal, or if geopolitical tensions remain elevated but don't trigger a flight to safety specifically into gold. Such a period of indecision would likely see lower volatility and mixed signals from indicators as the market digests conflicting information.
The trigger for this neutral phase would be the failure of price to decisively break either the immediate support or resistance levels. Invalidation would occur if either the bullish or bearish scenario triggers play out. The probability of this range-bound scenario, particularly if key economic events are on the horizon, might be around 15%. This outcome would be characterized by choppy price action, potentially leading to frustration for traders seeking clear directional moves, and would likely see indicators like the ADX remaining subdued or fluctuating, reflecting the lack of a strong trend.
The Bears' Domain: Further Declines
60% ProbabilityThe Bull's Gambit: Rebound Potential
25% ProbabilityThe Waiting Game: Consolidation Phase
15% ProbabilityWhat I'm Watching This Week
The immediate focus for XAUUSD traders will be the price action around the $4,152.23 support level. A failure to hold this level, especially with the dollar index showing continued strength (currently at 99.61), would significantly increase the probability of the bearish scenario playing out, targeting the $4,076.35 level. Conversely, any sign of weakness in the DXY or a geopolitical event that specifically drives safe-haven demand into gold could trigger a short-covering rally, with the $4,299.17 resistance level being the first hurdle.
The extreme oversold conditions on the 1-hour and 4-hour charts (RSI below 20) suggest that a short-term bounce is technically due. However, the ADX readings of 50.74 and 65.57 on these same charts indicate that any such bounce is likely to face strong selling pressure as the dominant downtrend reasserts itself. Therefore, confirmation is key. Traders should look for a clear break of immediate resistance levels with increasing volume and positive shifts in momentum indicators before considering bullish positions. Until then, caution is advised, and risk management should be paramount, especially given the prevailing risk-off sentiment and the dollar's strength.
Frequently Asked Questions: XAUUSD Analysis
What happens if XAUUSD breaks below the $4,152.23 support level?
If XAUUSD breaks decisively below $4,152.23, the bearish scenario gains significant traction. The next key target would be the 4-hour support at $4,076.35. This breakdown would likely be accompanied by continued dollar strength and potentially a further decline in risk assets.
Should I buy gold at current levels of $4,226.31 given the oversold RSI?
Buying solely based on oversold RSI at $4,226.31 is risky due to the strong downtrend indicated by ADX 50.74. A more prudent approach would be to wait for confirmation, such as a break above $4,299.17 resistance with increasing volume, before considering a long position. The probability of a bounce is moderate, but a sustained trend reversal is uncertain.
Is the RSI at 19.42 a buy signal for XAUUSD right now?
An RSI reading of 19.42 on the 1-hour chart indicates extreme oversold conditions, which historically can precede a bounce. However, in the context of a very strong downtrend (ADX 50.74), it is not a standalone buy signal. It suggests potential for a short-term relief rally, but does not confirm a trend reversal.
How will the ongoing geopolitical tensions affect XAUUSD this week?
Escalating geopolitical tensions typically increase safe-haven demand for gold. However, currently, the US Dollar is acting as the primary safe haven, potentially counteracting gold's typical response. If tensions significantly worsen and dollar strength falters, gold could see a surge towards resistance levels like $4,299.17 and beyond.
Track markets in real-time
AI-powered analysis, technical indicators and real-time price data.
Join Our Telegram Channel
Breaking market news, AI analysis and trading signals instantly.
Join Channel