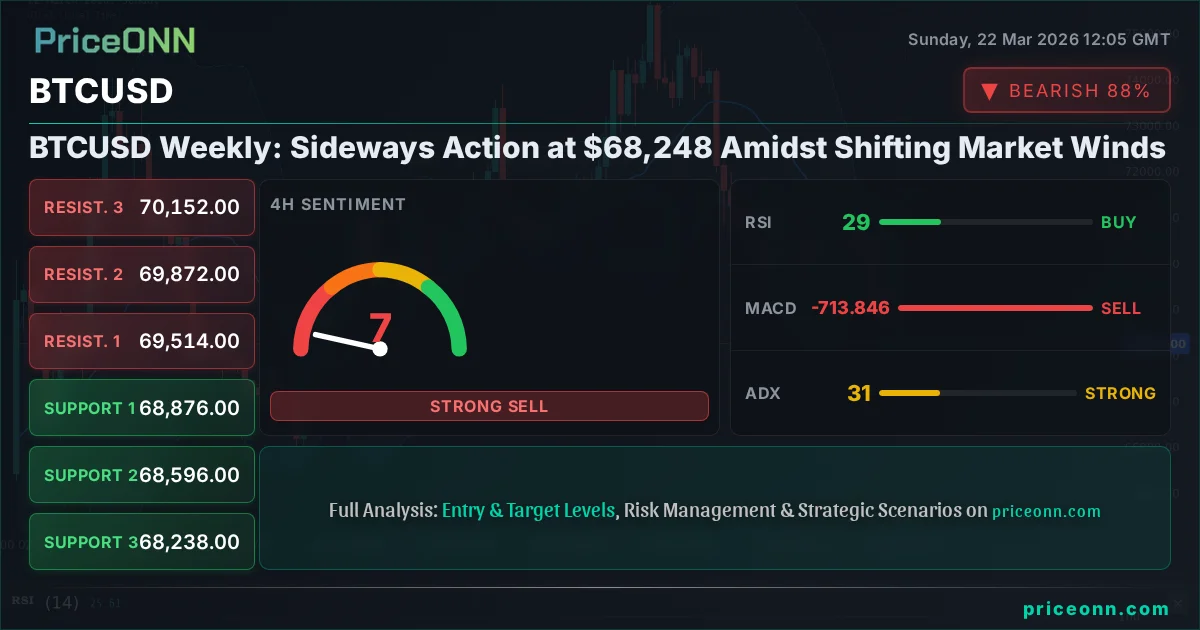
BTCUSD Weekly: Sideways Action at $68,248 Amidst Shifting Market Winds
BTCUSD trading near flat at $68,248. Analysis reveals mixed signals, strong downtrends in shorter timeframes, and cautious outlook for the week ahead. Key levels watched.
The past week has seen Bitcoin, or BTCUSD, trading in a remarkably tight range, hovering just above the critical $68,248 mark. This period of relative calm follows a series of sharp moves, leaving many market participants questioning the next direction. While the price action might appear quiet on the surface, a deeper dive into the technical indicators and broader market correlations reveals a complex interplay of forces shaping the cryptocurrency's outlook. The question on everyone's mind is whether this consolidation is a prelude to a significant breakout or a period of uneasy stability before further declines.
- BTCUSD has traded near flat around $68,248, indicating a short-term consolidation phase.
- Shorter timeframes (1H, 4H) show strong downward trends with RSI readings in oversold territory, suggesting potential for a bounce but also underlying weakness.
- Key support levels for BTCUSD are identified at $68,277.67, $68,541.67, and $68,876, while resistance looms at $68,805.67, $69,514, and $70,006.67.
- Broader market sentiment shows risk-off pressures with DXY rising and major indices like SP500 and Nasdaq declining, which typically puts pressure on risk assets like Bitcoin.
The cryptocurrency market, often characterized by its volatility, has presented a subdued picture for Bitcoin (BTCUSD) over the last seven days. Trading near its previous week's close, the digital asset has found itself oscillating around the $68,248 level. This period of consolidation, however, masks underlying technical signals that warrant close attention. On the 1-hour and 4-hour charts, the trend indicators paint a decidedly bearish picture, with strong downward momentum and extremely oversold conditions on oscillators like the RSI and Stochastic. This divergence between the seemingly stable price and the bearish short-term technicals creates a critical juncture for traders and investors alike.
Delving deeper into the 1-hour timeframe for BTCUSD, the technical landscape is dominated by bearish signals. The ADX stands at a robust 33.17, indicating a strong downward trend is firmly in place. This is corroborated by the RSI(14) dipping to 23.19, firmly within oversold territory – a reading that historically can precede a bounce, but in this context, also highlights significant selling pressure. The MACD remains below its signal line, reinforcing the negative momentum. Similarly, the Stochastic Oscillator shows %K at 14.35 and %D at 32.57, further confirming the oversold conditions and a potential downward bias. The general signal across multiple indicators leans heavily towards a 'SELL' recommendation, with only a few minor 'BUY' signals from shorter-term stochastic movements not yet confirmed by broader momentum.
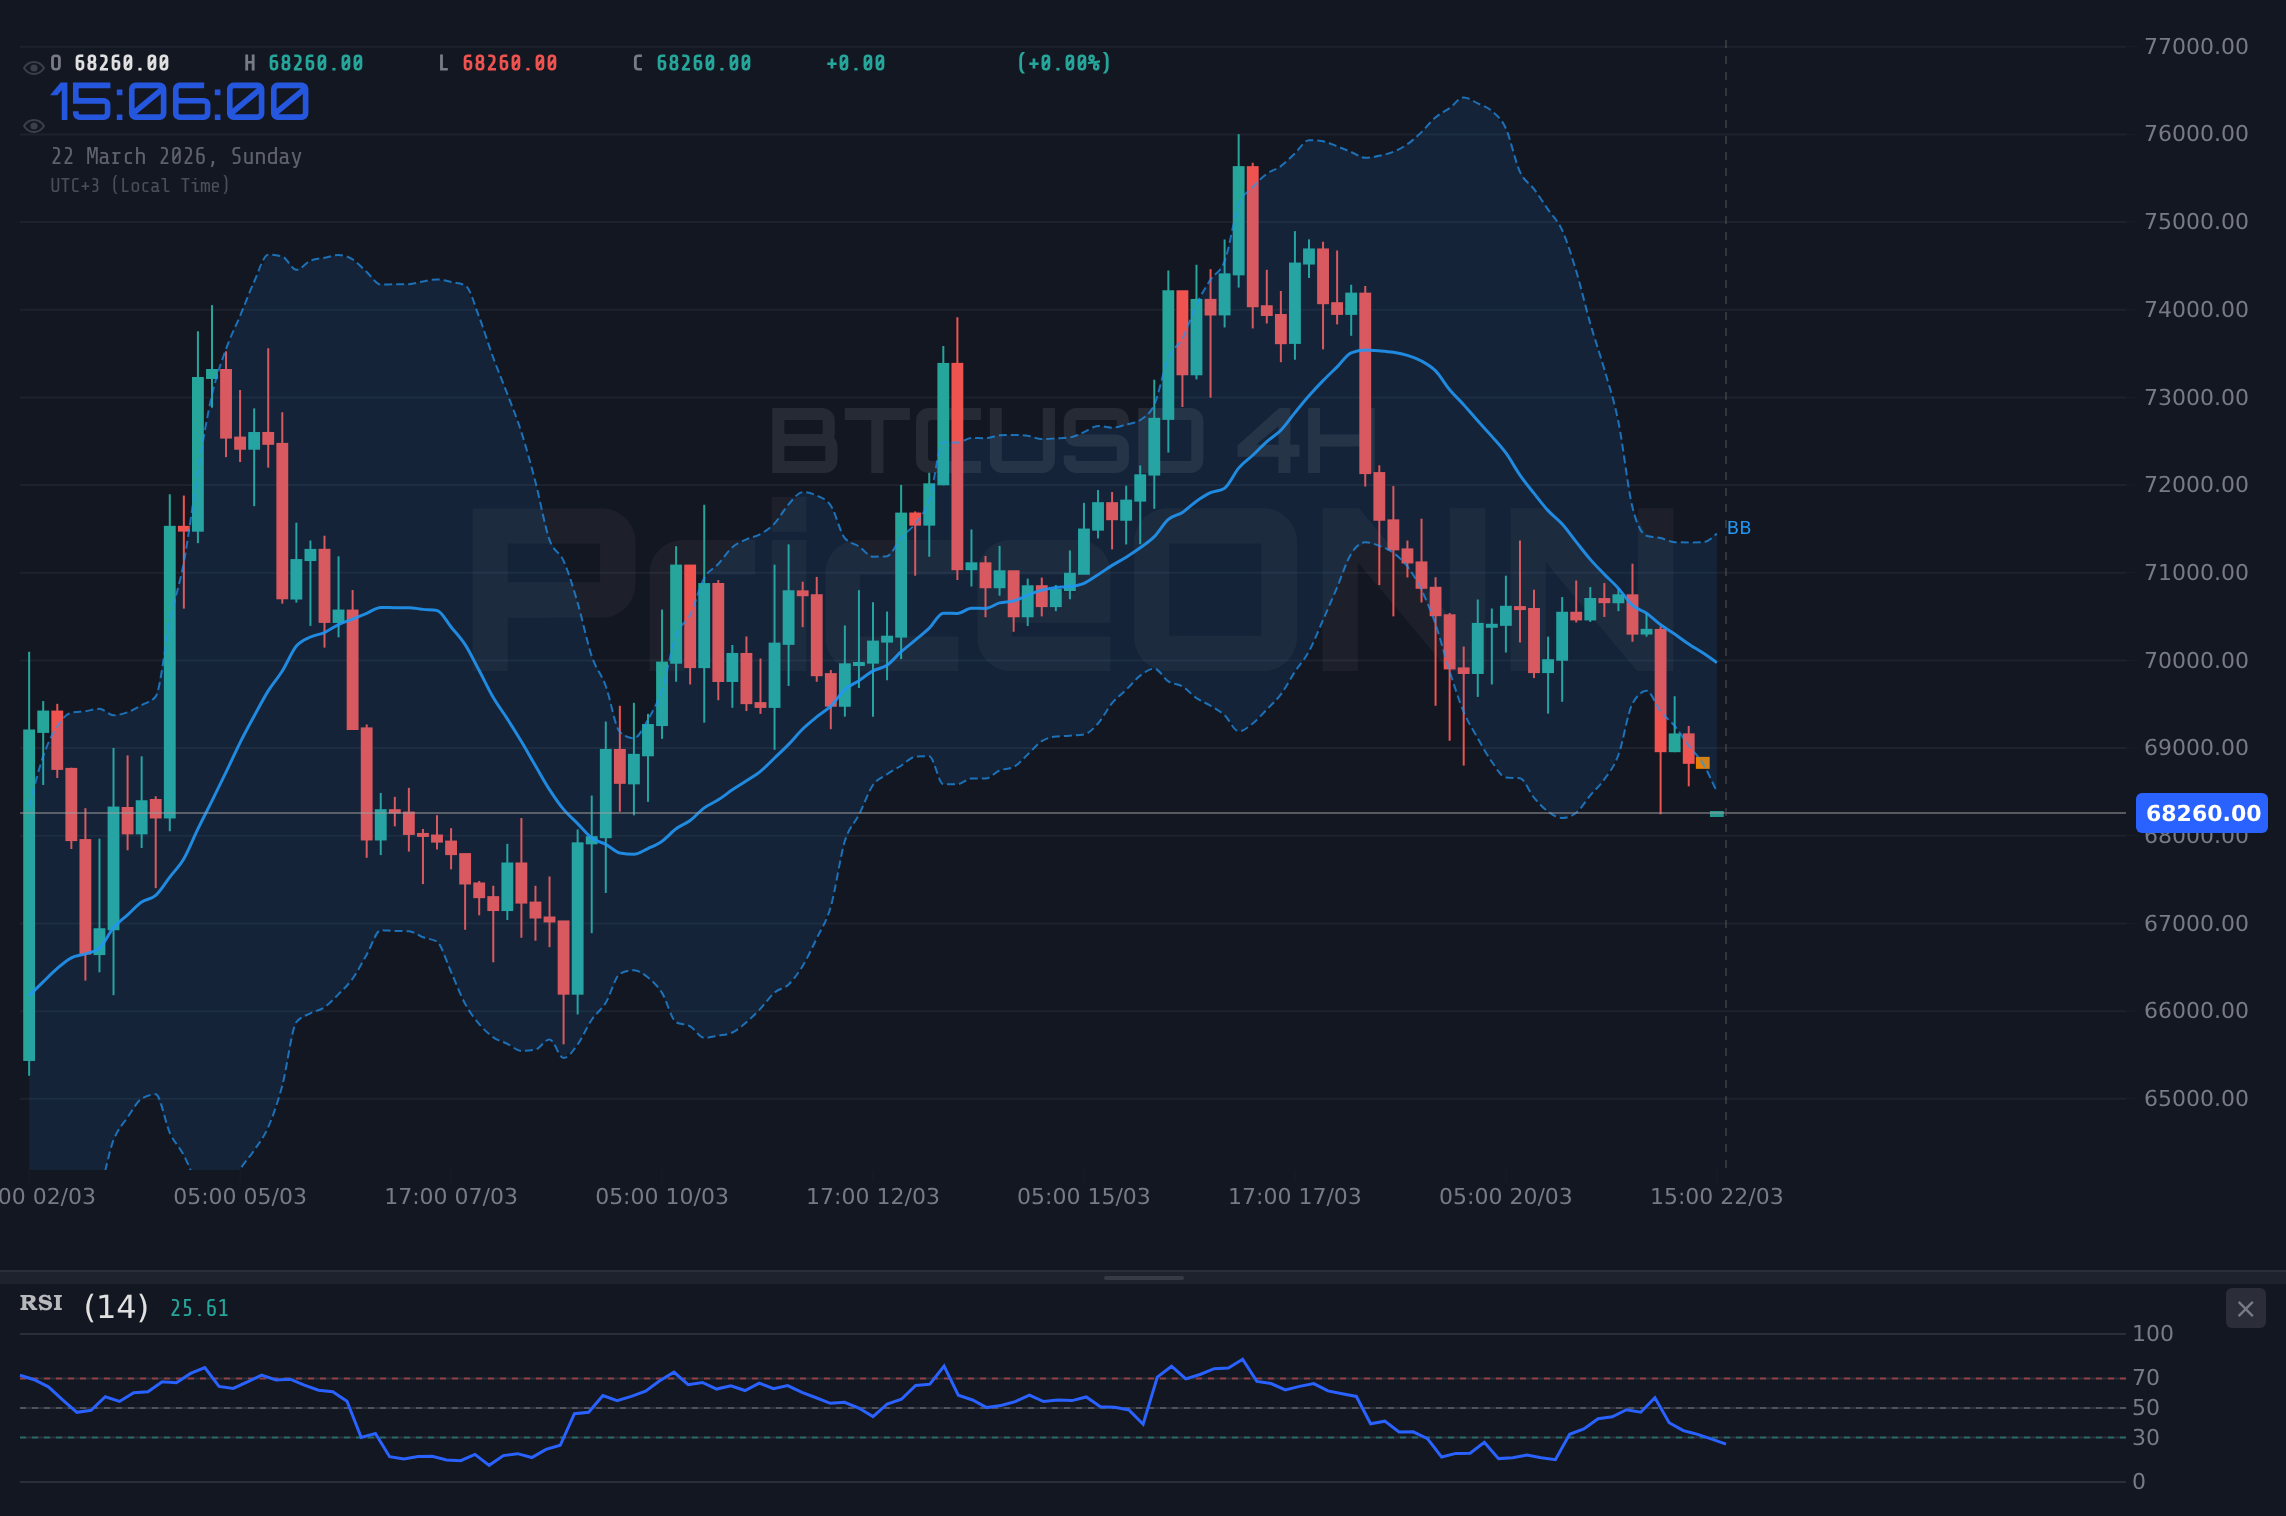
The 4-hour chart for BTCUSD echoes the bearish sentiment seen on the hourly, albeit with slightly different nuances. Here, the trend is technically classified as 'Neutral' with a 50% strength, but the underlying indicators still point downwards. The ADX at 31.45 continues to signal a strong trend, though its strength is slightly less pronounced than on the 1-hour chart. The RSI(14) sits at 28.89, still deep in oversold territory, hinting at a potential short-term reversal or at least a pause in the selling. The MACD is negative, and the Stochastic Oscillator's %K (19.05) is below %D (46.99), suggesting further downside or consolidation. The Bollinger Bands are below the middle band, indicating downward pressure. Despite the neutrality in the overall trend strength, the overwhelming majority of indicators are flashing 'SELL' signals, indicating that the bears are still in control of the immediate price action.
Transitioning to the daily timeframe, the picture for BTCUSD becomes more complex, shifting from a clear downtrend to a more neutral stance, though still tinged with caution. The daily trend strength is at 50%, suggesting a lack of clear direction over the longer term. However, the indicators here also lean bearish. The RSI(14) is at 43.92, below the 50-midpoint and indicating a slight downward bias rather than bullish momentum. The MACD is negative and below its signal line, confirming bearish momentum. The Stochastic Oscillator, with %K at 15.76 and %D at 46.08, is deeply oversold and shows a clear downward cross, reinforcing the sell signal. The ADX at 21.36 indicates a moderately strong trend, but its direction is less decisive than on the shorter timeframes. The majority of signals here are 'SELL', reflecting the indecision and potential for further downside, even if the long-term trend isn't definitively established yet.
The price action around $68,248 is therefore a critical point of observation. On the hourly chart, immediate support is seen at $68,277.67, followed by $68,541.67 and $68,876. Resistance, on the other hand, appears at $68,805.67, $69,514, and $70,006.67. These levels suggest a tight trading range, where a break below the immediate support could trigger further selling pressure, potentially targeting the next significant support levels. Conversely, a sustained move above the initial resistance could signal a short-term relief rally, but would need to overcome stronger resistance zones to indicate a more significant trend reversal.
On the 4-hour chart, the support levels are slightly higher, starting at $68,596, then $68,876, and $69,277.67. Resistance is found at $69,514, $69,872, and $70,152. The proximity of these levels highlights the confined trading range. A decisive break below $68,596 on this timeframe could accelerate the move towards the lower supports, while a push above $69,514 might test the upper resistance band. The daily chart offers a broader perspective, with support at $70,006.67, $69,664.33, and $69,115.67, and resistance at $70,897.67, $71,446.33, and $71,788.67. These longer-term levels are crucial for understanding the overall market structure and potential trajectory should the current consolidation break decisively.
The broader market context provides further clues to Bitcoin's current predicament. The US Dollar Index (DXY) has seen a notable rise, currently trading at 99.25, up 0.35% on the day. This strengthening dollar typically exerts downward pressure on risk assets like Bitcoin, as it increases the cost of dollar-denominated assets for holders of other currencies and often signals a shift towards safer investments. Concurrently, major equity indices are showing weakness. The SP500 is down 1.2% at 6536.67, and the Nasdaq 100 has shed 1.67% to trade at 23986.8. This risk-off sentiment in traditional markets often correlates with a decrease in appetite for speculative assets, further weighing on Bitcoin's potential for upward movement.
This correlation between risk assets and Bitcoin is a key theme. When major indices like the S&P 500 and Nasdaq exhibit sharp declines, capital tends to flow out of riskier assets and into perceived safe havens, such as the US dollar or government bonds. Bitcoin, despite its growing institutional adoption, is still largely viewed as a risk-on asset. Therefore, the current weakness in equities, coupled with a strengthening DXY, creates a challenging environment for BTCUSD. The fact that Bitcoin is trading relatively flat despite these headwinds could be interpreted in two ways: either it's showing resilience, or the underlying selling pressure is building, waiting for a catalyst to break through the current support levels.
The energy sector provides another interesting lens through which to view market sentiment. Brent crude oil is up 4.58% at $112.54, and WTI is up 3.76% at $98.39. This surge in oil prices, potentially driven by geopolitical tensions and supply concerns, typically fuels inflation expectations. Higher inflation can, in theory, make assets like Bitcoin and gold more attractive as inflation hedges. However, the current market narrative seems dominated by the risk-off sentiment and the strengthening dollar, overshadowing the potential inflation-hedging narrative for now. This suggests that the immediate impact of rising energy prices is being filtered through a lens of global economic uncertainty rather than solely as a bullish catalyst for inflation-sensitive assets.
Looking at other cryptocurrencies, Ethereum (ETHUSD) is also experiencing a downturn, currently trading at $2,070.20, down 3.76% on the day. This broad weakness across major digital assets reinforces the idea that the current market sentiment is affecting the entire crypto space. The correlation between Bitcoin and Ethereum remains strong, and the struggles of ETHUSD likely contribute to the cautious outlook for BTCUSD. If Ethereum continues to face selling pressure, it can create a contagion effect, pulling Bitcoin down with it, especially if key support levels fail to hold.
The past week's price action on BTCUSD, particularly the consolidation around $68,248, can be seen as a battleground between buyers looking to capitalize on oversold conditions and sellers aiming to push through key support. The strength of the downward trend on shorter timeframes (1H and 4H) cannot be ignored. The ADX readings of 33.17 and 31.45 respectively, indicate significant trend strength. While RSI and Stochastic are deeply oversold, this doesn't automatically translate into a buy signal. Often, in strong downtrends, these oscillators can remain oversold for extended periods before a meaningful reversal occurs. Therefore, waiting for confirmation beyond just oversold readings is paramount.
Confirmation of a potential bullish reversal would likely require a decisive break above key resistance levels, coupled with improving momentum indicators and a shift in broader market sentiment. Specifically, a sustained move above $70,000 would be a significant psychological and technical hurdle. This would need to be supported by a weakening DXY and a recovery in major equity indices. Until then, the risk of further downside remains elevated, especially if the immediate support levels fail to hold. The current price action around $68,248 presents a delicate balance, and the market is likely waiting for a clearer signal from either the technicals or macroeconomic events.
The question of what lies ahead for BTCUSD hinges on several factors. The upcoming week will be crucial for observing whether the short-term oversold conditions on the hourly and 4-hour charts lead to a bounce, or if the prevailing bearish momentum, supported by a risk-off global environment, pushes prices lower. The resilience of support levels around $68,277.67 and $68,596 will be closely watched. A failure to hold these levels could open the door to a retest of lower significant supports, potentially targeting the $65,000-$66,000 range, which has historically acted as a significant accumulation zone. Conversely, a strong upward move, especially one that breaks decisively above $70,000 and then challenges the $71,000-$72,000 resistance zone, could signal a shift in sentiment.
The influence of central bank policies and macroeconomic data cannot be overstated in this environment. While specific economic calendar events for the coming week were not provided, general market sentiment suggests that any news related to inflation, interest rates, or geopolitical stability could significantly impact risk assets like Bitcoin. For instance, unexpected hawkish commentary from a major central bank or escalating geopolitical tensions could reinforce the risk-off sentiment, pushing BTCUSD lower, while dovish signals or de-escalation could provide a much-needed boost. Traders will be scrutinizing any news flow for clues about the direction of risk appetite.
Given the current technical readings and the broader market sentiment, the outlook for BTCUSD remains cautiously bearish in the short to medium term. The strong downtrend signals on shorter timeframes, combined with the risk-off environment in traditional markets, suggest that any rallies might be met with selling pressure. The key levels to watch remain the immediate support around $68,277.67 and the critical resistance zone near $70,000. A decisive break below the former could signal further downside, while a sustained move above the latter would be required to invalidate the bearish short-term outlook.
From a trading perspective, the current environment calls for patience and risk management. The oversold conditions present a potential for a short-term bounce, but the strong trend strength and broader market correlations suggest that entering long positions without clear confirmation could be risky. Scalpers might look for quick intraday trades on bounces from support, but swing traders and long-term investors would likely wait for more definitive signals, such as a clear break of resistance or a sustained trend reversal confirmed by multiple indicators and a more positive risk environment. The $68,248 area is a key battleground, and the direction of the next significant move will likely be determined by the interplay of technical triggers and macroeconomic developments.
The week ahead will be pivotal for BTCUSD. The consolidation around $68,248 has created a tense equilibrium. The prevailing downward momentum on shorter timeframes, coupled with the overall risk-off sentiment in global markets, suggests that the path of least resistance may still be to the downside. However, the deeply oversold readings on daily oscillators present a potential for a technical bounce. The critical factor will be whether this bounce can overcome the significant resistance levels and reverse the bearish short-term trend, or if it will be a mere pause before further declines. Traders should remain vigilant, manage risk tightly, and wait for clear signals before committing to significant positions.
The current price of $68,248 for BTCUSD reflects a market caught between the potential for a technical rebound from oversold conditions and the broader macroeconomic headwinds of a strengthening dollar and declining risk appetite in traditional markets. The strong downtrend signals on the 1-hour and 4-hour charts, coupled with ADX values indicating trend strength, suggest that underlying selling pressure remains significant. While the daily chart shows a more neutral trend, the oversold RSI and Stochastic readings present a potential, albeit uncertain, opportunity for a short-term bounce. The resilience of support at $68,277.67 and $68,596 will be key to watch in the immediate term. A break below these levels could accelerate a move towards lower targets, while a sustained push above resistance near $70,000 would be necessary to invalidate the current bearish bias.
Frequently Asked Questions: BTCUSD Analysis
What happens if BTCUSD breaks below the $68,277 support level?
A break below $68,277.67 on BTCUSD would likely trigger further selling pressure, potentially accelerating towards the next support at $68,541.67 and then $68,876. This would reinforce the bearish short-term trend indicated by hourly and 4-hour oscillators.
Should I consider buying BTCUSD at current levels of $68,248 given the oversold RSI?
Buying solely based on oversold RSI at $68,248 carries significant risk due to the strong downtrend signals on shorter timeframes and broader market risk-off sentiment. Wait for confirmation, such as a decisive break above resistance or improving momentum across multiple timeframes, before considering long positions.
Is the MACD negative momentum a sell signal for BTCUSD at $68,248?
Yes, the negative MACD momentum, with the MACD line below the signal line on all observed timeframes (1H, 4H, 1D), is a strong sell signal. It indicates that bearish momentum is currently dominant, reinforcing the downward bias for BTCUSD.
How will the rising DXY and falling SP500 affect BTCUSD's outlook this week?
The rising DXY (currently 99.25) and falling SP500 (down 1.2%) create a risk-off environment that typically pressures speculative assets like BTCUSD. This correlation suggests that further upside for Bitcoin may be limited until these broader market conditions improve.
Track markets in real-time
AI-powered analysis, technical indicators and real-time price data.
Join Our Telegram Channel
Breaking market news, AI analysis and trading signals instantly.
Join Channel