AUDUSD Sideways at $0.70241: A Neutral Outlook Amidst Market Crosswinds
AUDUSD holds at $0.70241. With the daily trend neutral and key indicators mixed, the pair faces a pivotal week. Analysis of DXY, oil, and risk sentiment.
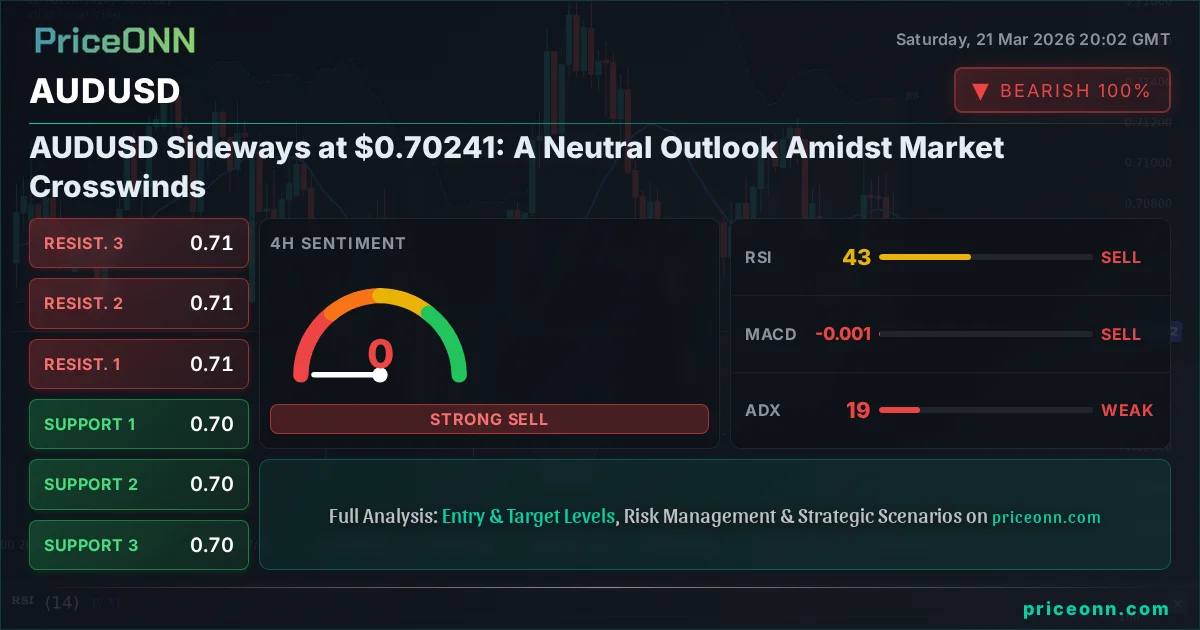
The Australian Dollar versus the US Dollar (AUD/USD) finds itself at a critical juncture, trading at precisely $0.70241 as the market closes out a volatile week. This neutral stance, however, belies the swirling crosscurrents in global markets that are likely to dictate the pair's next significant move. As a seasoned technical analyst with over two decades of experience, I see this period not as stagnation, but as a crucial consolidation phase where underlying market forces are building pressure for a decisive breakout. The question on every trader's mind is whether this consolidation will resolve upwards, supported by a weakening dollar and rising commodity prices, or downwards, dragged by risk aversion and a resurgent greenback. Understanding these dynamics is paramount for navigating the week ahead.
- AUD/USD is trading at $0.70241, reflecting a neutral daily trend (ADX 19.14) and mixed signals across timeframes.
- Critical support is identified at $0.70193, with resistance looming at $0.70271 and $0.70715.
- The DXY at 99.25 shows a strong daily uptrend (ADX 34.64), potentially capping AUD/USD gains.
- Oil prices (Brent at $112.79) are surging, usually a bullish tailwind for AUD, but risk sentiment appears fragile.
- The RBA's recent hawkish surprise is a key fundamental driver, but its impact may be waning against broader macro headwinds.
Last week was a tale of two narratives for the AUD/USD. On one hand, the Reserve Bank of Australia (RBA) delivered a hawkish surprise with an unexpected interest rate hike, a move typically designed to bolster the currency. This action provided a temporary lift, pushing the Aussie above key moving averages and sparking bullish sentiment among some market participants. News reports from mid-week highlighted this sentiment, with headlines like "AUD/USD Climbs 0.48% After RBA Rate Hike Signals Hawkish Stance" and "Australian Dollar gathers strength as RBA hikes rates, Fed rate decision looms." However, this domestic strength was met with significant headwinds from the global stage. The US Dollar Index (DXY), a key barometer of greenback strength, continued its upward march, closing the week at 99.25. This persistent dollar strength, driven by a combination of Federal Reserve hawkishness and a flight to safety, acted as a strong counter-force, preventing AUD/USD from sustaining its rally and ultimately pushing it back towards the $0.70241 level.
The interplay between the RBA's policy and the broader macroeconomic environment is where the real complexity lies. While the RBA's decision to hike rates injects a bullish element into the Australian dollar's fundamental picture, it operates within a global context of rising geopolitical tensions and shifting central bank expectations. The ongoing conflict in the Middle East, for instance, has sent oil prices (Brent crude at $112.79) soaring, which normally benefits commodity-linked currencies like the AUD. However, this surge in oil prices also fuels inflation concerns, potentially prompting further hawkish responses from central banks like the Federal Reserve, thereby strengthening the USD. This creates a tug-of-war effect: rising oil should support AUD/USD, but rising inflation and a strong USD may cap its upside. The market's reaction to the RBA hike, as seen in the neutral daily trend signal (ADX 19.14), suggests that this global uncertainty is currently outweighing the positive domestic policy action.
Navigating the Technical Landscape: A Neutral Treadmill
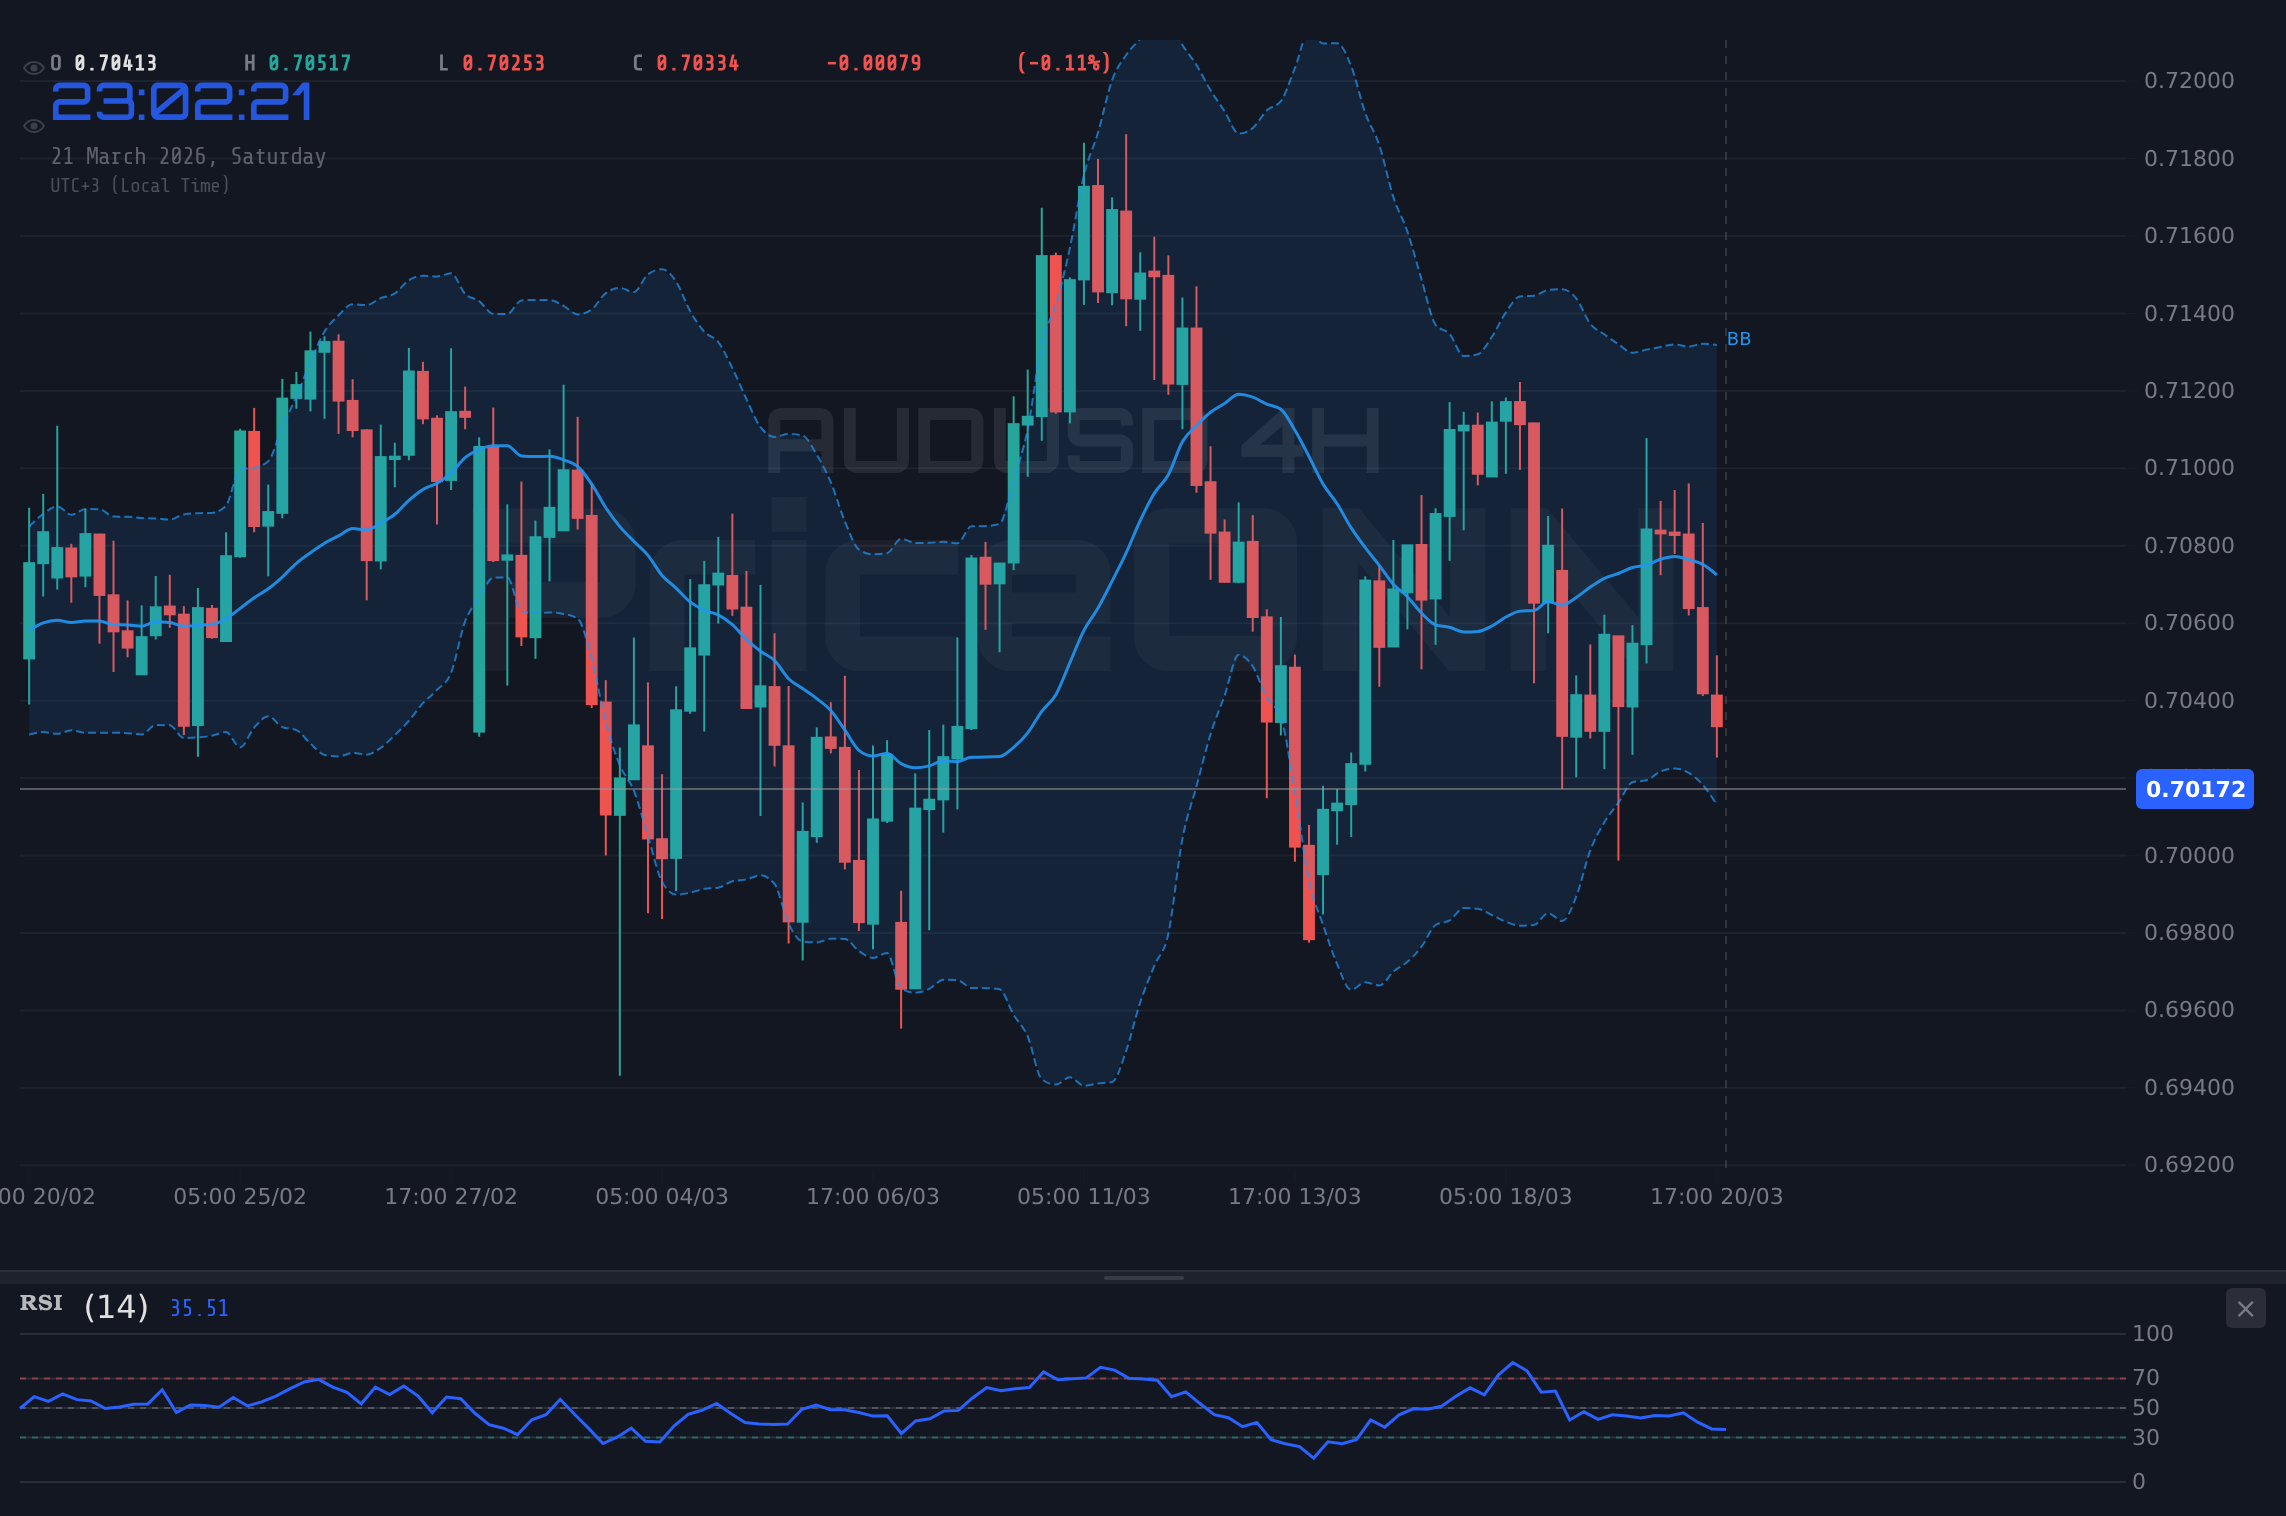
From a technical standpoint, AUD/USD is treading water. The 1-hour chart shows a slight upward bias, with the RSI at 53.72 and Stochastic %K crossing above %D, indicating some short-term buying interest. However, this is immediately contradicted by the MACD, which remains in negative territory, and the price action hovering below the middle Bollinger Band, suggesting underlying weakness. The 4-hour chart paints an even more cautious picture. While the RSI is a neutral 56.39, the Stochastic is showing a bearish cross (%K below %D), and the ADX at 19.77 signifies a weak trend, characteristic of range-bound trading. The daily chart is where the neutrality is most pronounced. The ADX at 19.51 is indicative of a lack of strong directional conviction. The RSI is hovering around 44.34, and the MACD histogram remains negative, reinforcing the idea that the bears, while not in full control, are certainly not conceding ground. This lack of a clear trend on higher timeframes suggests that significant price action is currently being driven by intraday volatility and short-term sentiment shifts rather than a sustained directional move.
The intraday charts offer some clues, but they lack the conviction needed for a strong directional trade. On the 1-hour timeframe, the AUD/USD is attempting to push higher, finding some support near the 1.15409 level. Resistance is appearing around 1.15647. The RSI is in neutral territory, and while the Stochastic is showing a bullish lean, the MACD's negative momentum is a significant caveat. This suggests that any intraday gains might be met with selling pressure as traders reassess the broader picture. The 4-hour chart presents a similar dilemma. Prices are struggling to break decisively above the 1.15687 resistance level. The ADX here is particularly telling; at 19.77, it signals a lack of a strong trend, meaning that any move higher could be quickly reversed, and any move lower could stall just as fast. This choppy environment is notoriously difficult for traders, as stop-loss orders are often triggered by minor fluctuations before the market eventually establishes a clearer direction.
The Dollar's Dominance: DXY's Influence on AUD/USD
No analysis of AUD/USD would be complete without a deep dive into the US Dollar Index (DXY). The DXY's current price of 99.25, coupled with a strong daily uptrend (ADX 34.64) and a daily RSI of 57.21, underscores the greenback's resilience. Despite some intraday choppiness on the 1-hour chart, where the trend is currently flagged as bearish (ADX 22.31), the daily picture is one of underlying strength. This strength is a significant headwind for AUD/USD. Historically, a rising DXY exerts downward pressure on currency pairs like AUD/USD, as it implies a greater demand for dollars relative to other major currencies. The positive momentum on the daily MACD further supports the dollar's bullish outlook. This suggests that even if the RBA's actions provide some support for the Australian dollar, the sheer force of dollar strength, potentially fueled by ongoing Fed hawkishness and safe-haven flows, could limit any significant upside for AUD/USD.
The divergence in signals across different timeframes for the DXY itself highlights the current market uncertainty. While the daily trend is robustly bullish, the 1-hour chart shows a bearish trend with an ADX of 22.31, suggesting a potential short-term pullback in the dollar. The 4-hour chart, however, presents a bearish trend signal (ADX 19.43), which seems counterintuitive given the daily strength. This kind of conflicting data across timeframes often indicates a market in transition, where short-term noise can obscure the longer-term trend. For AUD/USD, this means that while the overarching trend might favor dollar strength, there could be opportunities for intraday or short-term bounces if the dollar experiences temporary weakness. However, any such bounces in AUD/USD would need to be viewed with extreme caution, as the dominant daily trend for the DXY suggests that the path of least resistance for the dollar remains to the upside.
Commodities and Risk Sentiment: A Mixed Bag
Commodities, particularly oil, are painting a complex picture. Brent crude is trading strongly at $112.79, with a powerful daily uptrend (ADX 65.23) and a very high RSI of 82.55. This surge in oil prices, often linked to geopolitical tensions such as the recent attack on Qatar's energy hub, typically acts as a bullish catalyst for commodity-linked currencies like the Australian dollar. Higher energy prices can signal increased global demand or supply disruptions, both of which can translate into higher commodity export revenues for resource-rich nations like Australia. This fundamental tailwind should, in theory, support AUD/USD. However, the concurrent rise in oil prices also exacerbates inflation concerns globally. This can lead to a 'risk-off' sentiment, where investors shy away from riskier assets (like AUD) and flock to perceived safe havens (like the USD or gold). The sharp decline seen in gold prices this week, despite the geopolitical backdrop, is a concerning sign that risk appetite may be waning, which could negate the positive impact of higher oil prices on AUD/USD.
The data for gold (XAUUSD) and silver (XAGUSD) presents a stark contrast to the bullish narrative for oil. Gold is trading significantly lower at $4497.65, down 3.28% on the day, with daily RSI at a deeply oversold 29.58 and a very strong downtrend indicated by the ADX at 19.51. Silver, similarly, has plunged, trading at $67.90 with a daily RSI of 33.56 and a strong downtrend (ADX 20.09). This sharp sell-off in precious metals, despite ongoing geopolitical uncertainty, suggests that investors may be prioritizing liquidity and dollar strength over traditional safe-haven assets. This is a crucial signal for AUD/USD. If gold and silver are falling, it implies that the broader market sentiment is not one of escalating risk aversion that would typically drive demand for safe havens. Instead, it might indicate a scenario where the US dollar is strengthening due to factors other than pure risk aversion, such as relative interest rate differentials or strong US economic data, which would be bearish for AUD/USD. This makes the correlation between oil's rise and metals' fall a key point of tension for the currency pair.
The RBA's Shadow: Policy Divergence and Its Limits
The RBA's recent decision to hike rates was a significant event, aiming to combat inflation within Australia. This hawkish move contrasts with a more dovish stance from some other central banks, creating a potential yield advantage for the Australian dollar. Indeed, news reports from the past week emphasized this: "AUD/USD Climbs 0.48% After RBA Rate Hike Signals Hawkish Stance" and "AUD/USD extends rally as RBA hike boosts Aussie." However, the market's reaction, or lack thereof, in pushing AUD/USD back to $0.70241, suggests that the impact of this domestic policy is being overshadowed by global macroeconomic forces. The Federal Reserve, for example, continues to signal a data-dependent approach, but the underlying tone remains firm, especially with inflation showing signs of persistence. If the Fed maintains a hawkish bias, the interest rate differential between the US and Australia might not widen enough to provide sustained support for the AUD, especially if the market starts pricing in further dollar strength.
Furthermore, the effectiveness of a single rate hike in a vacuum is questionable. The Australian economy, while resilient, is not immune to global slowdowns or commodity price shocks. The recent surprise rise in Australia's unemployment rate, as reported on March 20th, is a prime example. News outlets noted: "AUD/USD Dips as Australia's Unemployment Rate Surprises Higher" and "Will AUD/USD Fall to 0.7000 Amid Rising Unemployment and Dollar Strength?" This data point introduces a bearish fundamental element for the Aussie, suggesting that the domestic economy might be facing headwinds that could temper the RBA's hawkishness in the future. This economic data directly challenges the narrative of consistent Australian economic outperformance and adds another layer of complexity to the AUD/USD outlook, potentially limiting the upside even with a hawkish RBA.
Looking Ahead: Key Levels and Potential Catalysts
As we look to the week ahead, the AUD/USD pair remains precariously balanced. The immediate support level to watch on the daily chart is $0.70193. A decisive break below this level, especially on increased volume and confirmed by daily candle close, would likely signal a continuation of the bearish trend, targeting the next support at $0.69545. On the upside, resistance is firming up around $0.70271. A sustained push above this level, coupled with a break of the more significant resistance at $0.70715, would be necessary to invalidate the current neutral-to-bearish bias and open the door for a move towards higher levels. The 4-hour chart also highlights these levels, with immediate resistance at $0.70715 and support at $0.69821. The tight range indicated by the ADX on the 4-hour chart (19.14) suggests that a breakout is not imminent, and we may continue to see choppy price action.
Key events to monitor will include upcoming economic data releases from both Australia and the United States. Any further surprises in Australian employment figures or inflation data could significantly impact the RBA's future policy path and, consequently, the AUD. On the US side, any hints from the Federal Reserve regarding their stance on inflation and interest rates, particularly in light of rising oil prices, will be crucial. The correlation with the DXY will remain paramount; if the dollar index continues its ascent, it will be an uphill battle for AUD/USD to find sustained strength. Conversely, a significant pullback in the DXY, perhaps triggered by unexpected US economic weakness or a shift in Fed rhetoric, could provide the necessary catalyst for AUD/USD to reclaim higher ground. Traders should remain vigilant for confluence signals across multiple timeframes and indicators before committing to a directional trade.
Bearish Scenario: Dollar Strength Prevails
65% ProbabilityNeutral Scenario: Range-Bound Consolidation
25% ProbabilityBullish Scenario: RBA Support Holds
10% ProbabilityFrequently Asked Questions: AUDUSD Analysis
What happens if AUDUSD breaks below the $0.70193 support level?
A break below $0.70193 on the daily chart would invalidate the current neutral stance and likely trigger a move towards the next support at $0.69545. This scenario becomes more probable if the DXY continues to strengthen or if further negative Australian economic data emerges.
Should I consider buying AUDUSD at current levels near $0.70241 given the RBA's hawkish stance?
Buying at current levels carries significant risk due to the strong dollar and mixed technical signals. A confirmation would be needed, such as a decisive break above $0.70715 resistance, alongside weakening DXY and improving risk sentiment. Otherwise, the risk of further downside below $0.70193 remains considerable.
Is the RSI at 44.34 on the daily chart a sell signal for AUDUSD?
An RSI of 44.34 is not a direct sell signal; it indicates a bearish lean within the neutral zone, suggesting more downside pressure than upside potential currently. It aligns with the broader downtrend on the daily chart and suggests that any rallies might face selling pressure near resistance levels.
How will the upcoming US economic data, especially regarding inflation and employment, affect AUDUSD this week?
Stronger-than-expected US data could reinforce Fed hawkishness, strengthening the DXY and pushing AUD/USD lower, potentially below $0.70193. Conversely, weaker data might lead to dollar pullback and a risk-on shift, offering AUD/USD a chance to test resistance levels around $0.70715.
The AUD/USD pair is currently navigating a complex market environment characterized by conflicting fundamental drivers and indecisive technical signals. While the RBA's hawkish policy provides a degree of support, the overarching strength of the US dollar, coupled with waning risk appetite and geopolitical uncertainties, presents significant headwinds. The neutral ADX readings on higher timeframes underscore the lack of a clear trend, suggesting that volatility within a range is more likely than a sustained directional move in the immediate future. Traders must exercise discipline, closely monitor key levels at $0.70193 for support and $0.70715 for resistance, and wait for clear confirmation before committing capital. Patience and risk management remain the most crucial tools in navigating these choppy waters.
Track markets in real-time
AI-powered analysis, technical indicators and real-time price data.
Join Our Telegram Channel
Breaking market news, AI analysis and trading signals instantly.
Join Channel