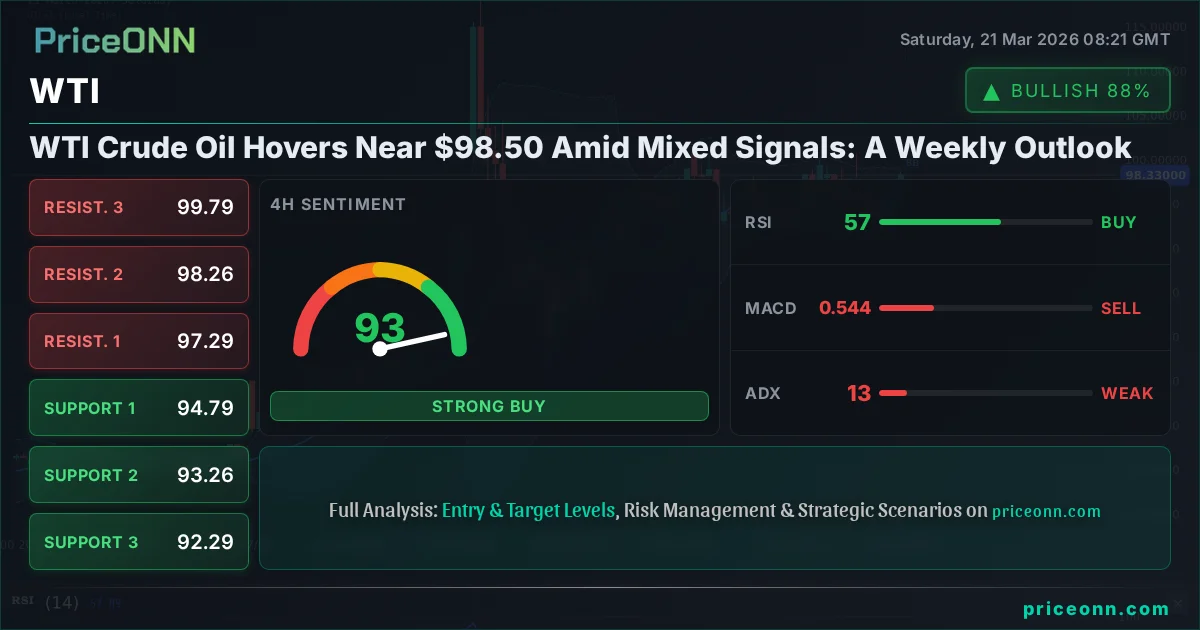
WTI Crude Oil Hovers Near $98.50 Amid Mixed Signals: A Weekly Outlook
WTI Crude Oil sees a volatile week, closing near $98.50. Mixed technicals and geopolitical crosscurrents create a neutral outlook for the week ahead.
The past week has been a period of intense scrutiny for WTI crude oil, with the benchmark trading around the $98.50 mark as traders and analysts grapple with a complex interplay of geopolitical tensions, shifting central bank expectations, and diverging market signals. While the immediate price action might suggest consolidation, a deeper dive into the technicals and the broader market context reveals a market on tenterhooks, awaiting clearer direction. This analysis delves into the key drivers that shaped the week and what to watch as we look ahead, focusing on the critical levels and sentiment shifts that will likely dictate WTI's trajectory.
- WTI crude oil closed the week near $98.50, reflecting a neutral market sentiment after significant intraday volatility.
- The ADX reading of 13.05 on the 1H chart indicates a weak trend, suggesting choppiness rather than a committed directional move.
- Geopolitical risks in the Middle East remain elevated, but de-escalation efforts are tempering immediate upside for oil prices, creating a tug-of-war.
- The strengthening US Dollar (DXY at 99.39) is acting as a headwind, capping potential rallies in oil prices by increasing the cost for holders of other currencies.
Navigating the Choppy Waters: WTI's Weekly Performance
Last week saw WTI crude oil dance around the $98.50 level, a price point that encapsulates the market's current indecision. The daily change of +3.87%, a significant jump to $3.67, closed the week with a bullish bias in terms of daily movement but the overall weekly picture is more nuanced. The range between $92.79 and $99.05 highlights the significant intraday swings, but the inability to decisively break through key resistance levels or capitulate at support levels paints a picture of consolidation rather than a strong trend. This indecision stems from conflicting forces: persistent geopolitical risks in the Middle East continue to support oil prices, while a strengthening US dollar and cautious risk sentiment in global equity markets are acting as counterweights. For traders, this environment demands patience and a keen eye on the confluence of technical signals and macroeconomic drivers that will ultimately break the stalemate.
The energy shock, as highlighted by recent news, is already impacting consumers more than a decade ago. This suggests underlying demand-side pressures might be more resilient than initially thought, providing a floor for prices. However, the market is also sensitive to any perceived de-escalation in the Middle East, which can trigger rapid price corrections, as seen in some of the news headlines referencing dips below $94. The interplay between supply-side risks (geopolitics) and demand-side considerations (global economy, inflation) creates a delicate balance, making the $98.50 area a critical pivot point. The upcoming week's price action will likely hinge on whether geopolitical tensions escalate further, or if broader economic concerns begin to dominate market sentiment.
Technical Crossroads: What the Indicators Are Saying
From a technical standpoint, WTI is at a fascinating juncture, with indicators offering a mixed bag of signals that underscore the current neutral outlook. On the 1-hour timeframe, the Average Directional Index (ADX) at 13.05 is particularly telling. This low ADX value signifies a weak trend, indicating that the recent price action is more range-bound and choppy rather than driven by strong directional momentum. While the Relative Strength Index (RSI) at 62.14 hovers in neutral territory, suggesting room for upward movement, it's not yet signaling overbought conditions that would warrant immediate caution. The Stochastic Oscillator, however, shows K=92.01 and D=89.49, firmly in overbought territory on the 1-hour chart, hinting at potential pullbacks. This divergence between the RSI and Stochastic on the short-term chart adds to the complexity.
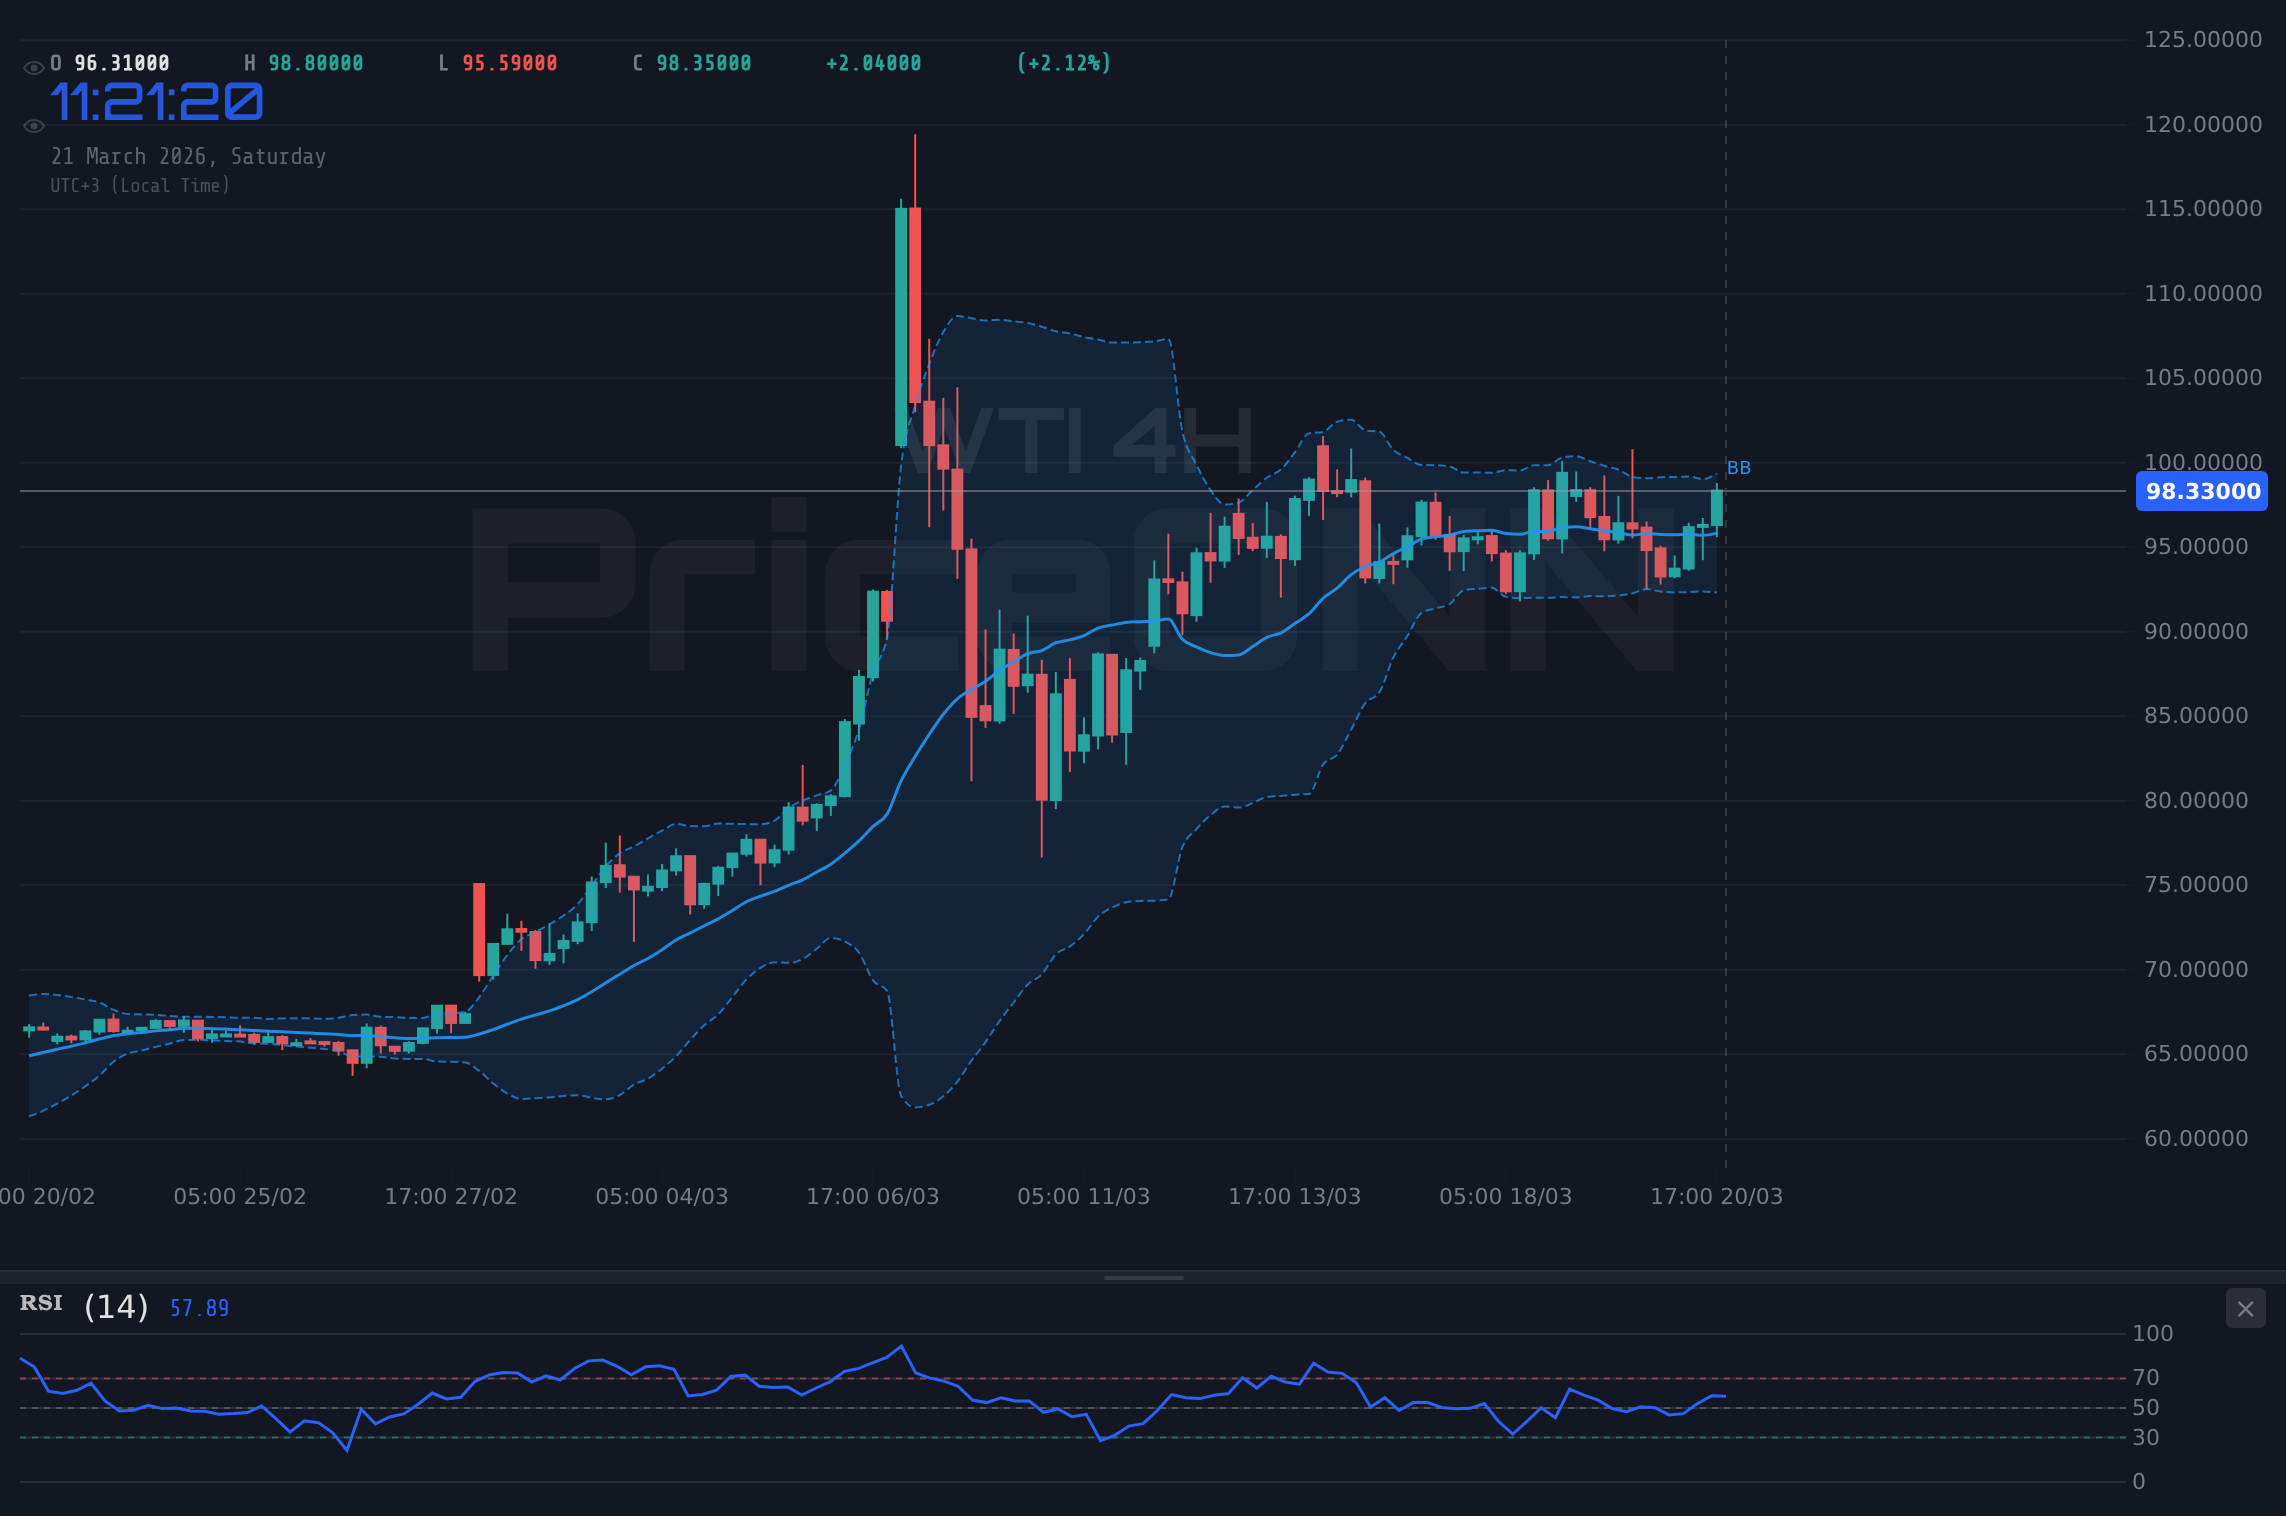
Moving to the 4-hour timeframe, the picture becomes slightly clearer, leaning towards a cautious bullish bias but with caveats. The trend strength is rated at 82%, indicating a more defined upward movement than on the 1-hour chart. The RSI at 57.26 remains in a healthy, non-overbought zone, and the MACD is showing positive momentum, although not yet decisively above its signal line. The Stochastic K=54.48 and D=33.93 suggests an upward move is favored. However, the ADX here is at 13.05, which is still quite low, reinforcing the idea of a weak underlying trend. This suggests that while there's some upward pressure, it lacks the conviction for a sustained rally without further catalysts. The Bollinger Bands on the 1-hour chart are hugging the upper band, but the overall weak ADX tempers enthusiasm.
On the daily chart, the trend is clearly defined as bullish with a strength of 100%, and the RSI at 70.65 is firmly in overbought territory. This is a classic sign that the market may be getting ahead of itself, and a pullback or consolidation is a distinct possibility. The Stochastic K=61.11 and D=51.74 still favors upside, but the RSI's position is a significant warning flag. The ADX at 59.27 confirms a very strong uptrend, but strong trends can also experience sharp, albeit temporary, pullbacks when overbought conditions are reached. This daily overbought RSI, coupled with the weak trend signals on shorter timeframes, creates a scenario where the bullish momentum might be losing steam, and traders should be prepared for potential downside correction even within a strong daily uptrend. The key is to watch if shorter-term indicators begin to align with the daily overbought signal, or if broader market forces provide a catalyst for a reversal.
Geopolitical Crosscurrents and Their Impact on Oil
The specter of geopolitical instability, particularly in the Middle East, continues to be a primary driver for WTI crude oil prices. Escalating tensions, as reported in recent news, create immediate supply disruption fears, which inherently push oil prices higher. This was evident in the sharp price movements observed throughout the week, driven by headlines and speculation. However, the market's reaction has also shown a degree of resilience to outright panic, suggesting that perhaps some of these geopolitical risks are already priced in, or that diplomatic efforts are being closely watched. The news mentioning de-escalation efforts and leaders seeking to calm concerns, even if temporary, can trigger significant sell-offs in oil, as witnessed when WTI dipped below $94. This sensitivity highlights the precarious balance between fear and cautious optimism in the energy markets.
The widening spread between Brent and WTI, a phenomenon that hit an 11-year high recently, also warrants attention. While not directly impacting WTI's absolute price, it reflects regional supply dynamics and logistical factors. News reports indicated Brent surging past $114 while WTI lagged, a divergence that can be influenced by factors like shipping disruptions, refinery issues, or differing geopolitical risk premiums applied to European versus US crude. Understanding this spread is crucial for a holistic view of the global oil market. Furthermore, the impact of sanctions, such as the US easing Venezuela sanctions, can also have a localized but noticeable effect on WTI, potentially increasing supply and capping price gains, as seen when WTI dipped below $98 in response to such news. These geopolitical and sanction-related events act as significant volatility triggers, demanding constant monitoring.
The broader narrative around energy shocks and their impact on consumers also plays a role. Reports suggest that current energy shocks are hitting consumers harder than a decade ago, implying that underlying demand might be more robust than a simple slowdown in economic growth would suggest. This could provide a fundamental floor for oil prices, as the global economy, despite its challenges, continues to require energy. However, this is a double-edged sword. Persistent high energy prices can, in turn, fuel inflation, prompting central banks to maintain tighter monetary policies, which could eventually dampen demand. This complex feedback loop means that geopolitical events need to be viewed through the lens of their potential impact on both supply and the global macroeconomic outlook.
Macroeconomic Headwinds: The Dollar's Dominance
The strengthening US Dollar Index (DXY), which closed the week near 99.39 with a daily gain of 0.48%, has emerged as a significant headwind for WTI crude oil. As the DXY appreciates, dollar-denominated commodities like oil become more expensive for holders of other currencies. This typically dampens demand and puts downward pressure on prices. The inverse correlation between the dollar and oil is a well-established market dynamic, and the current upward trend in the DXY suggests that this relationship will continue to weigh on WTI. The daily RSI for DXY at 58.15 indicates a healthy uptrend, and the ADX at 34.64 confirms a strong trend, suggesting the dollar's strength has a solid foundation for now.
This dollar strength is often intertwined with global risk sentiment and expectations around US monetary policy. A hawkish stance from the Federal Reserve, or indeed any major central bank, tends to bolster a currency. While the provided data doesn't include specific Fed Fund Futures or OIS pricing, the general market sentiment often reflects expectations about interest rate differentials. If US yields are perceived to be more attractive or if the Fed signals a more hawkish path than its peers, the dollar will likely continue to find support. This, in turn, puts a lid on commodity prices, including WTI. The news of rising US yields dimming gold's safe-haven appeal is a prime example of how macroeconomic factors directly influence commodity markets, and the same logic applies to oil, albeit with its own unique supply-side drivers.
Furthermore, the performance of major equity indices like the S&P 500 and Nasdaq, which saw significant drops of -1.21% and -1.65% respectively, suggests a decline in overall risk appetite. When investors become more risk-averse, they tend to move capital into perceived safe-haven assets, which can include the US dollar. This risk-off sentiment naturally puts pressure on riskier assets and commodities. For WTI, this means that even if geopolitical tensions remain high, a broad market selloff driven by economic fears could override the bullish supply-side narrative, leading to price declines. The correlation between WTI and equities is not always direct, but a sustained downturn in risk assets typically creates a challenging environment for commodities.
Correlation Analysis: WTI's Place in the Financial Ecosystem
Understanding WTI's movement requires looking beyond its own charts and considering its relationship with other major markets. The DXY's strength, as discussed, is a key correlative factor. With the DXY at 99.39, a level that has historically exerted pressure on oil, we can anticipate that further dollar appreciation would likely translate into resistance for WTI. Conversely, any significant weakening of the dollar could provide a tailwind for oil prices, assuming geopolitical risks remain elevated or increase. The current daily trend for DXY is bullish (92% strength), suggesting this dynamic will persist in the near term, acting as a constant brake on WTI's upside potential.
The performance of major equity indices, the S&P 500 and Nasdaq, also provides crucial context. Their significant drops last week signal a potential shift towards risk aversion. Historically, a decline in equity markets can correlate with a decrease in demand for riskier assets, including oil, as investors prioritize capital preservation. While oil prices are also influenced by supply-side shocks (like geopolitical events), a broad market selloff can overwhelm these factors. The fact that both indices are showing strong downward trends on the 1-hour and 4-hour charts suggests that this risk-off sentiment could continue, posing a challenge for WTI bulls. The ADX for S&P 500 at 44.59 and Nasdaq at 36.06 on the daily chart confirms strong downward trends, reinforcing this correlation.
Interestingly, the performance of gold and silver, which typically act as inflation hedges and safe havens, has been weak, with XAUUSD tumbling 3.28% and XAGUSD falling 6.67%. News reports mention gold falling below $4,500 as rising US yields dim safe-haven appeal. This is somewhat counterintuitive in a period of geopolitical tension. If gold, a traditional safe haven, is falling due to rising yields and a strong dollar, it suggests that the market narrative might be shifting from inflation fears and safe-haven demand towards concerns about economic growth and the impact of tighter monetary policy. For WTI, this could imply that while geopolitical supply risks are present, the market might be more focused on the demand-destruction potential of higher interest rates and a strong dollar, capping any significant upside moves for oil.
Canadian Dollar and Oil Prices: A Closer Look
The relationship between the Canadian Dollar (CAD) and oil prices, particularly WTI, is a crucial one for understanding North American market dynamics. Canada is a major oil producer, and its currency often moves in tandem with crude oil prices. Recent news from the economic calendar highlights this connection, with discussions around whether rising oil prices will derail Canada's inflation fight amid Middle East tensions. This suggests that elevated oil prices are a significant factor influencing the Bank of Canada's (BoC) policy decisions and the overall economic outlook.
Keywords like "cad jpy news bank of canada bank of japan oil prices" appearing in search trends indicate a strong market interest in the interplay between these currencies, central banks, and commodity prices. While this article focuses on WTI, the CAD's performance is a relevant indicator. If oil prices remain elevated due to geopolitical supply concerns, it could put upward pressure on the CAD, even if broader risk sentiment is negative. However, the Bank of Canada's own policy path, influenced by inflation and economic growth, will also play a critical role. If the BoC is seen as more hawkish than the Bank of Japan (BoJ), it could support the CAD/JPY pair, but sustained high oil prices could complicate the BoC's inflation fight, potentially leading to a more cautious stance. This intricate relationship means that traders watching WTI should also keep a close eye on Canadian economic data and the CAD's performance against other major currencies.
Key Levels and What They Mean for Traders
The $98.50 mark for WTI crude oil is more than just a price point; it's a psychological and technical battleground. On the 1-hour chart, the immediate support level is identified at $97.77, followed by $96.64 and $96.00. A decisive break below these levels, especially on increasing volume, could signal a shift in momentum and open the door for further downside. Resistance, on the other hand, is seen initially at $99.54, then $100.18, and a more significant hurdle at $101.31. Holding above $101.31 would be a strong bullish signal, suggesting a potential continuation of the uptrend.
Looking at the 4-hour timeframe, the support levels are situated at $94.79, $93.26, and $92.29. A failure to hold these levels could signal a deeper correction. The resistance levels to watch are $97.29, $98.26, and a more substantial barrier at $99.79. The current price action around $98.50 puts WTI precariously close to the 4-hour resistance, making a break above $99.79 a key short-term objective for the bulls. The daily chart presents broader levels: support at $91.26, $87.69, and $82.92, while resistance stands at $99.60, $104.37, and a significant psychological level at $107.94. These daily levels provide the longer-term context for any potential price movements.
The fact that the ADX is weak on shorter timeframes (1H and 4H) suggests that price action around these levels might be more erratic. Traders should be wary of false breakouts or breakdowns. Confirmation from other indicators, such as increased volume or a clear shift in RSI divergence, will be crucial before committing to a trade based solely on breaching these levels. The current neutral outlook implies that these levels will be tested, but the conviction behind the moves will be paramount in determining the ultimate direction. The market is essentially waiting for a catalyst to break this stalemate, making these key levels the battlegrounds where that direction will be decided.
The Role of Central Banks and Interest Rate Differentials
While geopolitical events often dominate the headlines for oil prices, the underlying macroeconomic environment, heavily influenced by central bank policies and interest rate differentials, plays a crucial role in shaping demand and overall market sentiment. The Federal Reserve's stance on interest rates remains a primary focus. If the Fed signals a more hawkish future, perhaps due to persistent inflation fears (which high oil prices can exacerbate), it could lead to higher US Treasury yields. This, in turn, strengthens the dollar and dampens economic activity, both of which are bearish for WTI. Conversely, any hint of a dovish pivot or a pause in rate hikes could weaken the dollar and support risk assets, potentially boosting oil prices.
The differential between US interest rates and those of other major economies, like the Bank of Canada (BoC) or the Bank of Japan (BoJ), also influences currency movements and capital flows. As mentioned in the keyword analysis, the relationship between CAD, JPY, and oil prices is closely watched. A widening interest rate differential in favor of the US could continue to support the dollar. However, if other central banks are perceived as being more aggressive in their tightening cycles, or if inflation remains stubbornly high in their respective economies, it could lead to currency strength that impacts oil demand and pricing dynamics. For instance, the Bank of Canada's approach to inflation, potentially complicated by rising oil prices, is a key factor to monitor for its impact on the CAD and, by extension, WTI.
The market's interpretation of central bank communication is paramount. Forward guidance, meeting minutes, and speeches from central bank officials can cause significant market shifts. Traders are constantly trying to price in the probability of future policy actions. For example, if market participants believe the Fed is less likely to cut rates soon due to inflation pressures (partly fueled by oil), this reinforces the bullish case for the dollar and bearish case for commodities like WTI. The absence of specific Fed Fund Futures or OIS data in the provided market context means relying on broader market sentiment and news flow to gauge these expectations. This uncertainty adds another layer to the already complex WTI outlook, emphasizing the need for a data-driven approach that incorporates both technical and fundamental viewpoints.
Market Sentiment and Risk Appetite
The prevailing market sentiment, often characterized as 'risk-on' or 'risk-off', is a critical overlay for analyzing WTI crude oil. Last week, the significant drops in the S&P 500 (-1.21%) and Nasdaq (-1.65%) clearly indicated a move towards risk aversion. This sentiment shift typically sees investors shedding assets perceived as riskier, which can include commodities, in favor of perceived safe havens like the US dollar or US Treasuries. Even if geopolitical events are creating upward pressure on oil prices due to supply concerns, a widespread 'risk-off' environment can counteract these forces by signaling expectations of slower global economic growth and, consequently, reduced oil demand.
The unusual weakness in gold and silver prices, despite geopolitical tensions, further complicates the sentiment picture. Typically, gold acts as a barometer for safe-haven demand and inflation expectations. Its decline, attributed to rising US yields dimming its appeal, suggests that the market's primary concern might be shifting from inflation to economic contraction or the impact of sustained high interest rates. If this narrative takes hold, it implies a potentially bearish outlook for commodities broadly, as demand destruction becomes a more significant factor than supply disruptions. This requires a nuanced approach to WTI analysis, acknowledging that even strong supply-side triggers might be muted if the overarching market sentiment is decidedly risk-off.
For WTI, this means that while geopolitical headlines can cause sharp, short-term price spikes, the sustainability of any rally will depend heavily on the broader economic outlook and risk appetite. If global markets continue to favor safety, WTI may struggle to maintain its current levels, even with ongoing supply risks. Conversely, a sudden shift back to risk-on sentiment, perhaps driven by positive economic data or dovish signals from central banks, could unlock further upside potential for oil. Monitoring the correlation between WTI, major equity indices, and the US dollar will be key to gauging the prevailing market sentiment and its likely impact on energy prices in the coming weeks.
The Week Ahead: What to Watch for WTI
As we look to the upcoming week, WTI crude oil remains poised at a critical juncture, with the $98.50 level acting as a pivotal point. The neutral outlook is largely dictated by the conflicting forces at play: persistent geopolitical risks in the Middle East providing underlying support, countered by a strengthening US dollar and cautious global risk sentiment. The technical picture, particularly the weak trend signals on shorter timeframes (low ADX) juxtaposed with daily overbought RSI conditions, suggests that any directional move will likely require a significant catalyst.
Key events to monitor will include any further developments in the Middle East, as these have proven to be immediate price movers. Additionally, central bank communications, particularly from the Federal Reserve, will be crucial. Any signals regarding future interest rate policy could significantly impact the US dollar and, consequently, WTI. Economic data releases, such as inflation figures or employment reports, will also provide insights into the global economic health and demand outlook for oil. Traders should pay close attention to the price action around the key support levels of $96.64 and $97.77, and resistance levels at $99.54 and $101.31. A decisive break above $101.31 could signal a renewed bullish push, while a close below $96.64 might indicate a deeper correction is underway.
The market's ability to digest current geopolitical risks while navigating macroeconomic headwinds will be the defining narrative. If risk appetite improves and the dollar shows signs of weakness, WTI could find renewed upward momentum. However, if economic concerns intensify and the dollar continues its ascent, WTI may face further pressure, even with ongoing supply-side risks. The current environment calls for careful risk management and a strategy that is adaptable to rapid shifts in sentiment and news flow. Patience will be key as the market seeks clarity.
Frequently Asked Questions: WTI Analysis
What happens if WTI breaks above the $99.54 resistance level?
A sustained move above $99.54, particularly on increased volume and confirmation from shorter-term indicators turning bullish, could signal a continuation towards the next resistance at $100.18. This would likely be driven by escalating geopolitical concerns or a weakening US dollar.
Should I consider buying WTI at current levels near $98.50 given the mixed technical signals?
Given the neutral outlook and conflicting indicators like a daily overbought RSI (70.65) versus weak short-term trend signals (ADX 13.05), caution is advised. A more prudent approach might be to wait for clearer confirmation, such as a break above $99.54 resistance with strong momentum, or a test of support near $96.64 with signs of reversal.
Is the RSI at 70.65 a strong sell signal for WTI?
An RSI of 70.65 on the daily chart indicates overbought conditions, which historically suggests a potential for price correction or consolidation. However, in a strong uptrend confirmed by a daily ADX of 59.27, the RSI can remain elevated for extended periods. It's a warning sign, not an immediate sell signal on its own, and should be considered alongside other indicators and price action.
How will upcoming US inflation data impact WTI prices this week?
Higher-than-expected inflation data could reinforce hawkish expectations for the Federal Reserve, potentially strengthening the US dollar and pressuring WTI prices. Conversely, inflation coming in cooler than anticipated might lead to dollar weakness and support oil prices, especially if geopolitical tensions remain high.
Technical Outlook Summary
| Indicator | Value | Signal | Interpretation |
|---|---|---|---|
| RSI (14) | 70.65 | Neutral | Overbought on daily, but can stay elevated in strong trends. |
| MACD Histogram | +0.38 | Bullish | Positive momentum, but needs confirmation above signal line. |
| Stochastic | K=61.11, D=51.74 | Bullish | %K > %D, favoring upside but watch for overbought signal. |
| ADX | 59.27 | Bullish | Very strong uptrend on daily, but weak on shorter timeframes. |
| Bollinger Bands | Upper Band | Bullish | Price trading above middle band, indicating upward pressure. |
Key Levels
Support Levels
Resistance Levels
Bearish Scenario: Profit-Taking Pressure Mounts
45% ProbabilityNeutral Scenario: Range-Bound Consolidation Continues
35% ProbabilityBullish Scenario: Geopolitical Fears Ignite Rally
20% ProbabilityTrack markets in real-time
AI-powered analysis, technical indicators and real-time price data.
Join Our Telegram Channel
Breaking market news, AI analysis and trading signals instantly.
Join Channel