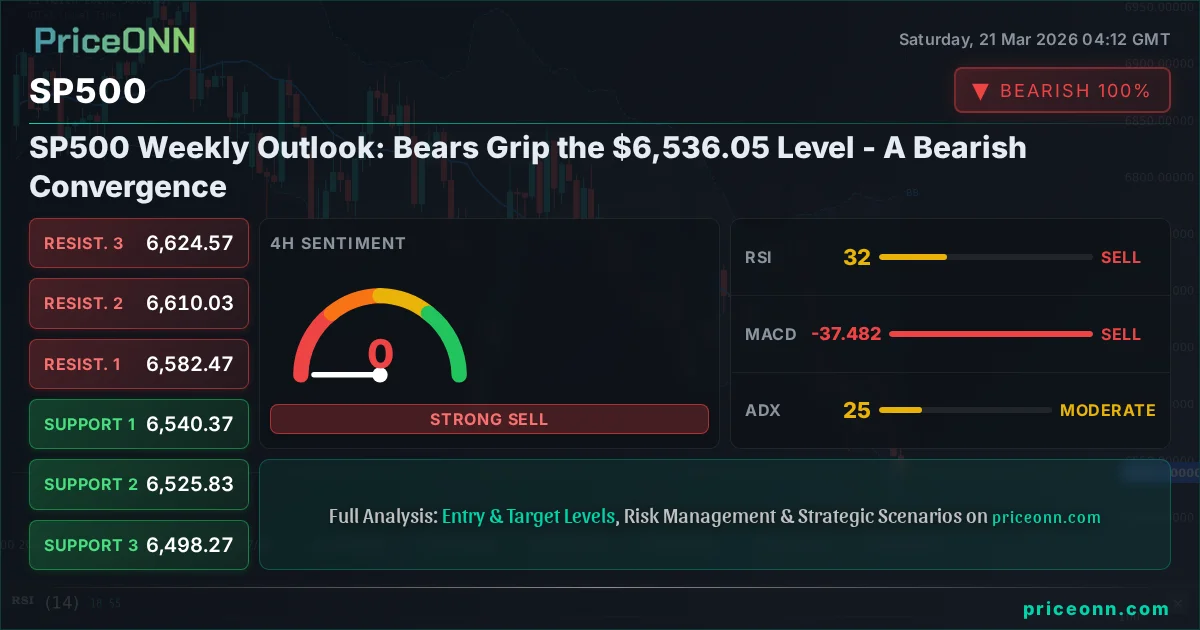
SP500 Weekly Outlook: Bears Grip the $6,536.05 Level - A Bearish Convergence
The S&P 500 closed at $6,536.05, facing strong bearish signals across multiple timeframes. Key support at $6,450.9 is now in focus.
The battleground for the S&P 500 has never been more evident. Last Friday's close at $6,536.05 marks a critical juncture, with bears firmly in control and a palpable sense of bearish convergence across key indicators. This isn't just another weekly review; it's an examination of why the current technical landscape paints a grim picture for the index, and what levels traders must watch as we navigate this challenging market environment. The narrative is shifting decisively towards downside risk, and understanding the confluence of factors driving this sentiment is paramount for any serious market participant.
The past week has been a stark reminder of market gravity. The S&P 500 has not only failed to hold its ground but has decisively broken through crucial support levels, a move that has significant implications for the coming trading sessions. The sheer force of the selling pressure, coupled with a strengthening US Dollar Index (DXY) and a significant downturn in gold prices, paints a picture of risk aversion taking hold. This isn't a minor pullback; it's a signal that the underlying sentiment has soured considerably, and the bulls are struggling to find any footing. The question now is not *if* further downside is possible, but *how far* and *how fast*.
- The S&P 500 closed Friday at $6,536.05, reflecting a strong bearish trend with ADX at 24.88 on the 4H chart.
- Critical support at $6,450.9 is now under intense pressure, with a break below potentially targeting $6,476.4.
- RSI readings across timeframes (37.5 on 1H, 32.29 on 4H, 32.5 on 1D) indicate significant bearish momentum.
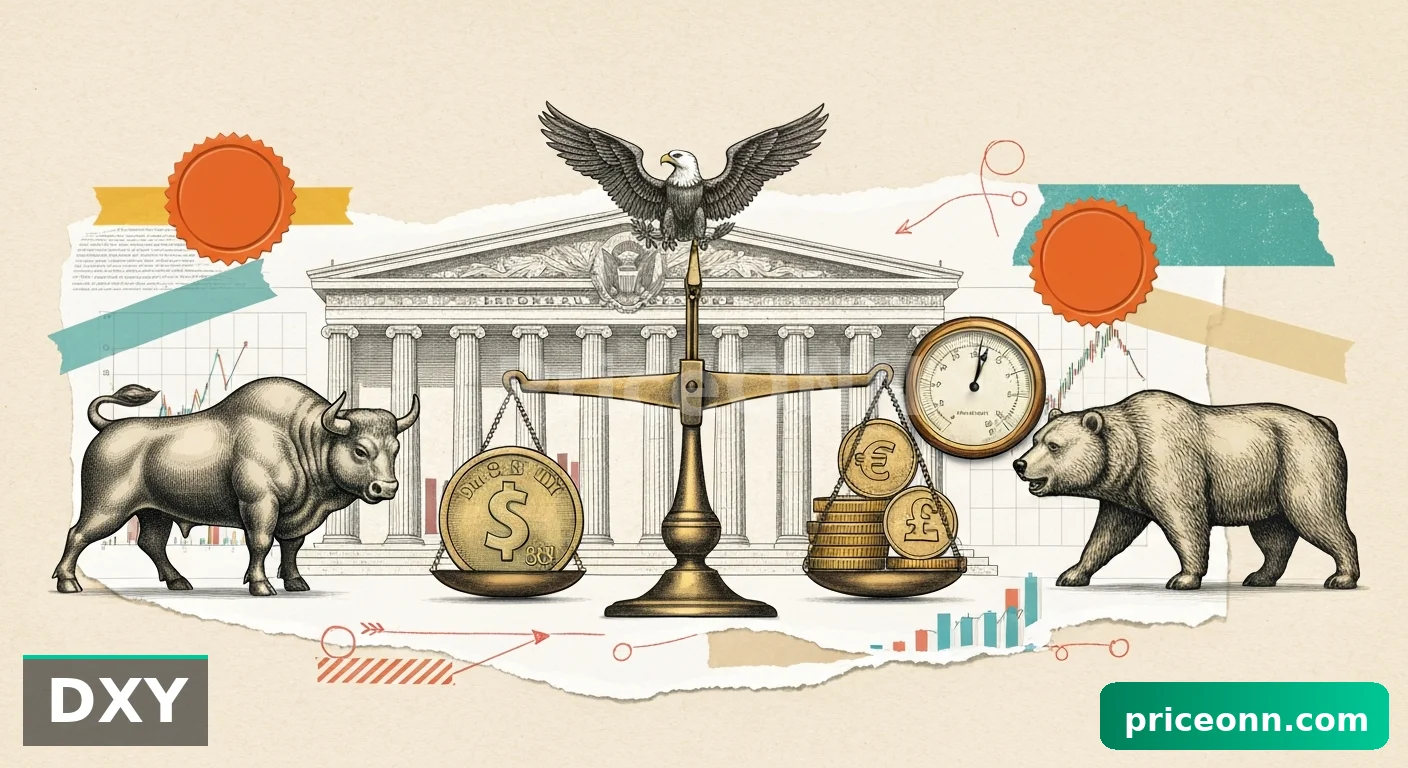
- The correlation with a strengthening DXY (currently at 99.39) and falling equities suggests a clear risk-off environment.
The technicals on the S&P 500 are screaming caution. On the 1-hour timeframe, the ADX is at 37.97, indicating a strong downtrend is firmly in place. This is corroborated by the RSI(14) sitting at 37.5, firmly in bearish territory and suggesting ample room for further declines. The MACD is below its signal line, reinforcing the negative momentum. The Stochastic Oscillator, while showing a slight uptick with %K at 21.76 above %D at 17.19, is still in the oversold region, which on a downtrend can often signal a brief pause rather than a reversal. The Bollinger Bands are also showing the price trading below the middle band, a classic sign of bearish pressure.
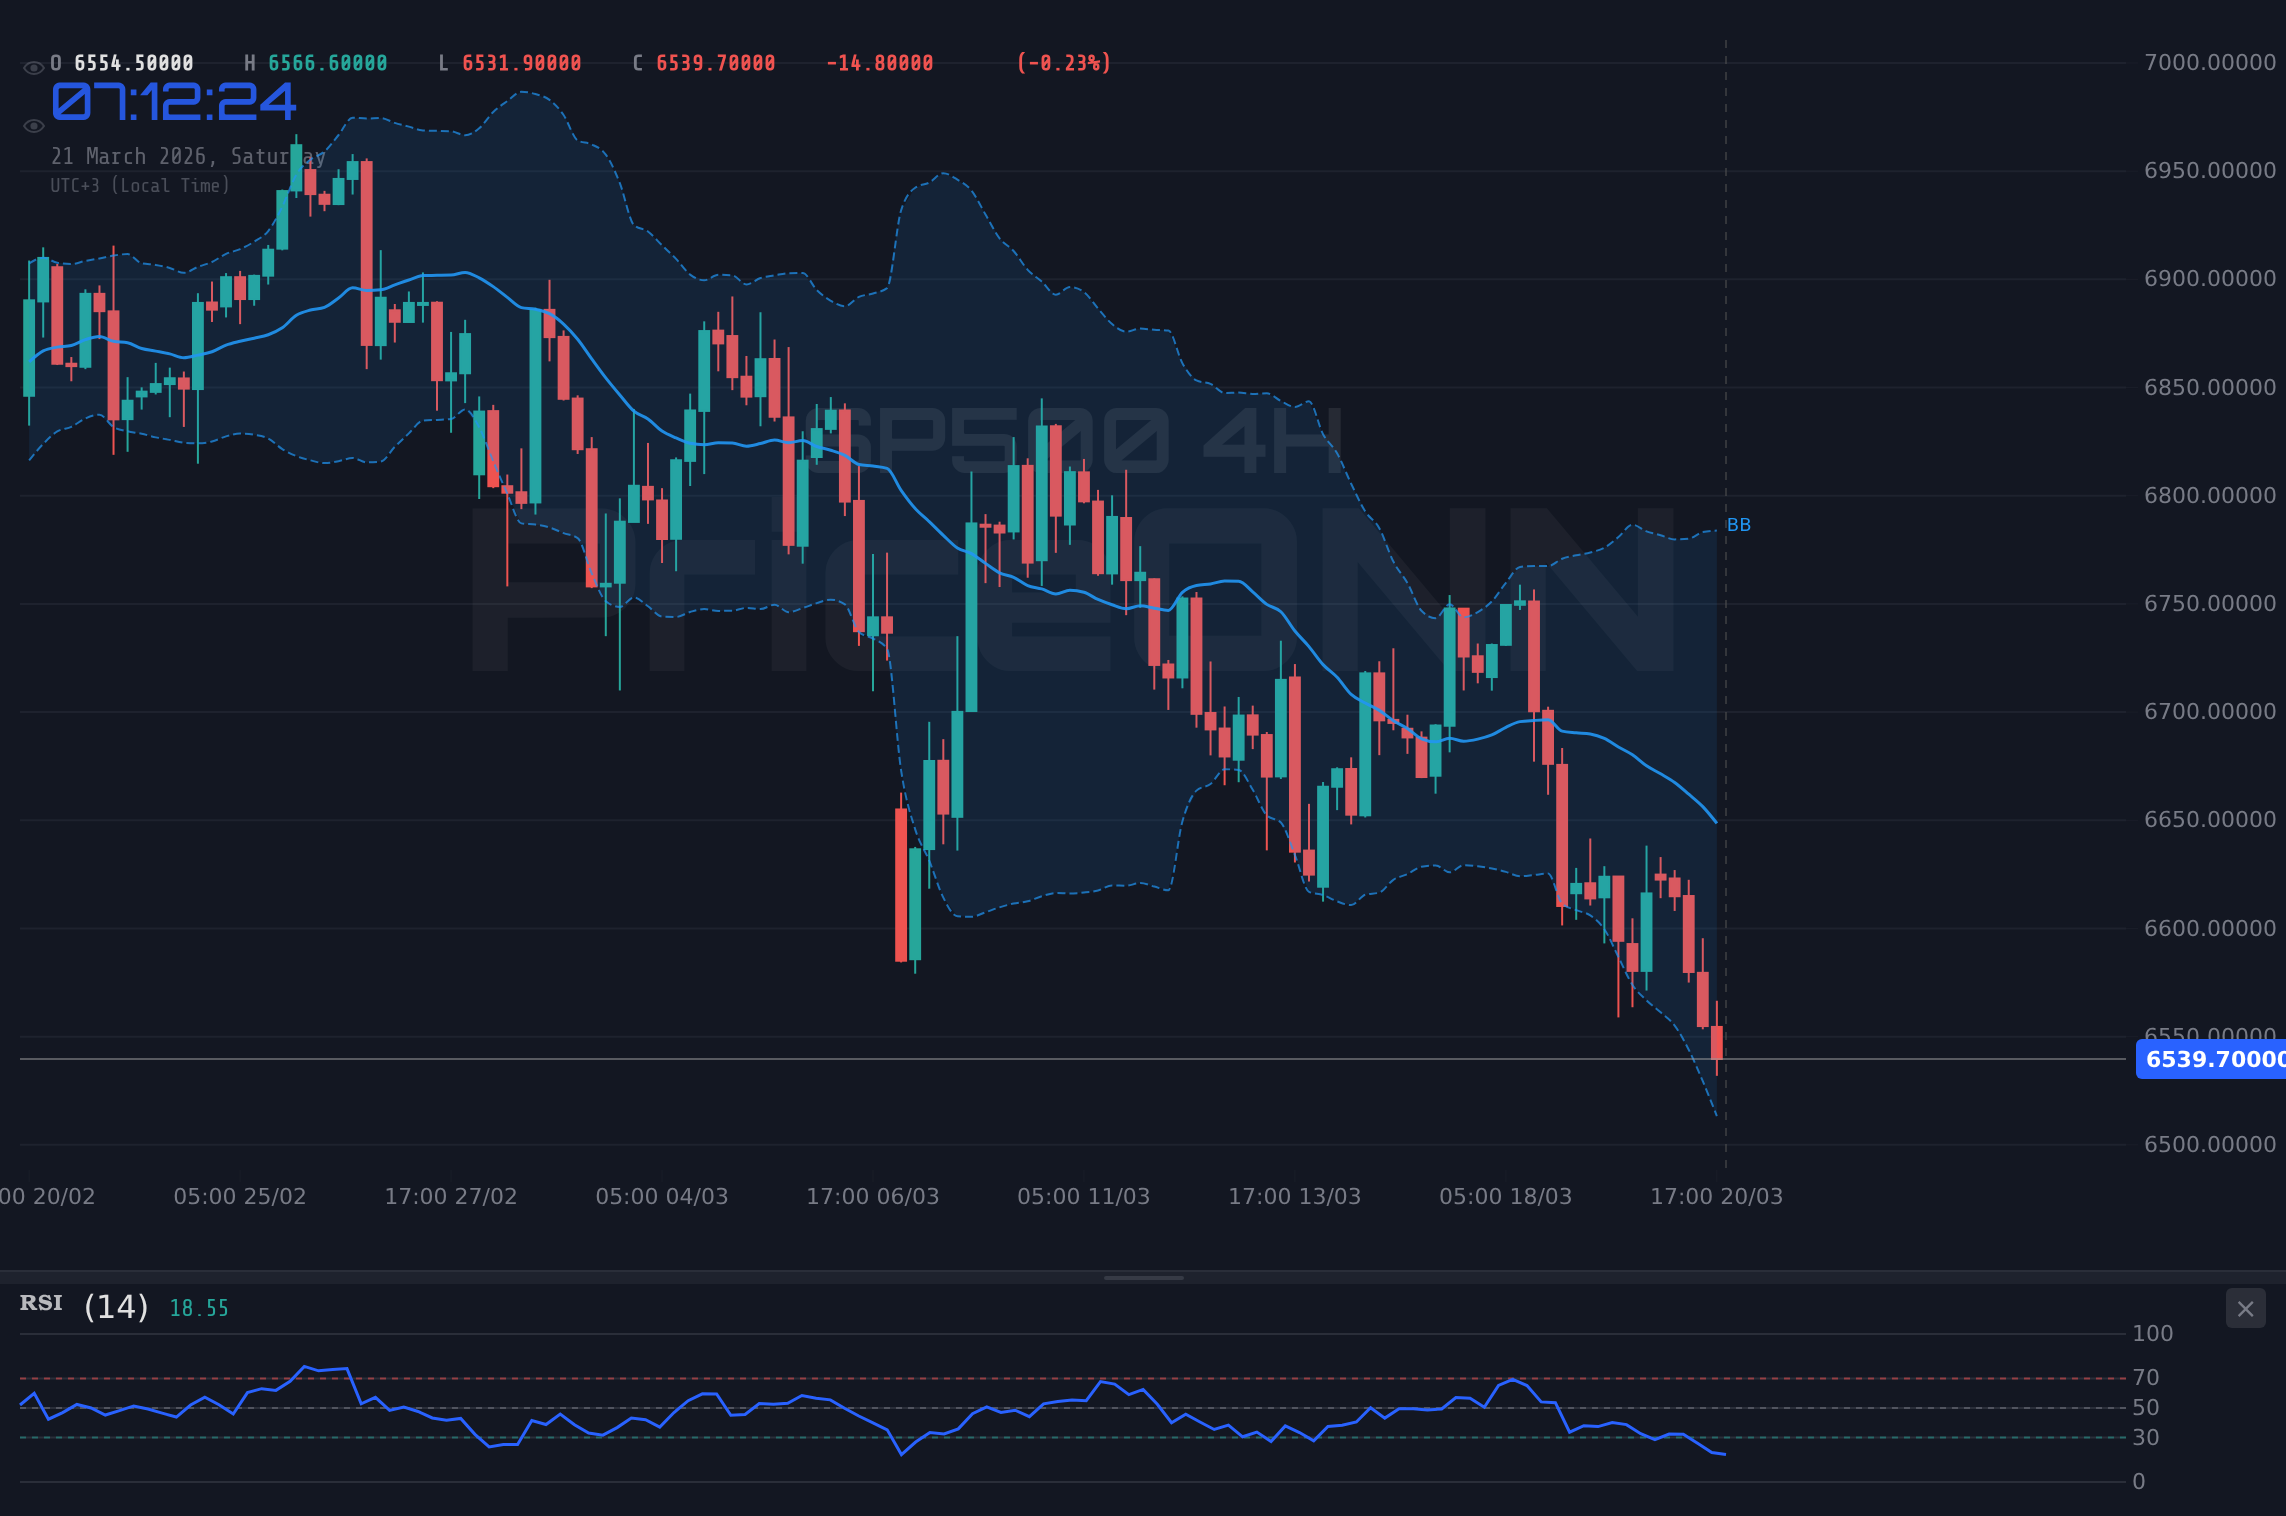
Moving to the 4-hour chart, the bearish picture intensifies. The ADX is still strong at 24.88, indicating a defined trend is in play, though slightly less aggressive than the 1-hour. However, the RSI(14) plummets to 32.29, and the MACD remains firmly negative, below its signal line. The Stochastic Oscillator confirms the bearish bias with %K at 10.33 falling below %D at 26.53, firmly in oversold territory and suggesting further downside is likely before any significant bounce. The price is also trading below the middle Bollinger Band, signaling a continuation of the bearish trend. The general signal across this timeframe is a strong 'SELL', with 8 out of 8 indicators pointing downwards.
The daily chart offers no respite, confirming the bearish conviction. The ADX stands at 44.59, a very strong trend indicator, confirming that the current move is not a mere fluctuation but a significant directional push. The RSI(14) is at 32.5, still deeply oversold and indicating substantial room for price to fall before any potential exhaustion is signaled. The MACD is deeply negative and below its signal line, underscoring the persistent selling pressure. The Stochastic Oscillator's %K (16.23) is below %D (27.82), reinforcing the oversold condition and potential for further declines. The price is trading below the lower Bollinger Band, a condition often associated with strong downtrends or potential capitulations. The overall signal is a strong 'SELL', reflecting the overwhelming bearish sentiment on this longer timeframe.
The correlation with the US Dollar Index (DXY) is a crucial element in this bearish thesis for the S&P 500. As the DXY continues its ascent, currently trading at 99.39, it exerts downward pressure on risk assets like equities. The DXY's 1-hour chart shows a bullish trend with an RSI of 56.78 and a MACD above its signal line, indicating upward momentum. The 4-hour chart also shows a rising trend with an RSI of 51.52, suggesting the dollar's strength is not a fleeting moment but a more sustained move. The daily chart reinforces this, with an RSI of 58.15 and a strong ADX of 34.64. This consistent dollar strength typically correlates inversely with US equities, as foreign investors face higher costs for dollar-denominated assets, thereby reducing demand.
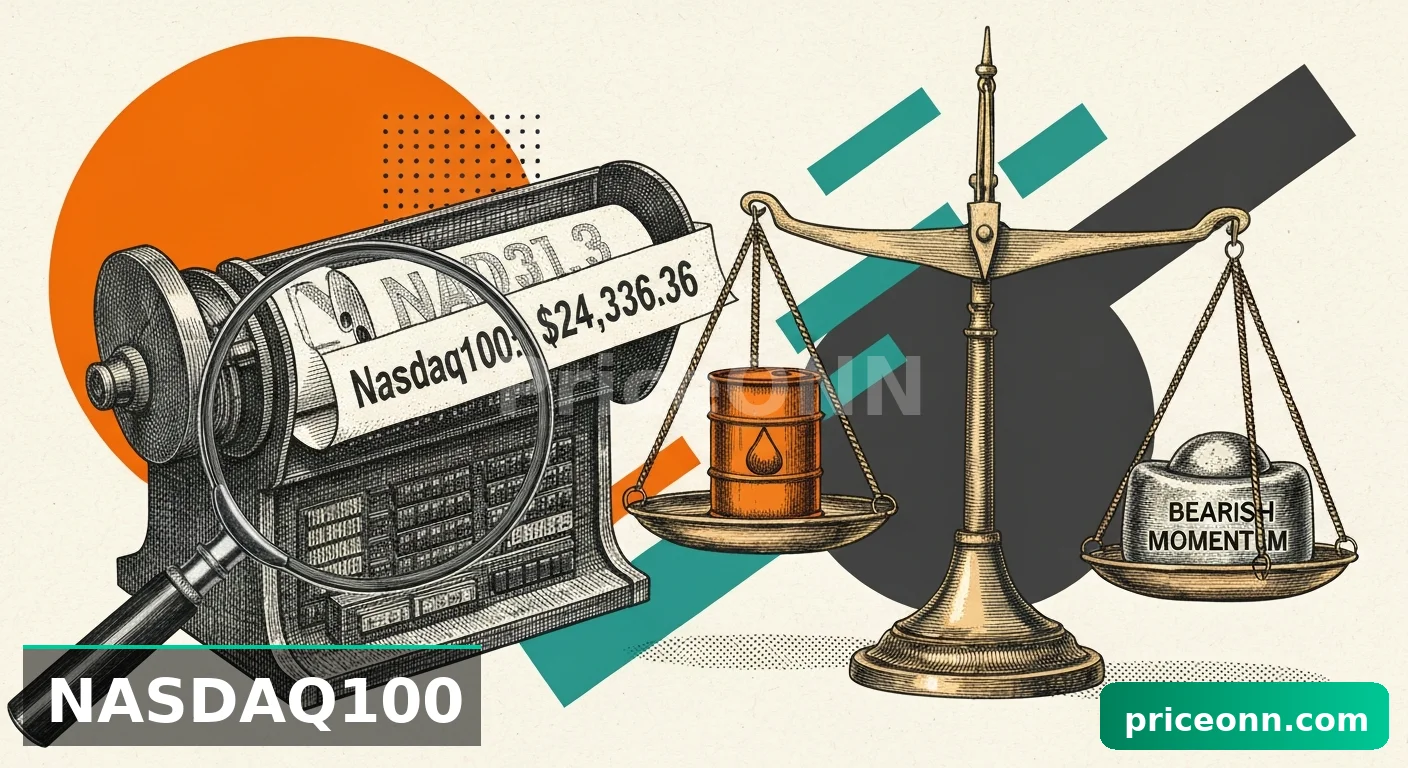
This inverse relationship is clearly visible when examining the broader market sentiment. The sharp decline in the S&P 500, Nasdaq 100, and Dow Jones 30 is indicative of a risk-off environment. The Nasdaq 100, for instance, is showing a strong downtrend on the 1-hour (ADX 38.15, RSI 35.56) and 4-hour (ADX 22.4, RSI 31.45) charts, with the daily chart also confirming a downtrend (ADX 36.06, RSI 32.5). Similarly, the Dow Jones 30 exhibits strong bearish signals across all timeframes, with the daily ADX at 41.79 and RSI at 27.02, signaling a deeply oversold condition. This widespread equity weakness suggests that investors are rotating out of riskier assets and seeking the safety of cash or dollar-denominated instruments.
Precious metals, traditionally seen as safe-haven assets, are also reflecting this risk-off sentiment, albeit with some nuances. Gold (XAUUSD) has experienced a dramatic fall, closing last week at $4,497.65. The 1-hour chart shows a strong downtrend (ADX 31.58, RSI 28.95), the 4-hour confirms it (ADX 62.9, RSI 19.17), and even the daily chart, while showing a weaker trend (ADX 19.51), has RSI at 29.58 and Stochastic deeply oversold. This sharp decline in gold, despite geopolitical tensions, suggests that the overwhelming force of rising US yields and a strong dollar is overshadowing its safe-haven appeal for now. Silver (XAGUSD) has followed suit, with a strong downtrend on the 1-hour (ADX 36.09, RSI 30.51) and 4-hour (ADX 57.74, RSI 27.22) charts.
The energy markets present a contrasting picture, adding another layer of complexity to the overall market dynamic. Brent crude is showing bullish momentum on the 1-hour (RSI 62.15, ADX 17.96) and 4-hour (RSI 60.64, ADX 25.01) charts, with the daily chart exhibiting a very strong uptrend (ADX 65.23, RSI 82.55). WTI crude oil also shows a strong daily uptrend (ADX 59.27, RSI 70.65). This surge in oil prices, likely fueled by escalating geopolitical tensions in the Gulf and supply concerns, acts as a significant inflationary driver. This inflationary pressure could complicate the Federal Reserve's stance, potentially forcing them to maintain a hawkish outlook, which in turn supports the dollar and weighs on equities and gold. The market is therefore caught in a tug-of-war between risk-off sentiment and inflation fears.
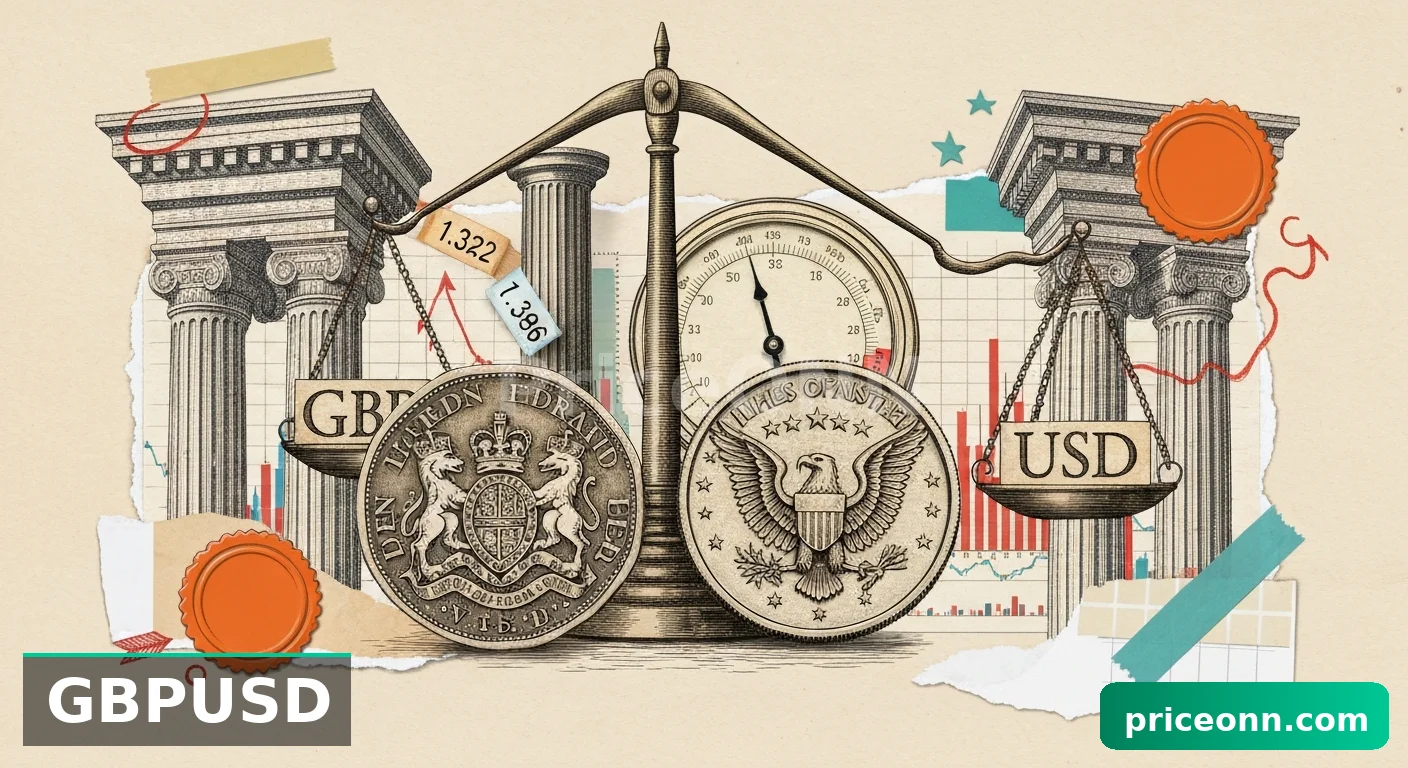
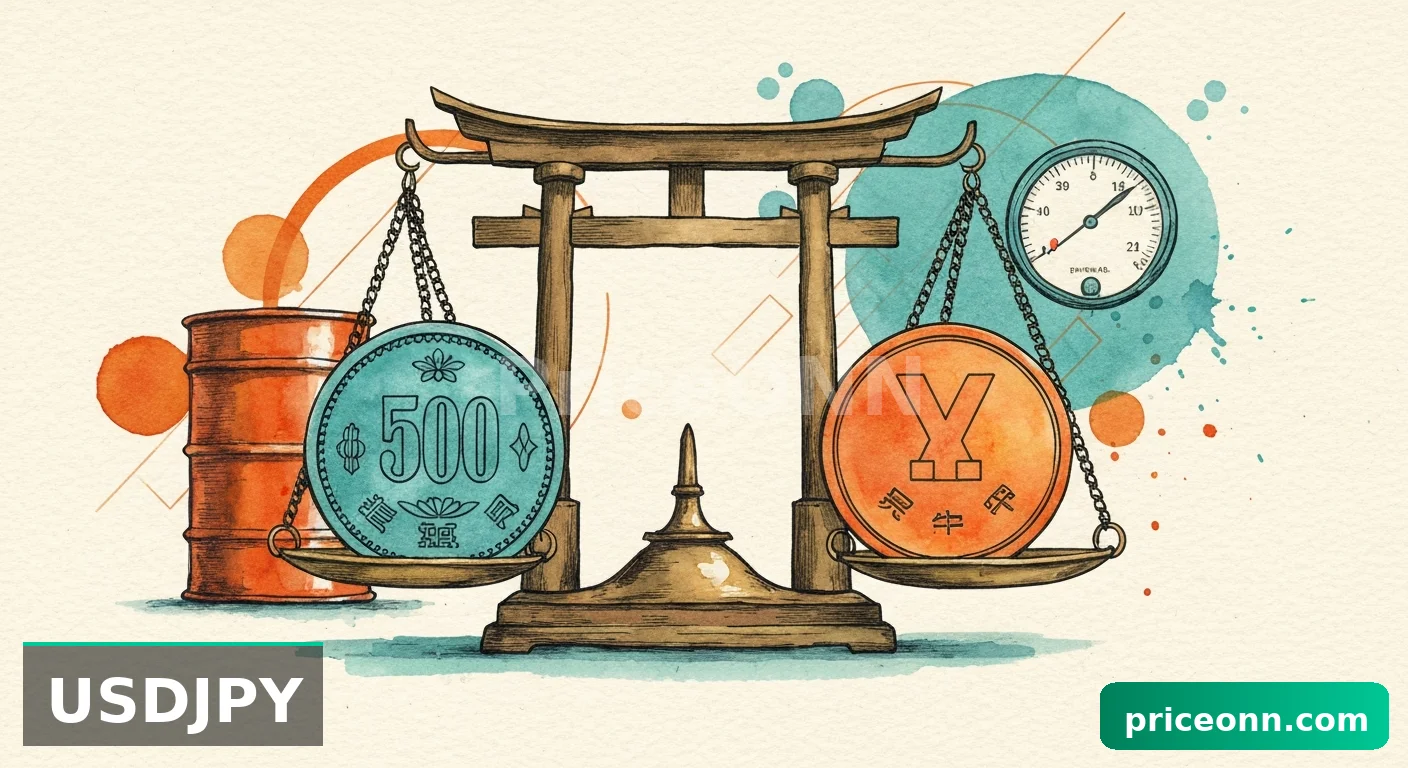
The Forex market reflects this complex interplay of factors. EURUSD is showing a mixed picture. While the 1-hour and 4-hour charts suggest a potential for a bounce (bullish signals in Stochastic and MACD on 4H, RSI above 50), the daily chart presents a strong bearish trend (ADX 37.37, RSI 44.34). This suggests that while there might be short-term relief for the Euro, the overarching trend remains downwards, likely supported by a strong dollar. USDJPY, on the other hand, shows a consistent upward bias. The 1-hour and 4-hour charts display bullish momentum, and the daily chart also leans bullish (RSI 59.49, ADX 22.03), indicating that the carry trade and safe-haven demand for the dollar against the Yen remain robust. GBPUSD and AUDUSD are displaying clear bearish trends across multiple timeframes, mirroring the risk-off sentiment and dollar strength. GBPUSD shows a strong daily downtrend (ADX 29.92, RSI 45.27), and AUDUSD exhibits a bearish trend on the 1-hour (ADX 22.47, RSI 34.27) and daily (ADX 20.48, RSI 47.97) charts.
The economic calendar, while not explicitly detailed with future events in the provided data, always plays a crucial role. Last week's market movements suggest that any data hinting at persistent inflation or a hawkish Federal Reserve stance would be detrimental to the S&P 500. Conversely, signs of cooling inflation or a dovish pivot, however unlikely currently, could offer temporary respite. The market is highly sensitive to central bank rhetoric and economic releases, especially those related to employment and inflation. Given the current strong dollar and rising oil prices, the Fed's path forward is likely to remain data-dependent, but with a clear bias towards controlling inflation, which generally implies higher rates or at least sustained higher rates for longer.
This confluence of technical weakness, dollar strength, risk aversion in equities, and inflationary pressures creates a challenging environment. The S&P 500's failure to hold key support levels is a significant bearish signal. The $6,536.05 closing price is now a critical resistance, and the immediate downside targets are clear. The support levels at $6,491.3, $6,476.4, and $6,450.9 are the next lines of defense. A decisive break below $6,450.9 would likely accelerate selling pressure, potentially triggering a cascade of stop-loss orders and pushing the index towards lower, more significant support levels.
Considering the strength of the bearish signals across multiple timeframes, the outlook for the S&P 500 remains decidedly bearish in the short to medium term. The technical indicators - strong ADX, oversold RSI, negative MACD, and price action below key moving averages - all align to suggest further downside. While markets can always present short-term bounces, the underlying conditions do not favor a sustained recovery without a significant shift in macro sentiment or central bank policy. Therefore, any rallies should be viewed with skepticism, likely representing opportunities for bears to re-enter or for short-term traders to take profits before the next leg down.
The battle between bulls and bears has reached a critical point. The bears have seized the initiative, evidenced by the S&P 500's close at $6,536.05 and the overwhelming bearish technical signals. While short-term bounces are always possible in volatile markets, the confluence of a strong dollar, rising oil prices creating inflationary fears, and a general risk-off sentiment points towards further weakness. The key levels mentioned - $6,450.9 as immediate support and $6,531.7 as resistance - will be crucial in determining the next directional move. For now, the path of least resistance appears to be downwards, and traders should position accordingly, prioritizing risk management above all else.
The current market environment demands vigilance and a disciplined approach. While the technical picture for the S&P 500 is predominantly bearish, markets are rarely linear. Unexpected news or shifts in central bank rhetoric could alter the trajectory. However, based on the data available, the odds favor further downside. Traders should remain cautious, focusing on risk management and looking for opportunities that align with the prevailing trend. The $6,450.9 support level is a key area to watch; a break below it could signal a more accelerated decline. Until then, expect continued volatility as the market digests the current macroeconomic headwinds.
Bearish Scenario: Downside Momentum Continues
65% ProbabilityNeutral Scenario: Consolidation Around Key Support
25% ProbabilityBullish Scenario: Short-Term Bounce or Reversal
10% ProbabilityFrequently Asked Questions: S&P 500 Analysis
What happens if the S&P 500 breaks below the $6,450.90 support level?
A break below $6,450.90 would likely trigger further selling pressure, potentially accelerating the downtrend. This could lead to price testing the $6,476.40 level, and if that fails, the market could see a swift move towards the $6,300.00 zone.
Should I buy the S&P 500 at current levels near $6,536.05 given the oversold RSI?
Buying solely based on an oversold RSI at $6,536.05 is risky. While RSI is at 32.5 on the daily, the strong bearish trend indicated by ADX 44.59 suggests further downside is probable. A confirmed bounce above $6,572.10 would be needed to consider a bullish entry, but the probability is currently low.
Is the ADX at 44.59 a strong sell signal for the S&P 500 on the daily chart?
An ADX reading of 44.59 on the daily chart signifies a very strong trend, and given the price action, it strongly indicates a robust downtrend. This level confirms that the current market move has significant momentum and is not a weak or consolidating trend.
How will the strengthening DXY at 99.39 affect the S&P 500 in the coming week?
The DXY's current strength at 99.39 typically exerts downward pressure on US equities like the S&P 500 due to its inverse correlation. This suggests that continued dollar strength could further weigh on the index, making a sustained rally difficult without a significant shift in monetary policy expectations.
Track markets in real-time
AI-powered analysis, technical indicators and real-time price data.
Join Our Telegram Channel
Breaking market news, AI analysis and trading signals instantly.
Join Channel