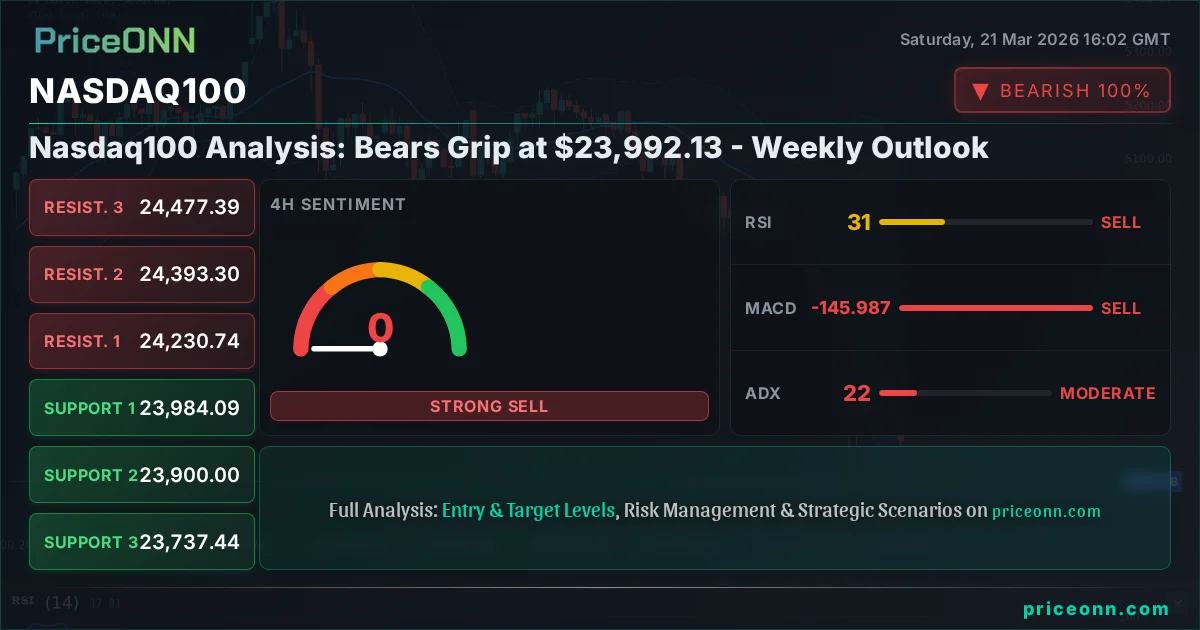
Nasdaq100 Analysis: Bears Grip at $23,992.13 - Weekly Outlook
Nasdaq100 faces bearish pressure at $23,992.13. Key levels and indicators suggest a cautious outlook for the week ahead.
As the trading week draws to a close, the Nasdaq100 stands at a critical juncture, currently priced at $23,992.13. This level, a focal point for market participants, reflects a week dominated by bearish sentiment and a palpable shift in risk appetite. The technological heartbeat of the U.S. stock market has been under significant pressure, influenced by a confluence of macroeconomic factors and shifting central bank expectations. Having tracked the Nasdaq100 closely through the recent market cycles, it's clear that the bears have tightened their grip, presenting a complex picture for investors navigating these choppy waters. This analysis delves into the current technical landscape, intermarket correlations, and potential scenarios shaping the Nasdaq100's path forward.
- RSI at 37.5 on the 1H chart signals bearish momentum is building, but not yet in extreme territory.
- Critical support for the Nasdaq100 sits at 23,675.46, a level tested multiple times this week.
- The ADX at 37.97 on the 1H chart confirms a strong downward trend is in play.
- Fed rate expectations are currently driving the Nasdaq100's correlation with DXY, which is at 99.39, indicating a potential headwind for equities.
The past week has been a stark reminder of market volatility, with the Nasdaq100 experiencing a significant downturn. Last Friday's close saw the index trading around this current $23,992.13 mark, but the week's trading saw a clear downward trajectory. The bears have been relentless, pushing the index lower and testing key support levels. This bearish sentiment is not occurring in a vacuum; it's deeply intertwined with broader market dynamics, including the strength of the US Dollar Index (DXY), commodity price action, and evolving expectations around central bank policies, particularly from the Federal Reserve. Understanding these intermarket correlations is crucial for deciphering the Nasdaq100's immediate future. The DXY, currently hovering around 99.39, has shown a tendency to pressure risk assets like the Nasdaq100 when it strengthens, and indeed, the dollar has seen gains this week, adding to the headwinds faced by tech stocks.
The decline in the Nasdaq100 is further amplified by the weakness observed in other major indices. The S&P 500, currently trading at 6536.05, has also seen a substantial drop of 1.21% (-80.15) on the day, indicating a broad-based risk-off sentiment gripping the equity markets. Similarly, the Dow Jones Industrial Average (DJIA) is down 0.62% (-284) at 45801. This synchronized decline across major U.S. stock indices suggests that investors are rotating out of riskier assets, seeking refuge in safer havens. The Nasdaq100, often more sensitive to changes in risk appetite due to its heavy weighting of growth and technology stocks, is bearing the brunt of this sentiment shift. This broad market weakness paints a concerning picture for the tech-heavy index, suggesting that the current downward pressure may have further room to run.
Navigating the Technical Terrain: Nasdaq100's Indicators
Delving deeper into the technicals, the 1-hour chart for the Nasdaq100 presents a picture of established bearish momentum. The trend is decidedly downwards, with a strength of 99%, indicating a strong conviction among sellers. The Relative Strength Index (RSI) at 35.56 on this timeframe suggests that the index is moving away from overbought territory and into a more neutral, albeit bearish-leaning, zone. While not yet oversold, this reading indicates that the selling pressure has been significant, and any immediate upward retracement might be met with renewed selling interest. The MACD (Moving Average Convergence Divergence) further supports this bearish outlook, showing negative momentum with the MACD line positioned below its signal line. This is a classic sign that downward momentum is building, reinforcing the prevailing downtrend. The Stochastic Oscillator, with %K at 19.01 and %D at 15.01, is deep in oversold territory. This suggests that the index is technically oversold on this short-term timeframe, which could hint at a potential short-term bounce or consolidation. However, caution is warranted, as oversold conditions can persist in strong downtrends.
The Average Directional Index (ADX) on the 1-hour chart stands at 38.15. Readings above 25 generally indicate a strong trend, and this value confirms that the current bearish move is well-established and carries significant strength. This means that attempting to trade against this trend, for example, by buying into the weakness, carries a higher degree of risk. The Bollinger Bands also reinforce the bearish narrative, with the price currently trading below the middle band and approaching the lower band. This indicates increased selling pressure and suggests that further downside might be on the cards. The immediate support level to watch on this timeframe is 23,675.46, followed by 23,768. Conversely, resistance is seen at 23,972.48 and 23,823.97. A break below the 23,675.46 support level would likely signal a continuation of the sharp downtrend, potentially opening the door for further declines.
Shifting to the 4-hour timeframe, the bearish trend remains firmly in place, albeit with a slightly reduced strength of 92%. This suggests that while the trend is still strong, some consolidation might be occurring as the market digests recent moves. The RSI(14) at 32.29 continues to hover in the neutral-to-oversold region, indicating that the index is heavily oversold, but not yet at extreme levels that would typically signal an imminent reversal. The MACD remains bearish, with negative momentum persisting. However, the narrowing gap between the MACD line and its signal line might suggest that the bearish momentum is starting to decelerate, though a bullish crossover has not yet occurred. This could be an early sign of a potential shift, but confirmation is needed.
The Stochastic Oscillator on the 4-hour chart is firmly in oversold territory, with %K at 10.33 and %D at 26.53. This deep oversold condition, coupled with the ADX at 24.88 suggesting a moderately strong trend, presents a conflicting picture. While the trend is still strong enough to be considered bearish, the extreme oversold readings on the Stochastic could foreshadow a short-term bounce or at least a period of consolidation. The Bollinger Bands are also showing the price trading below the middle band, indicating a bearish bias. Key support levels on this timeframe are 6525.83 and 6498.27, with resistance eyed at 6582.47 and 6610.03. The general signal across multiple indicators on this timeframe leans towards selling, but the oversold Stochastic warrants close observation for any potential shift in sentiment.
On the daily timeframe, the Nasdaq100's trend is classified as bearish with a strength of 100%. This indicates a very strong conviction in the current direction. The RSI(14) at 32.5 is deep in the oversold zone, a reading that historically has often preceded significant price bounces. However, in strong downtrends, RSI can remain oversold for extended periods. This suggests that while a potential buying opportunity might be forming from a longer-term perspective, short-term traders should exercise extreme caution. The MACD histogram is negative and below the signal line, confirming the persistent bearish momentum. The Stochastic Oscillator, with %K at 16.23 and %D at 27.82, is also deeply oversold. This confluence of oversold indicators on the daily chart is a significant signal that cannot be ignored, even within a strong downtrend. It suggests that a significant technical rebound could be on the horizon, though the timing and magnitude remain uncertain.
The ADX on the daily chart is at 44.59, which signifies a very strong trending environment. This robust trend strength is a testament to the power of the current bearish move. The Bollinger Bands are showing the price trading below the lower band, a condition often referred to as 'walking the band,' which signifies extreme bearishness. Key support levels on the daily chart are 6569.53, 6522.87, and 6486.83. Resistance is located at 6652.23, 6688.27, and 6734.93. The overall signal on the daily chart is overwhelmingly bearish (7 Sell, 0 Buy, 0 Neutral), reflecting the dominance of the downward trend. However, the deeply oversold RSI and Stochastic readings suggest that the market might be due for a correction or a bounce, even if the broader trend remains intact. This divergence between strong trend strength and oversold conditions is a critical point of analysis for the coming week.
Intermarket Dynamics: DXY, Commodities, and Risk Sentiment
The Nasdaq100's performance is intrinsically linked to the broader market environment, and this week has been a prime example. The US Dollar Index (DXY), currently at 99.39, has been a significant factor. As the DXY strengthens, it typically exerts downward pressure on risk assets like the Nasdaq100, as the cost of holding non-dollar denominated assets increases, and global liquidity tightens. The DXY's upward movement this week, reflecting a potential 'risk-off' sentiment or renewed focus on US economic resilience, has acted as a headwind for the Nasdaq100. The positive momentum on the 1-hour DXY chart, with RSI at 56.78 and MACD showing positive momentum, further supports this correlation. This suggests that as long as the dollar remains strong or shows signs of further appreciation, it will likely continue to weigh on the Nasdaq100.
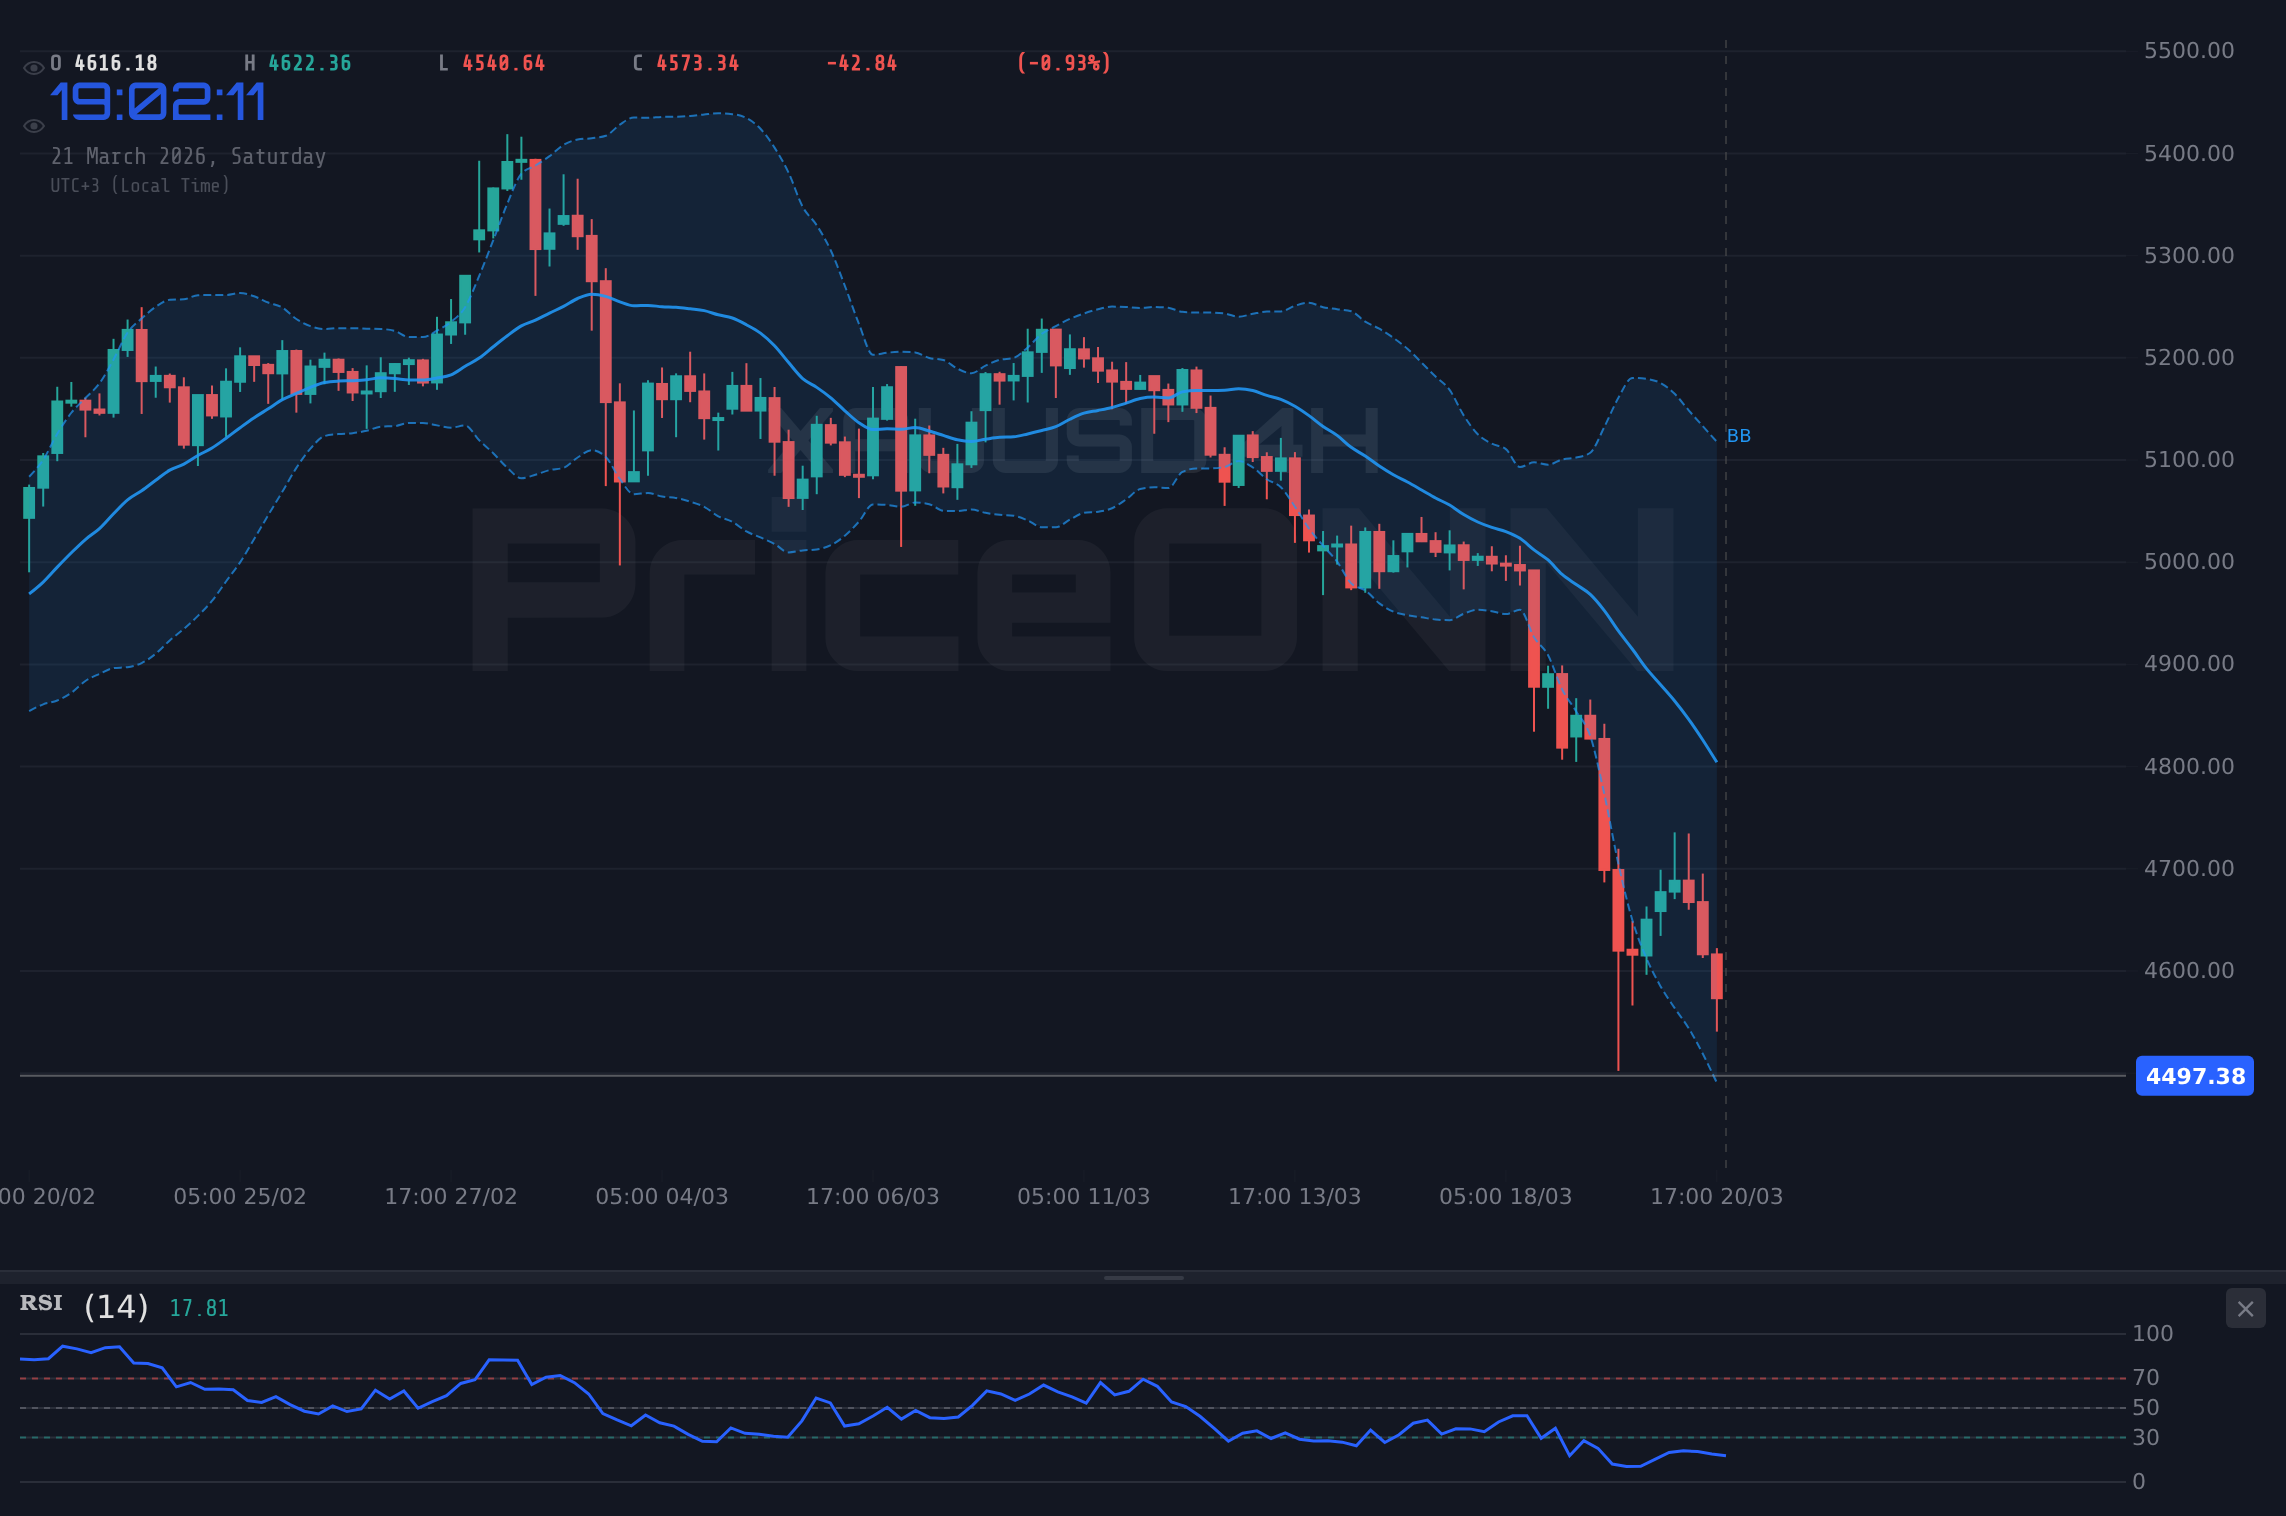
Commodities have also painted a mixed but generally bearish picture for risk assets. Gold (XAUUSD) is currently trading at 4497.65, down significantly by 3.28% (-152.56) on the day. This sharp decline in gold, a traditional safe-haven asset, is somewhat counterintuitive if a full-blown risk-off scenario is playing out. However, the aggressive selling in gold, with RSI at 28.95 and ADX at 31.58 indicating a strong downtrend, might suggest a broader deleveraging across all asset classes, including traditionally safe ones, as liquidity concerns mount. Silver (XAGUSD) has experienced an even sharper plunge, down 6.67% (-4.86) to 67.9. This steep drop in precious metals, alongside the equity market selloff, points towards a significant flight to cash or very safe assets, rather than a rotation into traditional safe havens. The energy markets, however, are showing strength. Brent crude is up 4.81% (5.18) to 112.79, and WTI crude is up 3.87% (3.67) to 98.5. This rise in oil prices, potentially driven by geopolitical tensions or supply concerns, could add to inflationary pressures. Higher energy prices can indirectly impact the Nasdaq100 by increasing operating costs for companies and potentially leading to tighter monetary policy if inflation becomes more persistent.
The prevailing risk sentiment is clearly leaning towards 'risk-off'. This is evident not only in the Nasdaq100's performance but also in the broader equity market selloff and the sharp declines in gold and silver. Investors appear to be prioritizing capital preservation over growth, leading to a sell-off across most risk-sensitive assets. The geopolitical landscape, with ongoing tensions in the Middle East and broader global uncertainties, likely contributes to this cautious stance. News reports highlighting potential supply chain disruptions due to geopolitical events, such as those mentioned regarding the Iran conflict potentially undermining the AI stock market boom, underscore the interconnectedness of global events and market sentiment. This pervasive risk aversion is a significant headwind for growth-oriented sectors that dominate the Nasdaq100, making a sustained recovery challenging in the near term.
Central bank policy, particularly that of the Federal Reserve, remains a critical driver. While the Fed recently held interest rates steady, market expectations for future policy are constantly evolving. The current economic data, including the persistent strength in oil prices contributing to inflation concerns, might influence the Fed's future decisions. If the market perceives that the Fed will maintain a hawkish stance for longer, or even consider further tightening to combat inflation, this would typically be negative for growth stocks and the Nasdaq100. Conversely, any sign of a dovish pivot or a pause in rate hikes could provide some relief. Currently, the market seems to be pricing in a scenario where inflation remains somewhat sticky, making the Fed's path forward uncertain and contributing to the overall market caution. This uncertainty surrounding monetary policy is a key factor contributing to the current volatility and the bearish sentiment observed in the Nasdaq100.
Trading Scenarios and Key Levels to Watch
Given the current technical setup and market sentiment, several scenarios could unfold for the Nasdaq100 in the coming week. The interplay between strong bearish trends on shorter timeframes and oversold conditions on the daily chart creates a complex trading environment. Key levels remain paramount in defining the short-to-medium term direction.
Bearish Scenario: Continued Downside Pressure
65% ProbabilityConsolidation/Choppy Action
25% ProbabilityBullish Reversal/Short-Covering Rally
10% ProbabilityThe immediate focus for traders will be the 1-hour support level at 23,675.46. A decisive break below this level, confirmed by increased volume and bearish momentum indicators, would validate the bearish scenario and open the path towards lower targets. Conversely, if the index manages to hold this level and shows signs of consolidation, ranging between 23,675.46 and 23,972.48, a neutral scenario could play out. This would likely involve choppy price action as buyers and sellers battle for control. A strong bullish scenario, which currently appears less probable given the prevailing sentiment, would require a decisive break above the 1-hour resistance at 23,972.48, potentially triggering short-covering rallies.
The daily chart's oversold conditions present a potential catalyst for a short-covering rally or a more substantial bounce if key resistance levels are overcome. However, the strong ADX reading of 44.59 on the daily chart suggests that any such bounce might face significant headwinds from the prevailing strong downtrend. Traders should be wary of buying into early bounces without clear confirmation, as the market could be setting up for a 'bull trap' before resuming its downward trajectory. The confluence of strong bearish signals on shorter timeframes and oversold conditions on the daily chart creates a high degree of uncertainty, demanding a disciplined approach to risk management. The probability assigned to the bearish scenario (65%) reflects the current technical dominance of selling pressure, while the neutral scenario (25%) acknowledges the possibility of consolidation due to oversold conditions. The bullish scenario (10%) remains a low-probability event based on the current data.
Market Sentiment and Future Outlook
The current market sentiment is undeniably risk-averse. The sharp declines in major indices and commodities like gold and silver, coupled with the strength in the US Dollar, paint a clear picture of investors prioritizing safety. Geopolitical tensions, such as the ongoing situation in the Middle East, continue to cast a shadow over global markets, exacerbating this risk-off sentiment. News reports about potential supply chain disruptions stemming from these conflicts, like the one suggesting the Iran conflict could undermine the AI stock market boom, highlight the fragility of current market conditions. This environment makes it challenging for growth-oriented assets like those dominating the Nasdaq100 to find sustained upward momentum.
Looking ahead to next week, several factors will be critical in shaping the Nasdaq100's trajectory. The ongoing analysis of Federal Reserve policy remains paramount. Any hints from Fed officials regarding future interest rate decisions, particularly in light of persistent inflation concerns (partly fueled by rising oil prices), will be closely watched. Market participants will be parsing economic data releases for clues about the health of the US economy and the potential path of monetary policy. The strength of the US Dollar will also continue to be a key correlation to monitor. A sustained rise in the DXY could continue to pressure the Nasdaq100, while any signs of dollar weakness might offer some respite.
From a technical standpoint, the Nasdaq100 is at a crossroads. The strong bearish trend on shorter timeframes is battling with oversold conditions on the daily chart. Key levels to watch remain 23,675.46 as immediate support and 23,972.48 as immediate resistance. A break below the support could signal a continuation of the downtrend towards 23,000, while a convincing break above resistance might trigger a short-covering rally towards 24,500. The ADX readings across multiple timeframes indicate strong trending conditions, suggesting that whichever direction the market breaks, it is likely to be with conviction. Therefore, traders should focus on risk management and wait for clear signals from price action and indicators before committing to positions.
The current market environment demands patience and discipline. The data suggests a strong bearish bias in the short to medium term, but the oversold conditions on the daily chart offer a glimmer of hope for a potential technical bounce. The interplay between macroeconomic data, central bank policy, geopolitical events, and technical levels will dictate the Nasdaq100's path. As always, managing risk effectively by employing stop-losses and position sizing appropriately is crucial, especially in such a volatile and uncertain market landscape. The market always provides opportunities, but it is essential to wait for the right setup and trade with conviction.
Frequently Asked Questions: Nasdaq100 Analysis
What happens if the Nasdaq100 breaks below the 23,675.46 support level?
A confirmed break below 23,675.46 on the 1-hour chart would validate the bearish scenario, potentially triggering further downside towards targets like $23,450.00 and even the significant psychological support at $23,000.00. This would signal a continuation of the strong downtrend.
Should I consider buying the Nasdaq100 at current levels of $23,992.13 given the oversold RSI on the daily chart?
Buying at current levels carries significant risk due to the strong bearish trend on shorter timeframes. While the daily RSI is oversold (32.5), indicating potential for a bounce, confirmation is needed. A more prudent approach would be to wait for a confirmed break above 1-hour resistance at 23,972.48, with a low probability (10%) scenario targeting $24,200.00.
Is the RSI at 37.5 a strong sell signal for the Nasdaq100 right now?
An RSI of 37.5 on the 1-hour chart indicates bearish momentum but is not an extreme sell signal. It suggests that selling pressure is present but not yet overwhelming. Combined with a strong ADX of 38.15, it reinforces the prevailing downtrend rather than signaling an immediate reversal.
How will the evolving Federal Reserve policy expectations affect the Nasdaq100 this week?
Evolving Fed policy expectations are a major driver. If data suggests persistent inflation, the Fed might maintain a hawkish stance, which would likely continue to pressure the Nasdaq100. Conversely, any dovish signals could offer temporary relief. The DXY at 99.39 reflects some of this uncertainty, acting as a headwind for the index.
Technical Outlook Summary
| Indicator | Value | Signal | Interpretation |
|---|---|---|---|
| RSI (14) | 37.5 | Bearish | Moving away from oversold, indicating downward momentum. |
| MACD Histogram | - | Bearish | Negative momentum persists below signal line. |
| Stochastic | K:19.01, D:15.01 | Bearish | Deeply oversold on 1H, potential short-term bounce but trend is down. |
| ADX | 38.15 | Bullish | Strong trend strength indicating conviction in the current move. |
| Bollinger Bands | Lower Band | Bearish | Price below middle band, indicating selling pressure. |
Track markets in real-time
AI-powered analysis, technical indicators and real-time price data.
Join Our Telegram Channel
Breaking market news, AI analysis and trading signals instantly.
Join Channel