GBP/USD Weekly Outlook: $1.33 Holds as Bearish Sentiment Dominates
GBP/USD hovers around $1.33 amid persistent dollar strength and market uncertainty. Will key support levels hold next week?
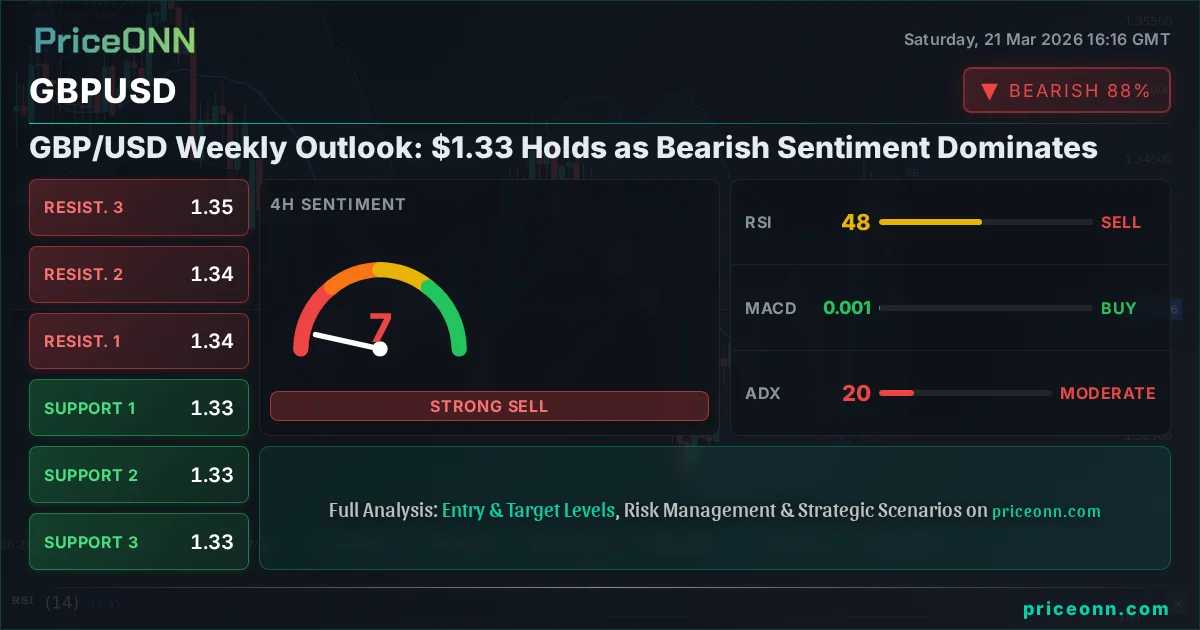
The British Pound Sterling (GBP/USD) began its weekly assessment navigating a critical juncture around the $1.33 level. Last Friday's close saw the pair trading at approximately $1.33435, reflecting a week dominated by shifting central bank expectations and a resurgent US Dollar. As traders recalibrate their positions entering the new week, the prevailing sentiment leans bearish, underscored by the Dollar Index (DXY) showing renewed strength and key commodity markets experiencing significant pullbacks. This analysis delves into the technicals, fundamentals, and geopolitical undercurrents shaping the GBP/USD's trajectory, focusing on the critical price action around $1.33 and exploring the most probable scenarios for the week ahead.
- GBP/USD is currently trading near $1.33435, with a strong bearish signal from 1-day and 4-hour timeframes (ADX at 29.92 and 20.06 respectively).
- Key support for GBP/USD is identified at $1.32893 (S1), with further levels at $1.31565 (S2) and $1.30681 (S3). Resistance is seen at $1.35105 (R1).
- The US Dollar Index (DXY) is showing bullish momentum on the daily chart (ADX 34.64), reinforcing downward pressure on GBP/USD.
- Recent market data indicates significant drops in gold and silver, suggesting a risk-off environment that typically favors the US Dollar over Sterling.
Navigating the Cross-Market Currents: DXY, Commodities, and Risk Sentiment
The Dollar's Resurgence and its Impact
The US Dollar Index (DXY) has been a dominant force in recent market movements, and its performance provides crucial context for GBP/USD. Data shows the DXY trading around 99.39, exhibiting strong bullish momentum on the daily timeframe with an ADX reading of 34.64. This indicates a robust uptrend, and its upward trajectory typically exerts downward pressure on major currency pairs like GBP/USD. The recent retreat below 100.00, as reported by news outlets, was a temporary pause; the underlying strength and its correlation with safe-haven demand suggest further potential for dollar appreciation. This dynamic is particularly relevant as we assess the outlook for Sterling, given the historical inverse relationship between the DXY and GBP/USD. A stronger dollar often implies capital flowing into US assets, potentially at the expense of other currencies, including the British Pound.Commodities in Turmoil: A Risk-Off Signal?
The sharp decline observed in precious metals like gold and silver this past week offers a stark indicator of shifting market sentiment. Gold prices (XAUUSD) plummeted to $4,497.65, and silver (XAGUSD) followed suit, dropping to $67.90. This broad-based commodity sell-off, extending to copper, signals a notable risk-off sentiment gripping global markets. Historically, such an environment favors safe-haven assets, with the US Dollar often being the primary beneficiary. The steep drop in metals, particularly gold, suggests that investors are moving away from perceived inflation hedges and seeking refuge in the relative stability of the dollar. This trend directly impacts GBP/USD, as a risk-averse environment typically dampens demand for riskier currencies like Sterling, reinforcing the bearish outlook for the pair.Equity Market Weakness and Intermarket Correlations
The performance of major equity indices, such as the S&P 500 and Nasdaq 100, further corroborates the risk-off narrative. The S&P 500 closed around 6,536.05, down 1.21% on the day, while the Nasdaq 100 saw a more significant decline of 1.65% to finish near 23,992.13. This broad market weakness is a critical factor for GBP/USD. When equity markets show sustained downward pressure, it often correlates with a retreat in risk appetite. This can lead to a decrease in demand for riskier assets and currencies, including Sterling, while simultaneously boosting demand for safe-haven currencies like the US Dollar. The correlation between equities and GBP/USD is not always direct, but a significant downdraft in global stocks, as observed, typically creates headwinds for the Pound.Geopolitical Tensions and Their Lingering Influence
While the market initially seemed to shrug off escalating geopolitical tensions, their underlying impact on supply chains and inflation expectations remains a significant undercurrent. News reports indicate that conflicts, such as those in the Middle East, continue to pose risks to global energy markets and supply chain stability. Although Brent crude prices saw a notable surge to $112.79, reflecting immediate supply concerns, the broader implication of geopolitical instability is an increase in market uncertainty. Such uncertainty often amplifies the appeal of safe-haven assets, primarily the US Dollar, and can weigh on currencies like GBP/USD. The potential for further escalations or unexpected developments means that geopolitical risk remains a key wildcard, capable of triggering sharp market movements and reinforcing the prevailing risk-off sentiment. This backdrop makes it challenging for Sterling to find sustained upward momentum.GBP/USD Technical Chart Pattern Recognition: A Bearish Predominance
The 1-Day Chart: Trend Confirmation and Divergence
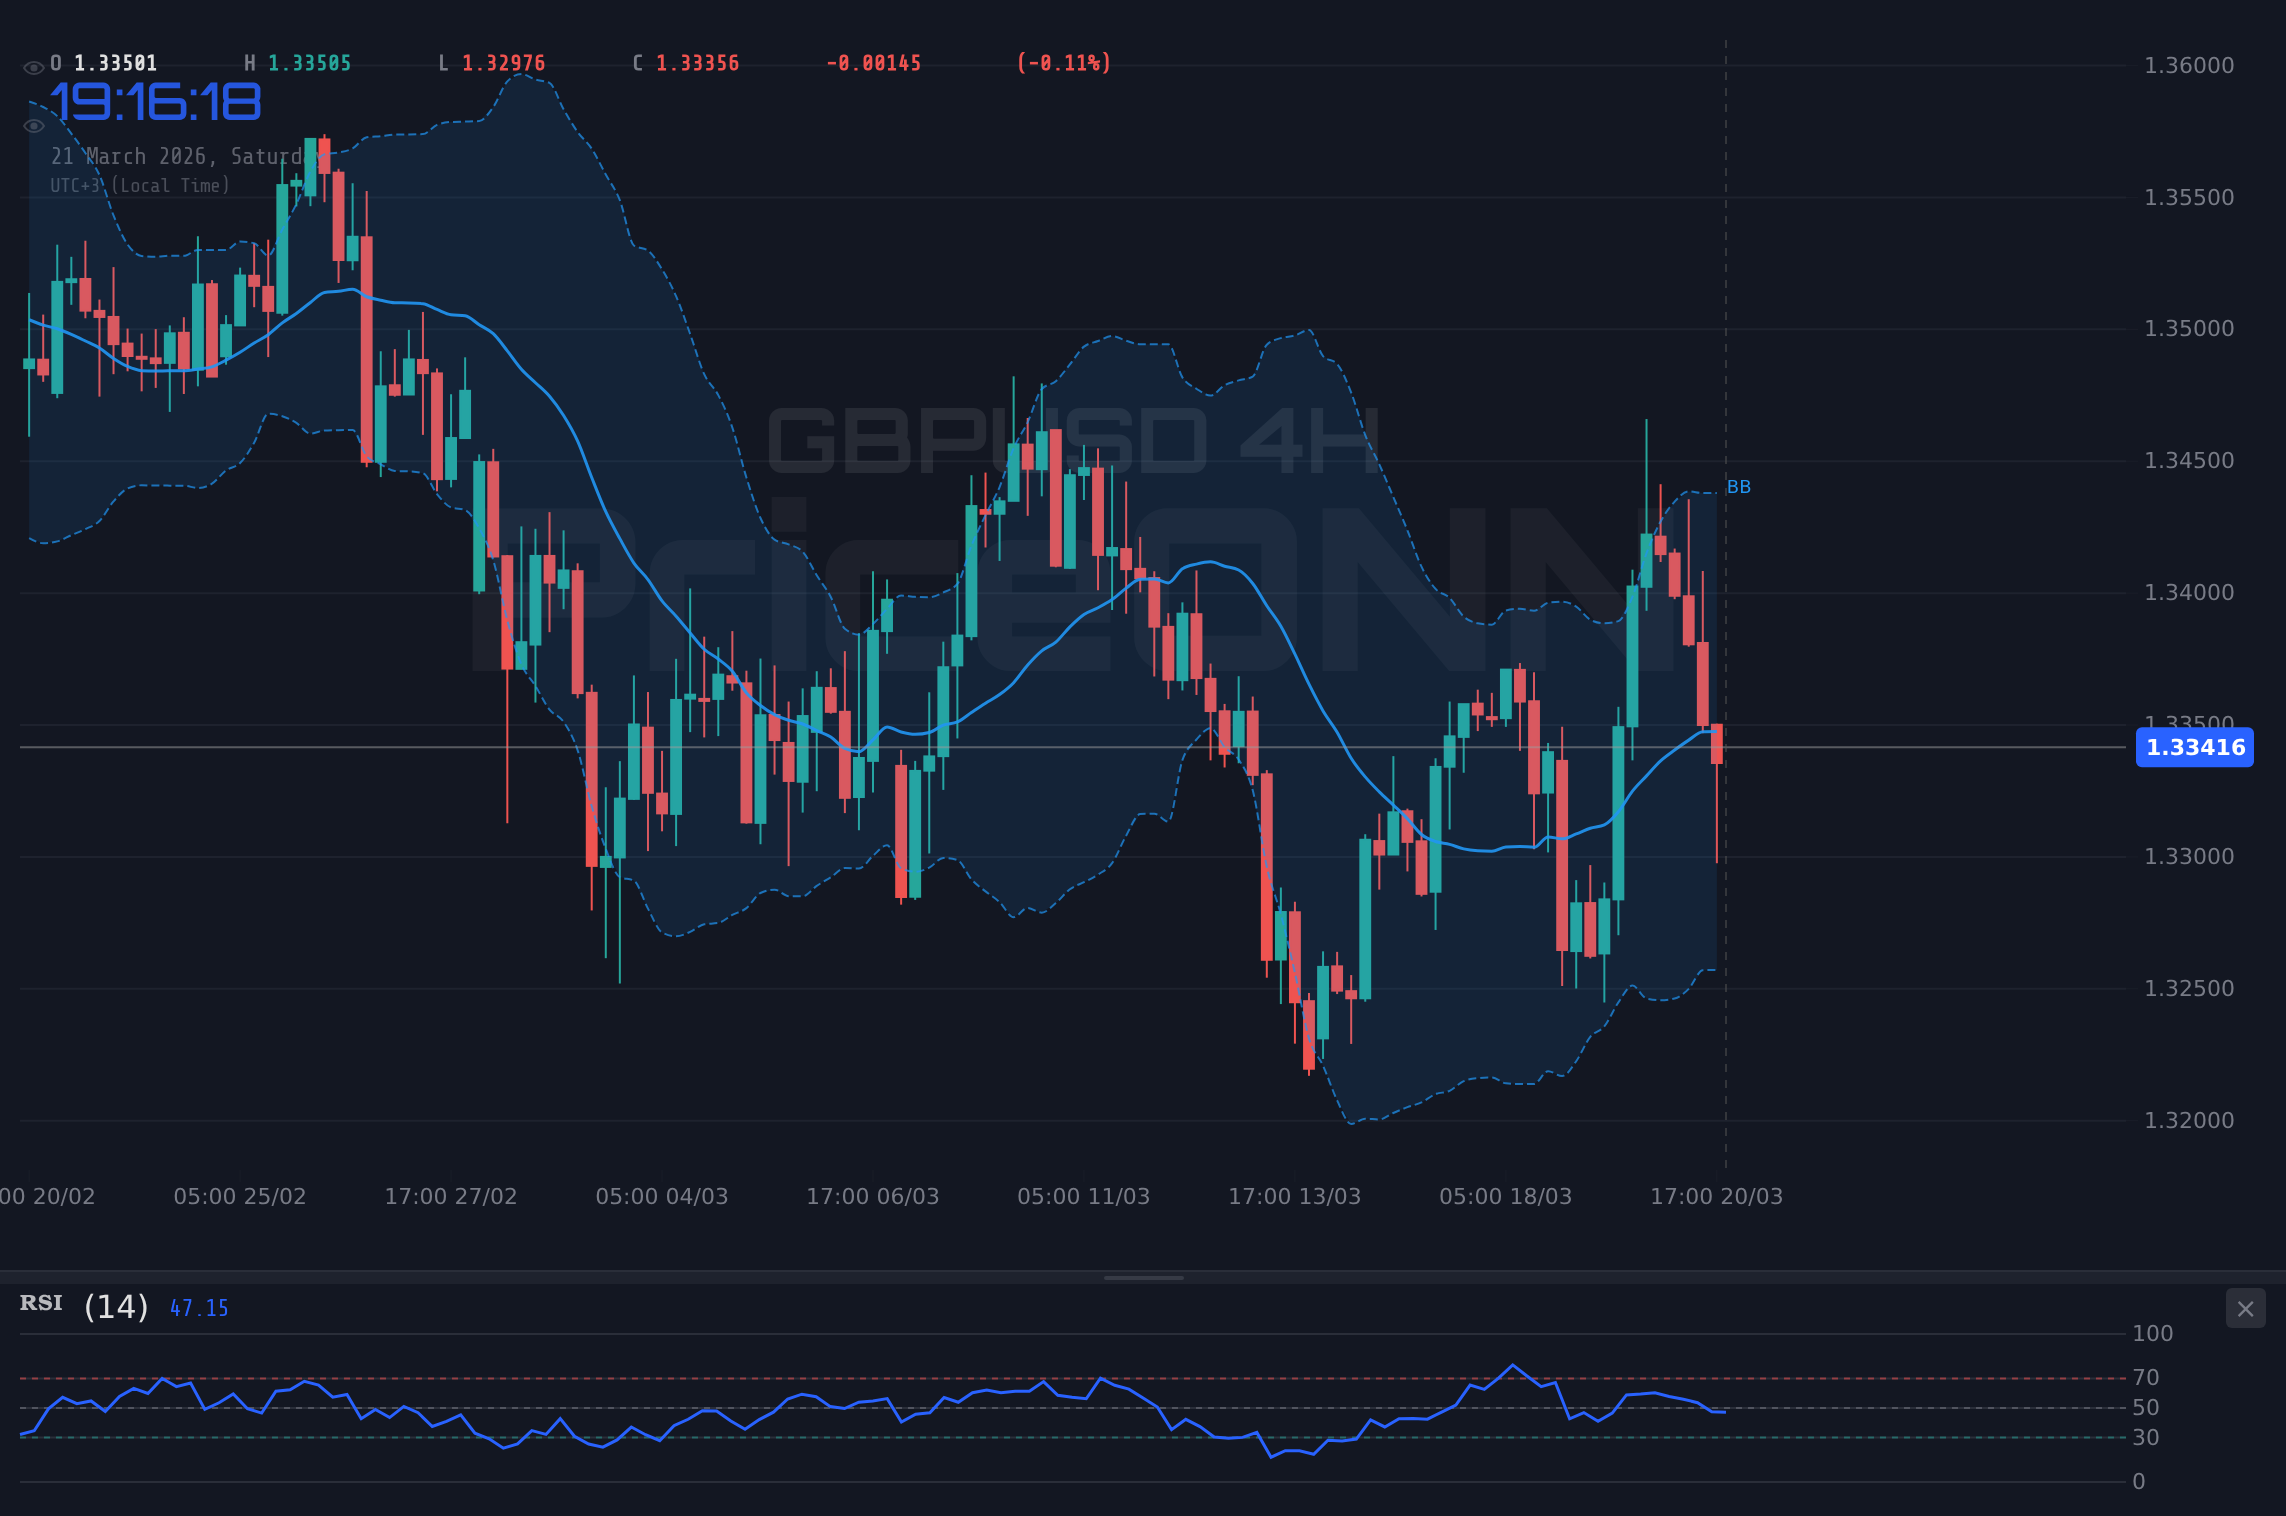
Examining the daily chart for GBP/USD reveals a dominant downtrend, despite some technical indicators flashing mixed signals. The current price of approximately $1.33435 is below the middle Bollinger Band, indicating bearish pressure. The ADX at 29.92 suggests a strong downtrend is in play, reinforcing the bearish narrative. However, the RSI (14) reading of 45.27 hovers in neutral territory, showing a slight downward eğilimi, while the MACD remains below its signal line, confirming negative momentum. Stochastic shows %K at 47.45 and %D at 36.82, suggesting a potential upward move from oversold conditions, but this is counteracted by the overall trend strength. The conflict between these indicators highlights a market that is certainly under bearish pressure, but perhaps awaiting a stronger catalyst or confirmation for a significant downside move. The key takeaway from the daily chart is that while bears are in control, the immediate oversold conditions and conflicting stochastic signals suggest a potential for consolidation or a minor bounce before any further significant decline.The 4-Hour Chart: Trend Strength and Momentum
Zooming into the 4-hour timeframe, the bearish picture for GBP/USD becomes even more pronounced. The pair is trading below the middle Bollinger Band, with an ADX reading of 20.06 indicating a moderate trend. The RSI (14) at 48.39 is firmly in neutral territory, leaning slightly bearish, and the MACD remains below its signal line, signaling continued negative momentum. Stochastic presents a mixed picture: %K at 50 and %D at 70.78 suggests a potential dip from overbought levels, but the overall trend strength on this timeframe is not extreme. The overall signal from the 4-hour chart is predominantly bearish, aligning with the daily view but with slightly less conviction in the trend strength. This suggests that while the direction is down, the pace might be slower or more consolidated in the short term. The key support level at $1.32893 on this chart becomes a crucial point to watch for any potential breakdown. A close below this level would likely accelerate the bearish momentum.The 1-Hour Chart: Intraday Volatility and Immediate Levels
On the intraday 1-hour chart, GBP/USD shows a neutral trend with a slight bearish inclination, trading around $1.33435. The ADX at 27.93 indicates a moderately strong trend, though its direction can be volatile. The RSI (14) at 42.55 is in neutral territory, leaning bearish, and the MACD is below its signal line, confirming negative momentum. Stochastic, however, shows %K at 29.29 and %D at 15.14, suggesting a potential upward bounce from oversold conditions. This divergence between the RSI/MACD and Stochastic on the 1-hour chart highlights the potential for short-term fluctuations. While the broader trend remains bearish, intraday traders might see opportunities for short-term gains if oversold conditions are exploited. However, these moves are likely to be contained by the stronger bearish signals from higher timeframes. The immediate resistance at $1.33721 and support at $1.32863 are critical intraday levels to monitor.Key Technical Indicators: RSI, MACD, and ADX
The ensemble of technical indicators paints a consistent picture of bearish dominance, albeit with nuances across different timeframes. On the daily chart, the RSI (14) at 45.27, while not deeply oversold, indicates a lack of bullish conviction. The MACD consistently sits below its signal line across all examined timeframes, reinforcing negative momentum. The ADX, a measure of trend strength, is particularly telling: 29.92 on the daily, 20.06 on the 4-hour, and 27.93 on the 1-hour. These readings, particularly the daily ADX, suggest that the current downtrend has significant strength. While Stochastic occasionally flashes oversold signals, especially on the 1-hour chart, these are often short-lived and lack the confirmation from other indicators for a sustained reversal. The confluence of a strong daily downtrend (ADX ~30), negative MACD, and neutral-to-bearish RSI suggests that any upward retracements should be viewed with caution and potentially as opportunities for short-sellers rather than the start of a new bullish trend.The Scenarios: Mapping Potential GBP/USD Paths
Scenario 1: The Bearish Breakdown
This scenario hinges on GBP/USD failing to hold above the critical psychological level of $1.33 and succumbing to the prevailing bearish pressures. The trigger for this scenario would be a decisive close below the 4-hour support level of $1.32893. Factors that could precipitate this breakdown include stronger-than-expected US economic data, continued hawkish rhetoric from the Federal Reserve, or unexpected negative news concerning the UK economy or Brexit. The invalidation of this bearish thesis would occur if price decisively breaks and holds above the 1-hour resistance of $1.33721, signaling a shift in intraday momentum. If the bearish breakdown scenario plays out, the first target would be the next significant support level at $1.31565 (S2), followed by a more aggressive target at $1.30681 (S3). This path aligns with the strong bearish signals from the DXY and commodity markets, suggesting a flight to safety that would weigh heavily on Sterling. The probability assigned to this scenario is high, given the current confluence of technical and fundamental factors.Scenario 2: The Bullish Rebound
While the current technical setup leans bearish, a bullish rebound cannot be entirely discounted. This scenario would be triggered by a strong upward move, breaking decisively above the immediate intraday resistance at $1.33721, followed by a sustained hold above the 4-hour resistance of $1.34299. For this bullish case to gain traction, we would need to see a significant shift in market sentiment, perhaps a weaker-than-expected US economic report or surprising positive news from the UK, such as inflation data significantly undershooting expectations or a hawkish pivot from the Bank of England that markets haven't priced in. The invalidation of this bullish move would be a close back below the $1.33 psychological level, and more critically, below the 4-hour support at $1.32893. If this bullish scenario materializes, the initial target would be the 1-day resistance level at $1.35105 (R1), with a secondary target at $1.37317 (R3). This outcome is considered less probable given the current market environment and technical indicators.Scenario 3: The Consolidation Range
In the absence of strong directional catalysts, GBP/USD could enter a period of consolidation, trading within a defined range. This scenario is most likely if key economic data releases from both the US and the UK prove to be mixed or largely in line with expectations, failing to provide a clear directional bias. The trigger for this scenario would be price action remaining largely between the intraday support at $1.32863 and resistance at $1.33721. The invalidation would be a clear break outside of this defined range, either upwards past $1.3430 or downwards below $1.3267. In this range-bound environment, volatility might be subdued, and traders would focus on short-term swings within the established boundaries. Targets would be the immediate support and resistance levels mentioned. This scenario reflects a market awaiting clearer direction from upcoming central bank policy shifts or major economic data points. The probability reflects the current uncertainty and the lack of a definitive catalyst for a strong directional move.Bearish Breakdown: Sterling Under Pressure
65% ProbabilityBullish Rebound: A Sterling Recovery?
15% ProbabilityConsolidation Range: The Waiting Game
20% ProbabilityMarket Movers: What to Watch Next Week
Key Economic Events on the Horizon
The upcoming week promises to be pivotal for GBP/USD, with several key economic data releases and central bank communications that could sway market sentiment. Investors will be closely monitoring the UK labor market data, including employment change, unemployment rate, and average earnings. Stronger-than-expected figures could provide some support for Sterling, while weaker numbers would likely exacerbate the bearish trend. Similarly, US inflation data, particularly CPI and PPI, will be crucial. Any signs of persistent inflation could embolden the Federal Reserve to maintain a hawkish stance, further strengthening the dollar and pressuring GBP/USD. Conversely, a significant easing in US inflation could prompt a reassessment of Fed rate hike expectations, potentially offering some respite to the Pound.Central Bank Watch: Fed vs. BoE Stances
The divergence in central bank policy remains a critical driver for GBP/USD. The Federal Reserve's commitment to combating inflation, even at the risk of slowing economic growth, has been a cornerstone of dollar strength. Market participants will be scrutinizing Fed statements and speeches for any hints about the future path of interest rates. Any indication that the Fed is leaning towards a more prolonged period of higher rates will likely underpin the dollar. On the other side, the Bank of England faces a complex balancing act. While inflation remains a concern, the UK economy shows signs of vulnerability. The market will be watching for any signals of a policy pivot or a change in the forward guidance from the BoE. A surprisingly hawkish stance from the BoE could offer temporary support to Sterling, but its sustainability will depend on the broader economic context and the Fed's actions. The interplay between these two central banks will be a dominant theme.The Role of Geopolitics and Risk Appetite
Geopolitical developments will continue to be a significant wildcard. Any escalation or de-escalation in global hotspots, particularly in the Middle East, could trigger sharp swings in risk sentiment. A flare-up in tensions would likely boost demand for the US Dollar as a safe-haven asset, while a resolution or easing of conflict could encourage a shift back towards riskier assets and currencies. Traders should monitor news flow closely for any developments that could impact oil prices, supply chains, or broader global stability. The market's reaction to such events will be a key indicator of risk appetite and will directly influence the trading environment for GBP/USD. A sustained period of geopolitical calm, combined with positive economic data, would be necessary for Sterling to mount a significant recovery against the dollar.What I'm Watching This Week
My focus this week will be on three key triggers for GBP/USD. Firstly, the reaction to the UK employment data. A significant miss to the downside could accelerate the bearish breakdown towards our S2 target at $1.31565. Secondly, I'll be watching the US CPI release. If inflation proves stickier than expected, reinforcing Fed hawkishness, expect the DXY to push higher, potentially testing key resistance levels and weighing on GBP/USD. Finally, I'll be observing price action around the $1.32893 support level. A clean break below this level, especially on increased volume, would confirm the bearish scenario and open the door for further downside. Conversely, a sustained hold and bounce from this level, coupled with positive UK-specific news, could signal a short-term bullish reversal, but this appears less likely in the current environment.Technical Outlook Summary
| Indicator | Value | Signal | Interpretation |
|---|---|---|---|
| RSI (14) | 45.27 | Neutral | Lack of bullish conviction, leaning bearish. |
| MACD Histogram | -0.003 | Bearish | Negative momentum confirmed below signal line. |
| Stochastic | K: 47.45, D: 36.82 | Bullish hint | Potential bounce from oversold, but lacks trend confirmation. |
| ADX | 29.92 | Strong Trend | Indicates a strong downtrend is in force on the daily chart. |
| Bollinger | Middle Band | Below Band | Price below middle band suggests bearish pressure. |
Key Levels
Support Levels
Resistance Levels
Frequently Asked Questions: GBP/USD Analysis
What happens if GBP/USD breaks decisively below $1.32893 this week?
A close below $1.32893, the 4-hour support, would likely trigger the bearish scenario, targeting $1.31565 (S2) and potentially $1.30681 (S3) as the downtrend accelerates amid dollar strength.
Should I consider buying GBP/USD at current levels around $1.33435 given the oversold Stochastic signal?
While Stochastic shows potential for an intraday bounce, the overall bearish trend (ADX ~30) and negative MACD on higher timeframes suggest caution. A buy at current levels is high-risk; wait for confirmation above $1.33721 or a clear bounce off major support like $1.32893.
Is the RSI at 45.27 a sell signal for GBP/USD right now?
An RSI of 45.27 is not a direct sell signal but indicates a lack of bullish momentum and leans towards bearish pressure on the daily chart. It suggests that any upward movement might face resistance, reinforcing the prevailing downtrend.
How will upcoming US inflation data affect GBP/USD this week?
If US inflation data comes in hotter than expected, it could reinforce Fed hawkishness, strengthening the dollar and pushing GBP/USD lower, potentially triggering the bearish scenario targeting $1.31565. Weaker data might offer temporary relief.
Track markets in real-time
AI-powered analysis, technical indicators and real-time price data.
Join Our Telegram Channel
Breaking market news, AI analysis and trading signals instantly.
Join Channel