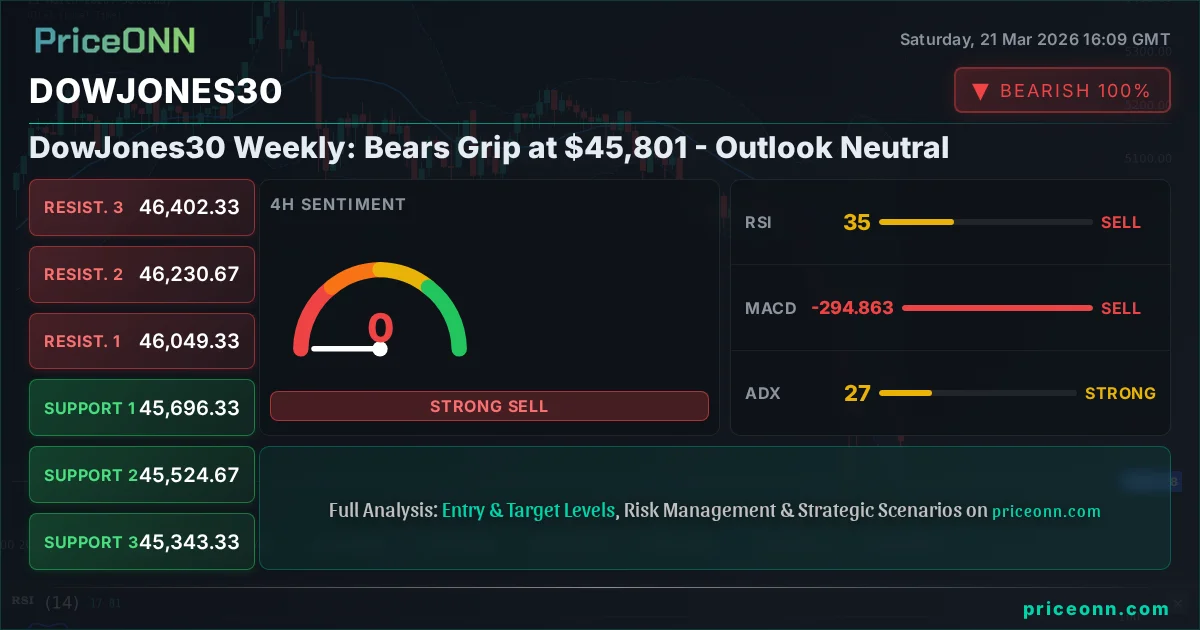
DowJones30 Weekly: Bears Grip at $45,801 - Outlook Neutral
The DowJones30 closed last week at $45,801, with bears tightening their grip. Key levels at $45,771 and $46,351 are critical for the week ahead.
The Dow Jones Industrial Average (DJIA) concluded last Friday at $45,801.00, a level that now represents a critical juncture. The past week was marked by persistent selling pressure, with the index experiencing a notable decline of -0.62%, shedding 284 points. This downward movement, occurring within a daily range of 45,367 to 46,238, underscores a cautious market sentiment. As we enter a new trading week, the question on many traders' minds is whether the bears have established firm control or if this is merely a pause before a potential recovery. The technical indicators, coupled with broader market correlations and geopolitical undercurrents, paint a complex picture that demands a detailed, data-driven approach to navigate the upcoming sessions. This analysis delves into the nuances of the Dow Jones's current position, examining the interplay of technical signals, economic drivers, and market sentiment to provide a comprehensive outlook.
- The DowJones30 closed last Friday at $45,801.00, showing significant selling pressure.
- Critical support is observed at $45,771.67, while resistance looms at $46,351.67 on the daily chart.
- The ADX at 27.11 on the 4H chart indicates a strong downtrend, conflicting with a neutral daily trend.
- Broader market sentiment is risk-off, with DXY rising and major indices like SP500 and Nasdaq showing weakness.
- Geopolitical tensions and inflation concerns continue to weigh on market sentiment, impacting the Dow Jones's outlook.
The past week's trading action for the Dow Jones Industrial Average was characterized by a prevailing bearish sentiment, culminating in a closing price of $45,801.00. This represents a decline of 284 points, or -0.62%, from the previous week's close. The daily trading range, stretching from 45,367 to 46,238, illustrates the volatility and uncertainty that characterized the market environment. While the overall trend on the daily timeframe appears neutral with a 50% power reading, the short-term technicals, particularly on the 4-hour chart, are flashing stronger bearish signals. The ADX at 27.11 on the 4H timeframe suggests a strong downtrend is in play, a stark contrast to the neutral daily outlook. This divergence in trend strength across different timeframes highlights the indecisive nature of the current market, where short-term momentum may be overriding longer-term stability, or vice versa. Understanding this technical conflict is paramount for formulating any trading strategy moving forward.
The Dollar Index (DXY), a key barometer for global risk appetite and currency strength, has been on an upward trajectory, closing the week at 99.39, an increase of 0.48%. This strengthening dollar typically exerts downward pressure on commodities and emerging market assets, and often correlates with weakness in major equity indices like the Dow Jones. The DXY's advance to 99.39, with a daily range between 98.92 and 99.47, suggests that investors are favoring safe-haven assets, a sentiment that can spill over into broader equity markets, including the DJIA. The 1H timeframe for DXY shows a neutral-to-bullish bias, with RSI at 56.78 and positive momentum on the MACD. The daily chart reinforces this bullish trend, indicating that the greenback might continue to be a preferred asset, potentially capping any upside ambitions for the Dow Jones in the near term. This correlation is crucial; as the dollar strengthens, it can make US exports more expensive, potentially impacting multinational corporations within the Dow Jones.
In parallel, the broader US equity landscape, represented by the SP500 and Nasdaq100, has also shown significant weakness. The SP500 closed at 6536.05, down 1.21%, while the Nasdaq100 fell even harder, closing at 23992.13, a drop of 1.65%. This synchronized decline across major US indices reinforces the narrative of a risk-off environment. The SP500's daily chart exhibits a strong downtrend (100% power), with RSI at 32.5 and MACD showing negative momentum. Similarly, the Nasdaq100's daily chart is firmly in a downtrend (98% power), with RSI at 37.26. This widespread equity weakness suggests that macroeconomic concerns or geopolitical risks are driving investors away from riskier assets. For the Dow Jones, this environment implies that even if specific components are performing well, the broader market sentiment is a significant headwind, making a sustained rally challenging without a clear shift in risk appetite.
Navigating the Technical Terrain: Indicators and Price Action
Delving deeper into the Dow Jones's technical posture, the 4-hour chart presents a compelling bearish case. The ADX indicator stands at a robust 27.11, signaling a strong downtrend that is currently in force on this timeframe. This is further corroborated by the RSI(14) reading of 35.25, which, while not deeply oversold, indicates a clear downward momentum. The MACD is also trading below its signal line, confirming negative momentum. The Stochastic Oscillator, with %K at 24.03 and %D at 27.81, is showing a bearish crossover and is heading towards oversold territory, reinforcing the short-term bearish sentiment. These indicators collectively suggest that the bears have a tactical advantage on the 4-hour chart, implying that any attempts to rally could face immediate selling pressure.
However, the daily timeframe offers a more nuanced perspective, presenting a neutral trend with 50% power. The RSI(14) on the daily chart is at 27.02, placing it firmly in oversold territory. This is a significant reading, as historically, such low RSI levels have often preceded price bounces or consolidations. The MACD histogram is negative, but the Stochastic Oscillator, with %K at 10.33 and %D at 16.33, is deeply oversold and showing signs of potentially bottoming out. While the ADX at 41.79 on the daily chart indicates a strong trend, its directionality is less clear when viewed alongside the neutral trend power. This contrast between the strong downtrend signals on the 4H chart and the oversold conditions on the daily chart creates a critical tension. It suggests that while short-term momentum is bearish, the larger trend might be nearing a potential turning point, or at least a period of consolidation, if key support levels hold.
The Bollinger Bands offer further insight. On the 1-hour chart, the price is trading below the middle band, indicating bearish pressure. On the 4-hour chart, the price is also below the middle band, suggesting a downward bias. However, on the daily chart, the price is below the middle band but showing signs of proximity to the lower band, which on the daily chart is at $45,191.67. The fact that the daily RSI is so deeply oversold (27.02) and the Stochastic is near its lowest levels (K=10.33, D=16.33) suggests that a bounce from these daily oversold conditions is a plausible scenario, even if the shorter timeframes are still leaning bearish. The key will be whether the price can reclaim the middle band on the daily chart, which sits around $45,771.67, acting as a confluence of support and the middle Bollinger band.
Key Levels and Price Action: The Battleground Ahead
The immediate focus for the Dow Jones Industrial Average will be on the support and resistance levels derived from the provided market data. On the daily chart, the first level of support is identified at $45,771.67. This level is particularly significant as it aligns with the middle Bollinger Band on the daily chart and represents the current price point where the index closed. A decisive break below this level, especially on increasing volume and supported by bearish momentum across multiple timeframes, would confirm the strength of the downtrend indicated by the 4H ADX. Such a move could then target the next support at $45,458.33.
Conversely, resistance levels will dictate the potential for any upside recovery. The first resistance level stands at $46,351.67. This is a crucial barrier; if the index can push above this level and hold, it would signal a potential shift in short-term momentum and could open the door for further gains towards the next resistance at $46,618.33. The daily chart's oversold Stochastic and RSI readings suggest that a bounce is possible, but the strength of the downtrend on shorter timeframes, coupled with the broader risk-off sentiment, makes breaking these resistance levels a challenging task. The market is essentially at a crossroads, with the $45,771.67 level acting as a critical pivot point.
The interplay between these support and resistance levels, especially in conjunction with the conflicting signals from different timeframes, creates a neutral outlook for the immediate week, but with a bearish undertone based on the prevailing risk sentiment. The fact that the daily RSI is at 27.02 suggests that the market is 'priced for bad news,' and any positive catalyst could lead to a sharp snap-back rally. However, the strong downtrend indicated by the 4H ADX at 27.11 cannot be ignored. This suggests that any rallies might be met with profit-taking, especially as the price approaches the resistance levels. The high ADX on the 4H chart also implies that if the downtrend continues, it could be quite sharp, making the break of support levels a significant event.
Intermarket Dynamics and Geopolitical Influences
The current market environment is heavily influenced by a confluence of factors, including geopolitical tensions and shifts in central bank policy expectations. The recent escalation of geopolitical conflicts, as highlighted by news suggesting a potential undermining of the AI stock market boom due to the Iran conflict and supply chain disruptions, contributes to a general risk-off sentiment. This sentiment is further amplified by the strengthening US Dollar Index (DXY), which is trading at 99.39. A stronger dollar typically correlates with lower commodity prices and can put pressure on global equity markets, including the Dow Jones. The DXY's upward move is driven by a combination of safe-haven flows and divergent central bank stances, as noted in recent market commentary. This suggests that the 'flight to safety' trend may persist, acting as a drag on the Dow Jones.
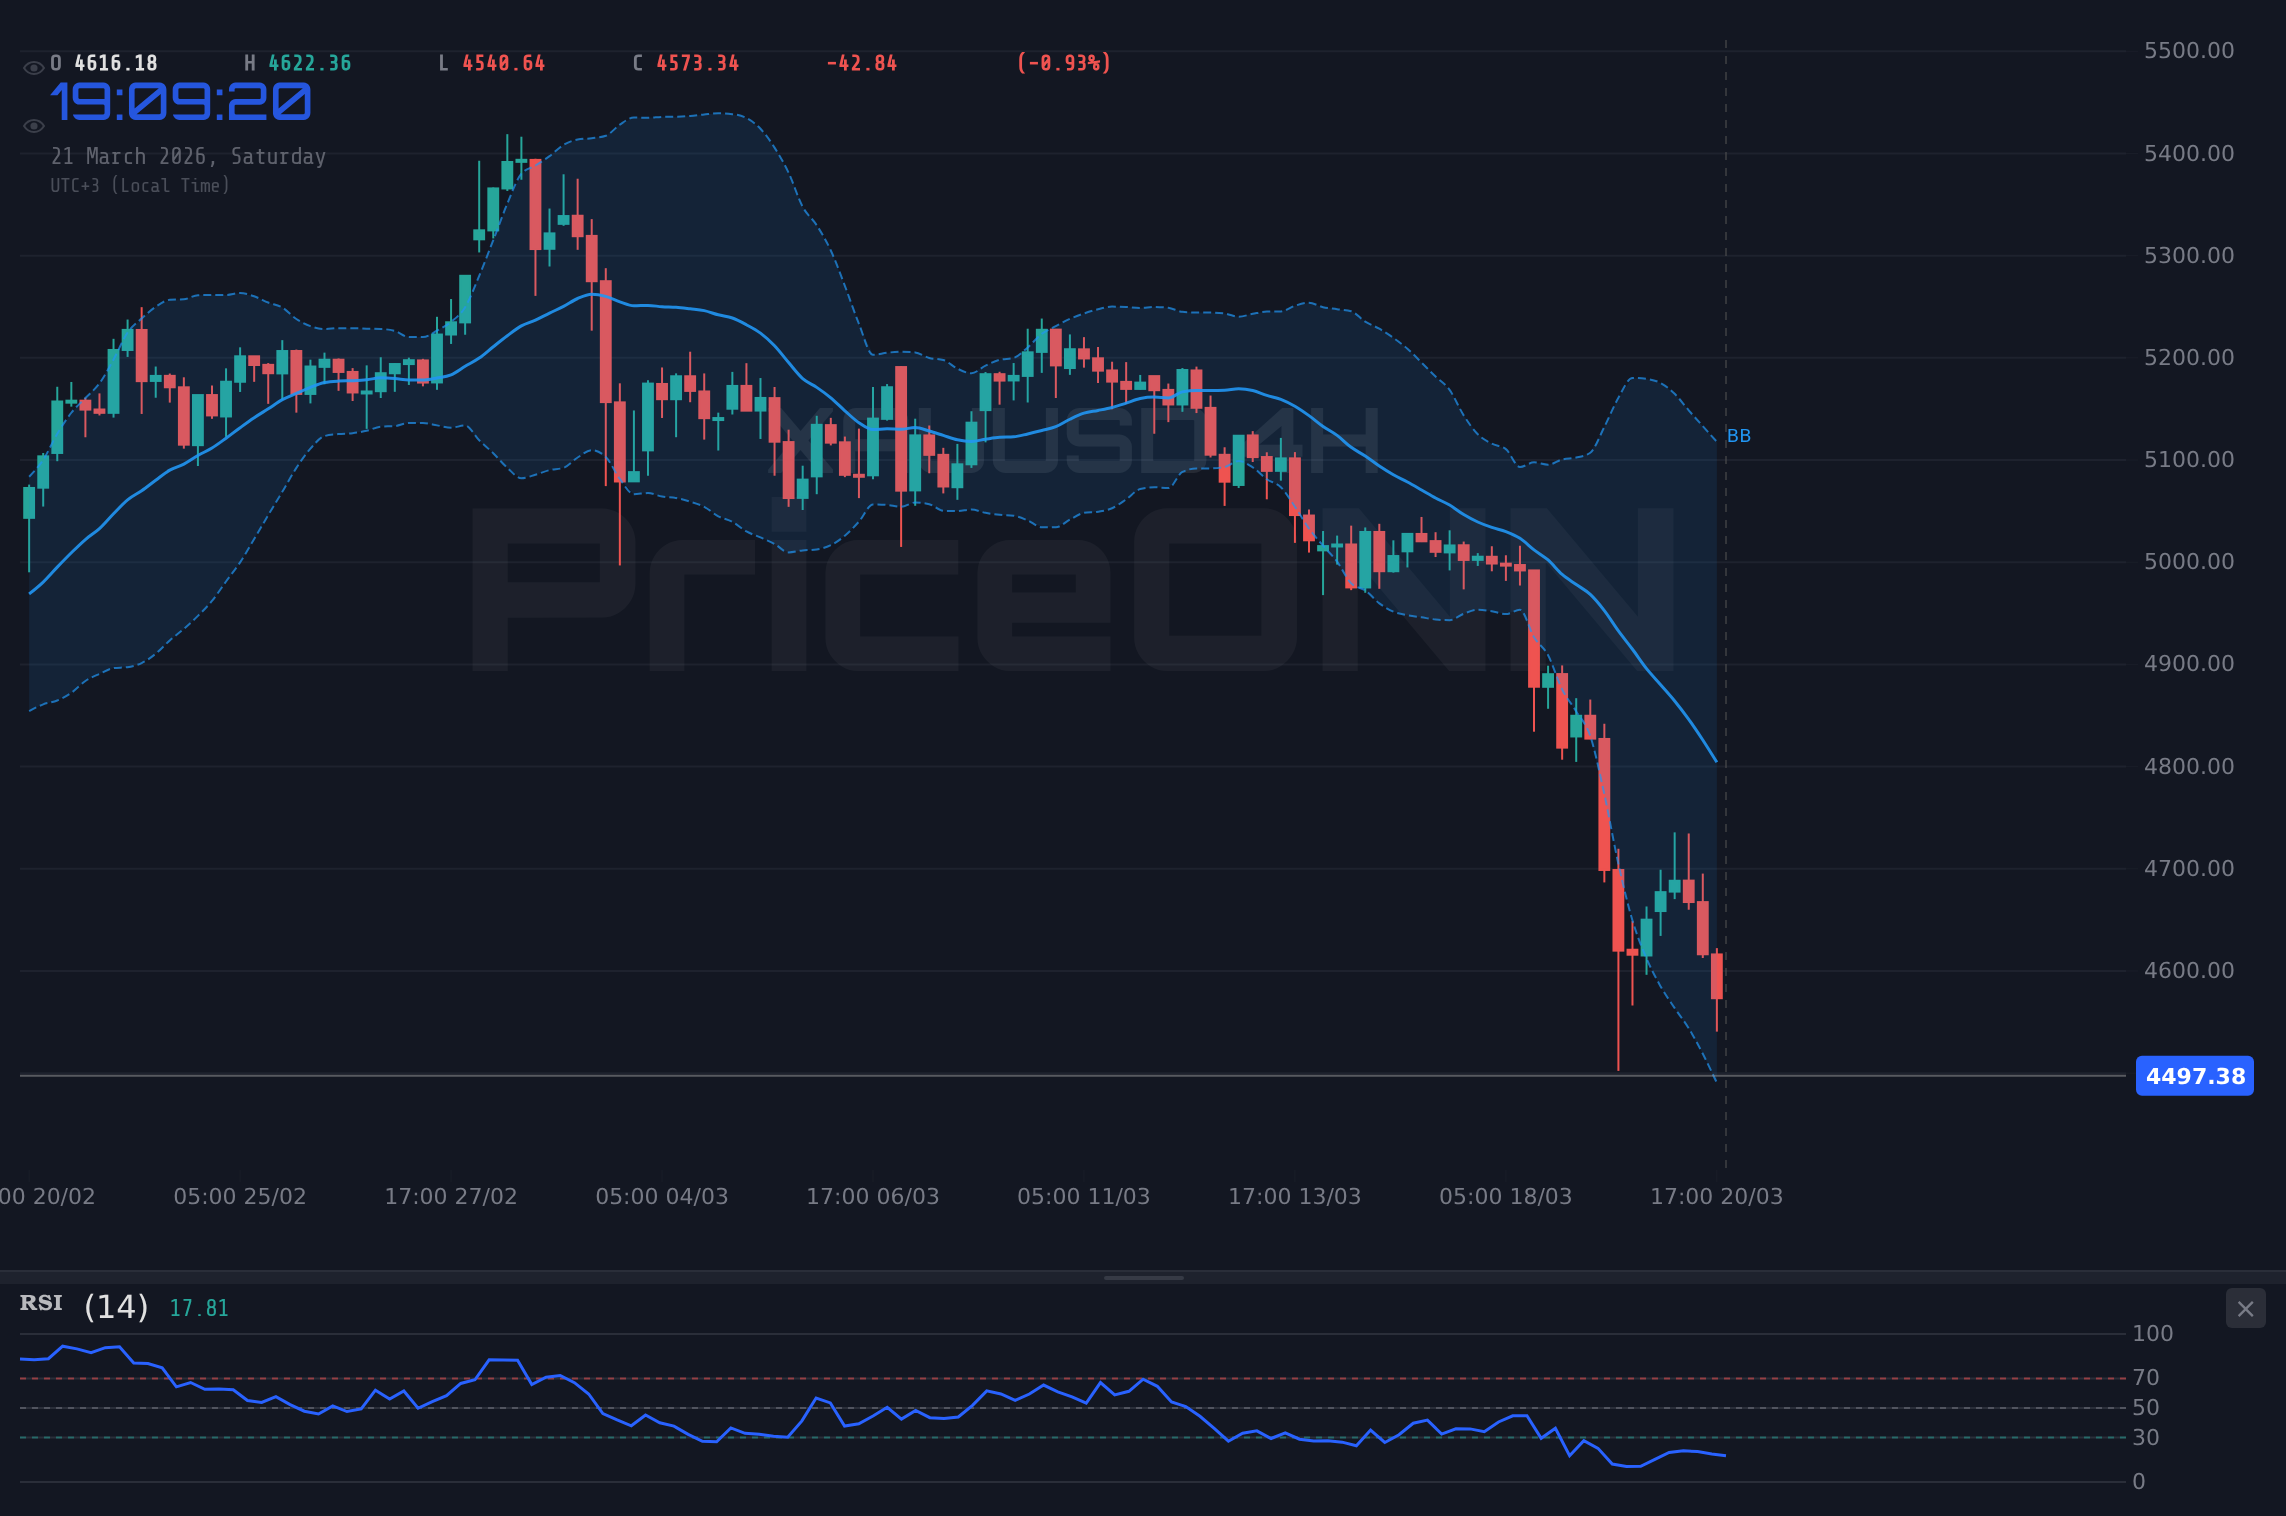
Commodities have also seen significant price action, with gold, silver, and copper all experiencing sharp declines this week, entering bear market territory. This broad commodity sell-off, with XAUUSD down 3.28% at $4497.65 and XAGUSD down 6.67% at $67.00, is indicative of weakening global demand or a flight away from inflation hedges. While lower commodity prices might seem beneficial for some companies within the Dow Jones, the underlying reason for the decline - potentially reduced global growth expectations or a shift in inflation narrative - is a broader concern for the index. The price action in oil, with WTI up 3.87% at $98.50 and Brent up 4.81% at $112.79, adds another layer of complexity. While higher oil prices can boost energy sector profits, they also fuel inflation concerns, which could lead to tighter monetary policy expectations, thereby creating headwinds for equities.
The correlation between major stock indices and currency movements remains a critical aspect of market analysis. The Dow Jones's performance is intrinsically linked to the broader US equity market, as seen with the declines in the SP500 and Nasdaq100. Furthermore, the strengthening DXY suggests a potential headwind for international earnings of Dow Jones components, as a stronger dollar makes their overseas profits worth less when repatriated. The recent news about the Canadian Dollar potentially rebounding despite oil shocks, and the US Dollar's safe haven status potentially fading amid divergent central bank stances, further illustrates the complex currency dynamics at play. Traders must monitor these intermarket relationships closely; a sustained weakness in the broader equity complex, coupled with a strong dollar and volatile commodity prices, creates a challenging environment for any significant upside moves in the Dow Jones.
Trade Scenarios and Outlook
Bearish Scenario: Sustained Downtrend
65% ProbabilityNeutral Scenario: Consolidation and Choppy Action
25% ProbabilityBullish Scenario: Oversold Bounce
10% ProbabilityThe current technical setup for the Dow Jones Industrial Average presents a challenging landscape, but the data provides clear pathways for potential price action. The strong bearish signals on the 4-hour chart, highlighted by the high ADX of 27.11 and negative momentum across indicators like MACD and Stochastic, point towards the possibility of further downside. A break below the critical daily support level of $45,771.67, which also coincides with the daily middle Bollinger Band, would be a significant bearish confirmation. This level is acting as a pivot; holding it could lead to range-bound trading, while a break below it opens up targets at $45,458.33 and potentially $45,191.67. The daily chart's oversold conditions, particularly the RSI at 27.02 and deeply oversold Stochastic, suggest that a bounce is plausible, but the probability of this scenario playing out immediately is lower (10%) given the prevailing risk-off sentiment and shorter-term bearish trend strength.
The neutral scenario, with a 25% probability, anticipates continued choppy action within the established range, bounded by support at $45,771.67 and resistance at $46,351.67. This would likely be characterized by failed attempts to break key levels in either direction, reflecting the market's indecision and the conflicting signals between longer-term oversold conditions and shorter-term bearish momentum. For a more robust bullish scenario to materialize, a decisive break above the $46,351.67 resistance would be required, ideally confirmed by bullish divergence on daily indicators and a shift in broader market sentiment. Such a move could target $46,618.33 and potentially higher levels, but this currently appears to be the least probable outcome given the prevailing macroeconomic and geopolitical headwinds.
Geopolitical tensions and the persistent strength of the US Dollar Index (DXY) at 99.39 are significant factors that cannot be overlooked. These elements contribute to a risk-averse environment, potentially limiting any significant upside for the Dow Jones. The widespread weakness observed in other major indices like the SP500 (down 1.21%) and Nasdaq100 (down 1.65%) further reinforces this narrative. While commodities like oil are showing strength, the broader sell-off in gold, silver, and copper suggests underlying concerns about global growth. Therefore, the most probable outcome for the upcoming week appears to be a continuation of the bearish pressure or consolidation, with the key support at $45,771.67 being the immediate focus. Traders should exercise caution and focus on risk management, waiting for clear signals before committing to significant positions.
Frequently Asked Questions: DowJones30 Analysis
What happens if the DowJones30 breaks below the $45,771.67 support level?
A break below $45,771.67, especially on increasing volume and supported by bearish momentum, would likely trigger further selling. This would invalidate the neutral outlook and open the door for a move towards the next support at $45,458.33, potentially reaching the daily S3 level at $45,191.67.
Should I consider buying the DowJones30 at current levels around $45,801 given the oversold daily RSI?
While the daily RSI at 27.02 suggests oversold conditions, the strong bearish trend on the 4H chart (ADX 27.11) and broader risk-off sentiment make immediate buying risky. A confirmation, such as holding $45,771.67 and seeing a break above $46,351.67, would be necessary for a higher-probability bullish setup.
Is the ADX at 27.11 on the 4H chart a strong sell signal for the DowJones30?
An ADX reading of 27.11 on the 4-hour chart indicates a strong downtrend is in force on that timeframe. Combined with negative MACD momentum and oversold Stochastic, it strongly suggests bearish pressure in the short-to-medium term, making rallies less likely to sustain.
How will the strengthening DXY at 99.39 affect the DowJones30 this week?
The strengthening DXY typically acts as a headwind for US equities like the Dow Jones. A higher dollar can reduce the value of overseas earnings for multinational corporations within the index and reflects a general preference for safe-haven assets, potentially capping upside for the DJIA.
The market is presenting a complex picture for the Dow Jones Industrial Average as we move into the new week. While the daily chart hints at oversold conditions that could support a bounce, the prevalent risk-off sentiment, driven by geopolitical uncertainties and a strengthening dollar, coupled with strong bearish signals on shorter timeframes, suggests that caution is warranted. The critical support at $45,771.67 will be the immediate battleground. Patience and disciplined risk management will be key for traders navigating this environment. As volatility creates opportunities, those who meticulously analyze the data and wait for clear setups will be best positioned to capitalize on the market's next significant move.
Technical Outlook Summary
| Indicator | Value | Signal | Interpretation |
|---|---|---|---|
| RSI (14) | 27.02 | Oversold | Daily chart shows extreme selling, potential for bounce. |
| MACD Histogram | -284.00 | Bearish | Negative momentum on daily chart, confirming downtrend. |
| Stochastic | 10.33 / 16.33 | Oversold | Deeply oversold on daily, potential reversal signal. |
| ADX | 41.79 | Strong Trend | Daily chart shows a strong trend, but directionality uncertain. |
| Bollinger | Middle Band | Below | Price below daily middle band ($45,771.67), bearish bias. |
Track markets in real-time
AI-powered analysis, technical indicators and real-time price data.
Join Our Telegram Channel
Breaking market news, AI analysis and trading signals instantly.
Join Channel