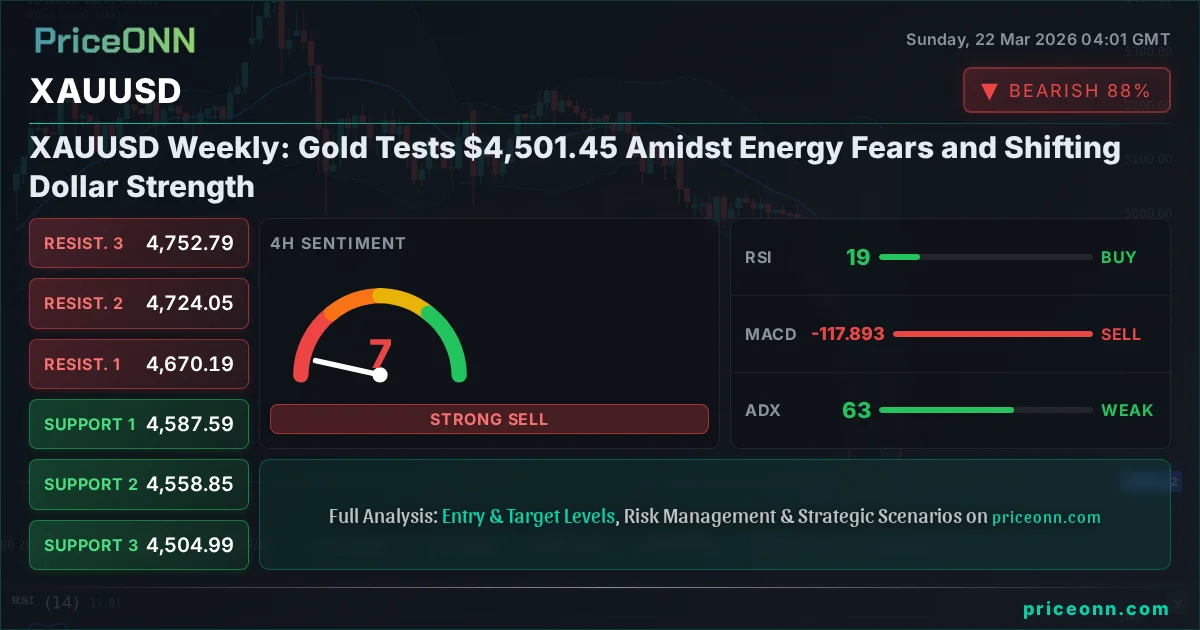
XAUUSD Weekly: Gold Tests $4,501.45 Amidst Energy Fears and Shifting Dollar Strength
Gold prices hover near $4,501.45 as geopolitical energy tensions escalate. Analysis of XAUUSD, DXY, and SP500 reveals key levels and potential market shifts.
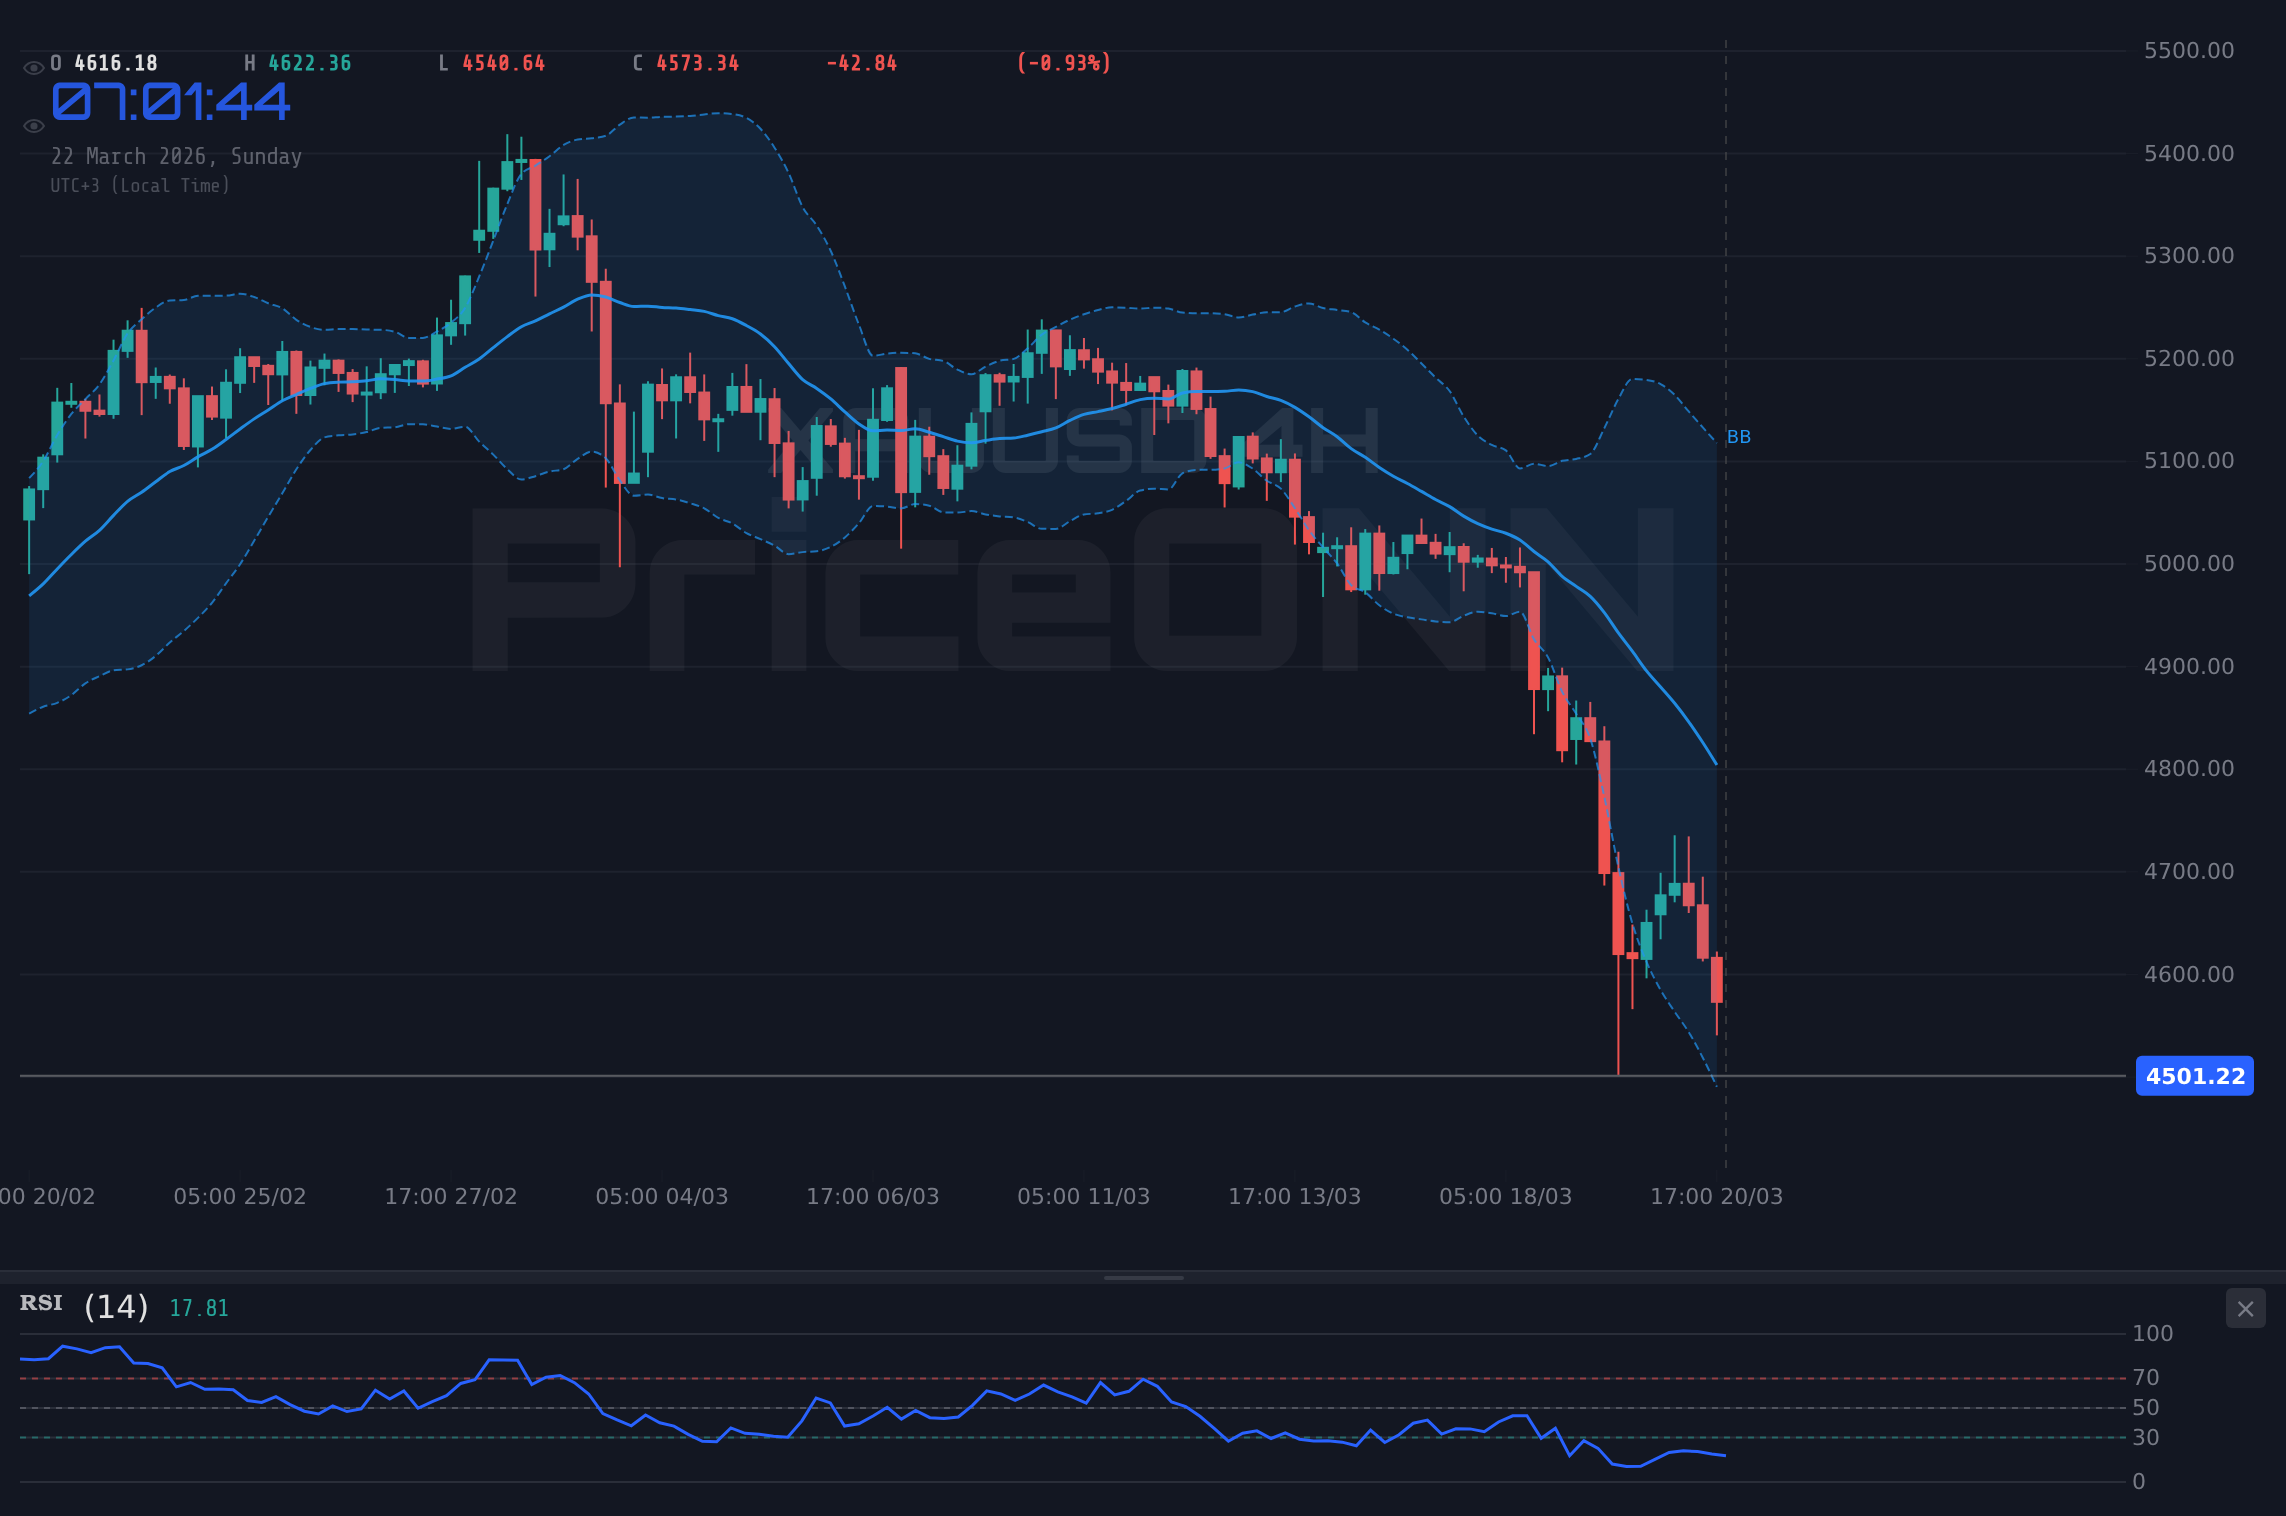
Last Friday, gold prices found themselves hovering precariously around the $4,501.45 mark, a level that has become a focal point for traders navigating a complex web of geopolitical anxieties and shifting macroeconomic currents. The week closed with XAUUSD experiencing a notable downturn, shedding 3.2% or $148.75, painting a picture of a market under pressure despite underlying safe-haven appeal. This price action, occurring within a daily range of $4,477.35 to $4,735.65, sets the stage for a critical assessment of what lies ahead for the precious metal as we step into a new trading week.
- XAUUSD closed the week at $4,501.45, down 3.2% amid broader market sell-offs.
- Critical support for gold is identified at $4,458.67 on the 1-hour chart, while resistance looms at $4,559.54.
- The 1-hour RSI reading of 29.46 signals oversold conditions, suggesting potential for a short-term bounce.
- Escalating energy sector turmoil, particularly concerning geopolitical events in the Middle East, is a key driver influencing gold's safe-haven status and inflation expectations.
The narrative surrounding gold is increasingly intertwined with the volatile energy markets. Recent reports highlight attacks on energy hubs like Ras Laffan, shattering previous assumptions of an impending LNG glut and reigniting concerns about global energy security. This instability, coupled with the insatiable energy demand from the AI boom and a renewed pivot towards nuclear power, creates a fertile ground for inflationary pressures. Historically, gold thrives in such an environment, acting as a hedge against rising prices and geopolitical uncertainty. However, the precious metal's immediate trajectory is also being heavily influenced by the strength of the US Dollar Index (DXY), which saw a modest rise to 99.25, and the broader risk sentiment reflected in the declines of the SP500 (down 1.2% to 6,536.67) and Nasdaq 100 (down 1.67% to 23,986.8).
The Shifting Sands of Safe-Haven Demand
The past week presented a fascinating dichotomy for gold. On one hand, the escalating geopolitical tensions, particularly those impacting energy supply chains, should theoretically bolster demand for safe-haven assets like XAUUSD. News of attacks on Qatar's energy infrastructure and the subsequent re-evaluation of LNG market narratives underscores the fragility of global energy security. This instability, when combined with the significant energy consumption driven by the AI revolution and a global push back towards nuclear power, paints a picture ripe for sustained inflationary concerns. In such a climate, gold typically shines, offering a perceived sanctuary for capital against the erosion of purchasing power and heightened global risk. The data from the 1-hour chart, showing an RSI(14) at 29.46, firmly in oversold territory, further suggests that a technical bounce could be on the cards, presenting a potential short-term buying opportunity.
Conversely, the strength exhibited by the US Dollar Index (DXY) at 99.25, despite some weakening last week according to market commentary, acts as a significant counterweight. A stronger dollar generally makes dollar-denominated assets, like gold, more expensive for holders of other currencies, thereby dampening demand. Furthermore, the broader risk sentiment, as indicated by the sharp drops in major US indices like the SP500 (down 1.2% to 6,536.67) and the Nasdaq 100 (down 1.67% to 23,986.8), paints a mixed picture. While significant equity market declines can sometimes spur safe-haven flows into gold, the current environment appears to be more complex, with rising yields and policy divergence potentially influencing capital flows away from traditional safe havens.
Technical Crossroads: Gold at the $4,500 Level
From a technical standpoint, XAUUSD is at a crucial juncture. The 1-hour chart displays a strong downtrend with an ADX of 31.58, indicating significant bearish momentum. Key support levels are identified at $4,458.67 and $4,417.57, with a more significant floor at $4,357.8. Resistance, however, is also clearly defined, with the immediate hurdle at $4,559.54, followed by $4,619.31 and $4,660.41. The RSI(14) at 29.46 is a classic oversold signal, often preceding a rebound, while the Stochastic oscillator, with K at 13.94 and D at 13.99, is also deep in oversold territory. The MACD remains negative, suggesting that while selling pressure is high, the momentum for further significant downside might be waning in the short term.
Zooming out to the 4-hour timeframe, the downtrend is even more pronounced, with a 100% trend strength and an ADX reading of 62.89, signaling a very strong bearish trend. Here, support is found at $4,587.59, $4,558.85, and $4,504.99, with resistance higher up at $4,670.19, $4,724.05, and $4,752.79. The RSI(14) at 19.3 is even more deeply oversold than on the 1-hour chart, reinforcing the idea that a technical correction is statistically likely, though not guaranteed. The Stochastic oscillator shows K at 25.57 and D at 34.97, still indicating a bearish lean but approaching oversold levels. The divergence between the strong bearish trend on this timeframe and the deeply oversold indicators presents a classic dilemma for traders: does the trend continue, or does the oversold condition trigger a significant retracement?
The daily chart, however, introduces a layer of complexity, showing a neutral trend with only 50% strength and a relatively low ADX of 19.51. This suggests that while the shorter timeframes are dominated by selling pressure, the longer-term picture might be consolidating or awaiting a clearer directional signal. The daily support levels are set further down at $4,479.29, $4,308.39, and $4,114.55, while resistance is considerably higher, beginning at $4,844.03. The daily RSI(14) at 29.67 remains in oversold territory, and the Stochastic (K=8.67, D=13.12) is also deeply oversold. This divergence between the strong bearish signals on intraday charts and the neutral, albeit oversold, picture on the daily chart highlights the current indecision in the market. The question becomes whether the short-term selling pressure will overwhelm the longer-term consolidation, or if the oversold daily conditions will eventually assert themselves.
Intermarket Dynamics: Gold, Dollar, and Energy Nexus
The interplay between gold, the US Dollar Index (DXY), and energy prices is a critical theme to dissect. With the DXY at 99.25, its recent upward movement, albeit with some weekly weakness noted in market commentary, exerts downward pressure on gold. A stronger dollar typically translates to higher costs for non-dollar buyers, potentially suppressing demand. This correlation is particularly important given the commentary suggesting the dollar's safe-haven status might be tested amidst growing policy divergence. If the dollar were to falter significantly, it could provide a substantial tailwind for gold, especially if geopolitical risks continue to simmer.
The energy sector remains a significant wildcard. The reported attacks on the Ras Laffan energy hub and the subsequent shift in the LNG market narrative underscore the persistent geopolitical risks that can rapidly impact global energy supplies. This uncertainty, combined with the massive energy demands of AI data centers and the strategic return to nuclear power, fuels expectations of sustained inflationary pressures. In this context, gold's role as an inflation hedge becomes paramount. The WTI crude oil price, for instance, surged by 3.76% to $98.39, and Brent crude rose by 4.58% to $112.54, indicating strong upward momentum in energy markets. This surge in oil prices, if sustained, could force central banks to reconsider their monetary policy stances, potentially benefiting gold.
The equity markets, represented by the SP500 at 6,536.67 and Nasdaq 100 at 23,986.8, are currently in a clear downtrend, reflecting a risk-off sentiment. The SP500's 1.2% decline and the Nasdaq's 1.67% drop signal investor caution. Typically, a risk-off environment favors safe-haven assets. However, the simultaneous strength in the dollar complicates this relationship. Gold's ability to act as a true safe haven in the coming week will likely depend on whether the geopolitical and inflationary drivers outweigh the strength of the US dollar and the broader risk sentiment in equities. The divergence in signals across different timeframes for XAUUSD itself - strong bearish momentum on hourly and 4-hour charts versus a neutral, oversold daily picture - further adds to the complexity of this intermarket analysis.
Scenario Analysis: Navigating the Path Forward for Gold
Given the confluence of conflicting signals and market forces, a multi-scenario approach is essential for navigating the potential price action of XAUUSD in the coming week. The current technical setup, with deeply oversold indicators on shorter timeframes clashing with a strong bearish trend and a neutral daily outlook, suggests a period of potential consolidation or a sharp reversal. The key will be monitoring the price action around the critical support and resistance levels identified.
Bearish Scenario: The Trend Continues Lower
65% ProbabilityBullish Scenario: Oversold Bounce and Trend Retest
25% ProbabilityNeutral Scenario: Consolidation Around $4,500
10% ProbabilityThe most probable scenario, given the strong bearish trend on the 4-hour chart (ADX 62.89) and the significant price drop last week, leans towards the continuation of the downtrend, albeit with potential for a short-lived technical bounce. The oversold conditions on the 1-hour and 4-hour charts suggest that any upward movement might be met with selling pressure as traders look to exit positions or enter shorts at more favorable levels. The failure of the dollar's safe-haven status to fully materialize amidst rising geopolitical risks is a key factor that could, however, provide some support for gold. If energy prices continue to surge and inflationary fears mount, this could force a reassessment, potentially invalidating the bearish outlook.
What to Watch This Week: Key Triggers for XAUUSD
As we look ahead, several key triggers will dictate the direction of XAUUSD. Firstly, the price action around the $4,458.67 support level on the 1-hour chart is paramount. A decisive break below this level, especially on increasing volume, would strongly favor the bearish scenario. Conversely, a sustained push above the $4,559.54 resistance, accompanied by positive divergence on MACD and rising RSI, could signal the start of a short-term recovery. The ongoing developments in the energy sector, particularly any further geopolitical escalations or significant shifts in LNG supply narratives, will be crucial. News that directly impacts oil prices, such as OPEC+ decisions or further supply disruptions, will undoubtedly ripple through to gold.
Furthermore, the direction of the US Dollar Index (DXY) remains a critical barometer. If the DXY falters from its current 99.25 level, especially if it breaks below key support points on its own charts, this could embolden gold bulls. The market's reaction to upcoming economic data, particularly any indicators that might influence inflation expectations or central bank policy, will also be closely watched. While no specific high-impact events are listed for the immediate upcoming week that directly target gold, the general macro environment - characterized by energy market volatility, inflation concerns, and shifting central bank expectations - creates a backdrop where gold's price action will be highly sensitive to news flow. Traders should remain vigilant for confirmation signals, particularly confluence between technical indicators and fundamental drivers, before committing to significant positions.
Frequently Asked Questions: XAUUSD Analysis
What happens if XAUUSD breaks below the $4,458.67 support level?
A break below $4,458.67 on the 1-hour chart would invalidate the potential for an immediate oversold bounce and likely confirm the continuation of the bearish trend. This scenario targets the next support at $4,417.57, with further downside potential towards $4,357.80 if selling pressure intensifies.
Should I consider buying XAUUSD at current levels near $4,501.45 given the oversold RSI?
While the RSI at 29.46 suggests oversold conditions on the 1-hour chart, the dominant bearish trend (ADX 62.89 on 4H) presents significant risk. A cautious approach would involve waiting for confirmation of a bullish reversal, such as a break above $4,559.54 resistance, before considering a long position.
Is the MACD signal on the daily chart a sell signal for XAUUSD?
The daily MACD is negative and below its signal line, indicating bearish momentum. However, the daily trend strength is neutral (50%) with a low ADX (19.51), suggesting the bearish signal on MACD might be part of a larger consolidation rather than an immediate trend continuation.
How will escalating energy tensions affect XAUUSD price this week?
Continued geopolitical instability in energy markets, as suggested by reports from the Middle East, could increase inflationary fears and bolster gold's safe-haven appeal. If WTI and Brent crude prices remain elevated or move higher, this would likely provide underlying support for XAUUSD, potentially mitigating further downside despite dollar strength.
| Indicator | Value | Signal | Interpretation |
|---|---|---|---|
| RSI (14) | 29.46 | Oversold | Potential bounce imminent, but trend is strong. |
| MACD Histogram | -15.20 | Negative Momentum | Selling pressure persists, but momentum may be waning. |
| Stochastic | K:13.94, D:13.99 | Extreme Oversold | Suggests a potential reversal or sharp bounce. |
| ADX | 31.58 | Strong Trend | Confirms significant downward momentum on 1H. |
| Bollinger Bands | Lower Band Break | Bearish Break | Price trading below the lower band signals extreme selling. |
Track markets in real-time
AI-powered analysis, technical indicators and real-time price data.
Join Our Telegram Channel
Breaking market news, AI analysis and trading signals instantly.
Join Channel