Nasdaq100 Analysis: Bears Rule at $23,986.80 - What's Next?
Nasdaq100 analysis at $23,986.80: Bears are in control, but is a bottom forming? We break down key levels and indicators for the week ahead.
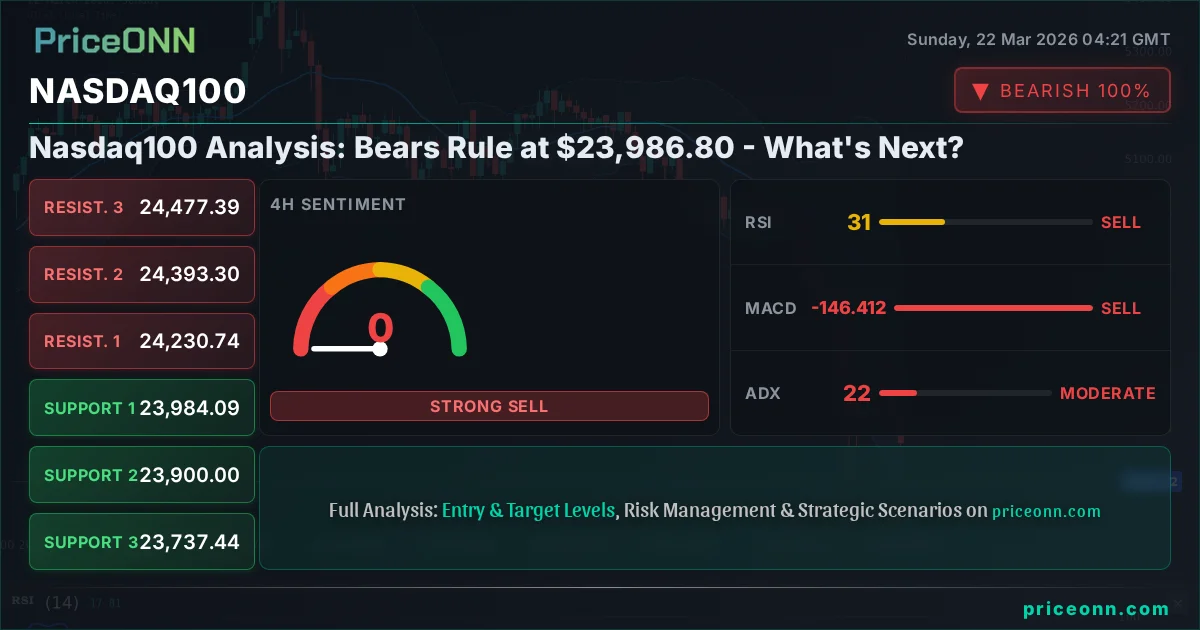
The Nasdaq100, a bellwether for the tech-heavy sector, has experienced a significant downturn, closing last Friday at $23,986.80. This sharp retreat underscores a prevailing bearish sentiment that has gripped market participants. The question on everyone's mind is whether this downward pressure is a temporary pause or the prelude to a deeper correction. This week's analysis delves into the intricate technical signals, macroeconomic undercurrents, and intermarket correlations that are shaping the Nasdaq100's outlook, providing a comprehensive view for traders and investors navigating these turbulent waters. We will examine the critical levels that have been tested and the indicators flashing warning signs, all while considering the broader context of global economic shifts.
- Nasdaq100 is currently trading at $23,986.80, with the 4-hour chart showing a strong bearish trend (ADX 22.4).
- Key support sits at $23,675.46 (1H) and $23,737.44 (4H), tested multiple times this week. A break below these levels could accelerate declines.
- RSI at 31.33 (4H) and 32.52 (1D) signals oversold conditions, suggesting potential for a short-term bounce, but the MACD histogram remains negative across timeframes.
- The strength of the US Dollar Index (DXY) at 99.25 and the risk-off sentiment evident in the S&P 500's drop to $6,536.67 are creating headwinds for the Nasdaq100.
Navigating the Bearish Tide: Nasdaq100's Current Stance
The Nasdaq100's recent price action paints a clear picture of bearish dominance. Last week's close at $23,986.80 reflects a significant decline from its recent highs, driven by a confluence of factors ranging from persistent inflation concerns to shifting monetary policy expectations and escalating geopolitical tensions. The index's downward trajectory is not merely a blip; it represents a sustained trend that technical indicators are now reflecting with increasing clarity. Examining the multiple timeframes reveals a consistent narrative of selling pressure, with short-term, medium-term, and long-term charts all flashing cautionary signals. This pervasive bearishness demands a closer look at the underlying drivers and the potential inflection points that could alter the current market narrative.
The technical indicators are painting a stark picture. On the 1-hour timeframe, the ADX is at 38.15, indicating a strong downward trend. While the RSI is hovering in oversold territory at 37.71, suggesting a potential for a short-term bounce, the MACD histogram remains firmly in negative territory, signaling bearish momentum. This divergence between oversold RSI and negative MACD is a common, albeit tricky, signal that often precedes consolidation or a sharp reversal. The Stochastic Oscillator, with %K at 18.69 and %D at 14.95, also points to oversold conditions, but the strength of the ADX suggests that any bounce might be short-lived without a significant shift in underlying sentiment.
Moving to the 4-hour timeframe, the bearish conviction strengthens. The ADX climbs to 22.4, still indicating a trend, albeit less forcefully than the 1H chart, but the RSI at 32.35 continues to signal oversold conditions. The MACD histogram here also remains negative. The Stochastic Oscillator (%K: 11.38, %D: 26.57) is deeply oversold, reinforcing the idea that the index is technically stretched to the downside. However, the key is to differentiate between oversold conditions that lead to a reversal and those that simply precede a period of consolidation before further declines. The current setup leans towards the latter, especially when considering the broader market context.
The daily chart provides the most concerning perspective for the bulls. An ADX reading of 44.59 signifies a very strong downward trend, leaving little room for doubt about the prevailing market direction. The RSI at 32.52, while technically oversold, is not yet at extreme levels seen in previous capitulations. More importantly, the MACD histogram is deeply negative, and the Stochastic Oscillator (%K: 16.28, %D: 27.82) is also in oversold territory, but the strength of the ADX suggests that the selling pressure could persist. The Bollinger Bands on the daily chart are also showing the price trading below the lower band, a condition that historically can precede sharp bounces, but also indicates extreme bearish sentiment.
Intermarket Correlations: The Dollar's Grip and Equity Rotation
The Nasdaq100 does not operate in a vacuum. Its movements are intrinsically linked to broader market dynamics, particularly the strength of the US Dollar Index (DXY) and the performance of major equity benchmarks like the S&P 500. Last Friday, the DXY closed at 99.25, showing a notable uptick of 0.35%. This strengthening dollar acts as a significant headwind for growth-oriented assets like tech stocks, as it increases the cost of dollar-denominated assets for holders of other currencies and often correlates with tighter global financial conditions.
The correlation between the DXY and the Nasdaq100 is a crucial element in understanding the current market environment. As the dollar index showed resilience, the broader equity market sentiment soured. The S&P 500 closed down 1.2% at $6,536.67, and the Nasdaq100 mirrored this decline, dropping 1.67% to $23,986.80. This broad-based equity weakness suggests a 'risk-off' environment, where investors rotate out of riskier assets like technology stocks and into perceived safe-haven assets. The fact that both the S&P 500 and Nasdaq100 are trading below their respective middle Bollinger Bands, with strong ADX readings indicating bearish trends, reinforces this narrative of declining risk appetite.
Furthermore, the energy complex, represented by Brent crude oil at $112.54 and WTI at $98.39, shows significant upward momentum. This surge in oil prices, fueled by geopolitical events such as the attack on Qatar's Ras Laffan energy hub and broader supply concerns, adds another layer of complexity. Higher energy prices can exacerbate inflation concerns, potentially leading to more hawkish central bank policies, which are generally detrimental to growth stocks. While the energy sector itself might benefit, the inflationary implications cast a shadow over the broader market, including the tech-heavy Nasdaq100. The recent news regarding AI's energy demand contributing to emissions crises and the pivot back to nuclear power highlights the structural shifts occurring in the energy landscape, which will undoubtedly have long-term implications for the tech sector.
The divergence in monetary policy expectations also plays a role. While the Federal Reserve's stance remains a key focus, the market is also closely watching other central banks. However, the immediate impact of the DXY's strength and the risk-off sentiment in equities is a direct drag on the Nasdaq100. The correlation is clear: a stronger dollar and a weaker equity market typically create a challenging environment for tech stocks, which are often more sensitive to global liquidity conditions and investor sentiment.
Key Levels and Chart Patterns: The Battle for $23,675
The Nasdaq100's technical landscape is currently defined by a series of critical support and resistance levels that traders are closely watching. On the 1-hour chart, immediate resistance is identified at $23,972.48, followed by $24,065.02. These levels represent immediate hurdles that the bulls must overcome to even consider a short-term reversal. However, the more significant battleground lies at the support levels. The first key support on the 1H chart is at $23,823.97, followed by $23,768. A break below these levels could trigger further selling pressure, potentially leading to a retest of the more substantial support zone.
The 4-hour chart reinforces the importance of these levels. Resistance is seen at $24,230.74 and $24,393.30. These are the levels that need to be reclaimed to signal a potential shift in momentum. On the downside, the critical support cluster is located between $23,737.44 and $23,675.46. This zone represents a significant confluence of technical factors, including previous price lows and psychological round numbers. A decisive close below $23,675.46 on a 4-hour or daily basis would likely invalidate any immediate hopes for a bottom and could open the door to further downside targets, potentially towards the $23,000 psychological level and beyond.
The daily chart paints an even broader picture, with major support identified at $23,770.36 and $23,670.36. These are the levels that, if breached, could signal a more profound trend change. The resistance on the daily chart is much higher, starting at $24,166.02 and extending to $24,561.68. The significant distance between the current price and these higher resistance levels, coupled with the strong bearish trend indicated by the daily ADX of 44.59, suggests that overcoming the immediate downside pressure will be a formidable task for the bulls.
The formation of lower highs and lower lows on the daily chart is a classic bearish pattern. While the RSI is in oversold territory on multiple timeframes, this alone is not a buy signal. Traders must wait for confirmation, such as a bullish divergence on the MACD or a decisive break back above a key resistance level, accompanied by increasing volume. The current market structure suggests that any rallies are likely to be met with selling pressure as traders look to exit positions or initiate short positions at more favorable levels. The battle around the $23,675 mark is therefore crucial; a failure to hold this level would likely embolden the bears and set the stage for further declines.
Trade Scenarios: Navigating the Uncertainty
Given the current technical picture and market sentiment, several scenarios warrant consideration. The prevailing conditions suggest a bearish bias, but the oversold indicators on shorter timeframes introduce an element of caution and the possibility of short-term bounces.
Bearish Scenario: Continued Downside Pressure
65% ProbabilityNeutral Scenario: Consolidation and Range-Bound Trading
25% ProbabilityBullish Scenario: Short-Term Rebound
10% ProbabilityThe Macroeconomic Backdrop: Inflation, Rates, and Geopolitics
The persistent strength of the US Dollar, closing at 99.25, is a significant factor influencing the Nasdaq100. This strength is partly attributed to the growing divergence in monetary policy expectations globally and the dollar's traditional role as a safe-haven asset amidst geopolitical turmoil. While the Fed's next move remains a subject of intense speculation, the market is pricing in a higher probability of sustained higher rates, especially if inflation proves stubborn. Recent economic data, though mixed, has not provided a clear signal for an imminent pivot from central banks, keeping upward pressure on yields and, consequently, on the dollar.
Geopolitical risks continue to be a potent force in the markets. The recent attack on Qatar's Ras Laffan energy hub, as reported by energy news outlets, has significantly altered the narrative around global LNG supply, potentially leading to higher energy prices. This, in turn, fuels inflation concerns, which could force central banks to maintain a tighter monetary stance for longer. The ongoing conflicts and political uncertainties create an environment of heightened risk aversion, which typically weighs on growth assets like technology stocks. The energy crisis, coupled with the broader implications of AI's energy demand, suggests a challenging macroeconomic landscape ahead, characterized by inflationary pressures and supply chain vulnerabilities.
The performance of other equity indices also provides crucial context. The S&P 500's close at $6,536.67 and the Dow Jones Industrial Average at $45,815.46, both showing significant daily declines, indicate a broad-based risk-off sentiment. This correlated weakness across major US indices suggests that the selling pressure is not isolated to the tech sector but is rather a systemic market reaction to broader economic and geopolitical concerns. The Nasdaq100, being more growth-oriented and sensitive to interest rate expectations, is often the first to feel the brunt of such shifts in sentiment.
Looking ahead, key economic events will be crucial in shaping market direction. Upcoming inflation data and central bank commentary will be closely scrutinized for any hints about future monetary policy. The market's reaction to these events will likely determine whether the current bearish trend in the Nasdaq100 continues or if a sustainable rebound can materialize. The interplay between inflation, interest rates, geopolitical stability, and risk sentiment will remain the dominant theme for the foreseeable future, dictating the path of least resistance for the Nasdaq100 and other risk assets.
The Role of AI and Energy Demand
The burgeoning artificial intelligence boom, while promising transformative advancements, is also presenting significant energy challenges. The insatiable demand for computing power to train and run AI models is dramatically increasing energy consumption, particularly through data centers. This surge in demand is not only straining existing power grids but is also contributing to a rise in carbon emissions, as highlighted in recent energy sector analyses. This creates a complex dynamic where technological progress clashes with environmental and energy sustainability goals.
The market's response to this energy crunch is multifaceted. Nations are pivoting back to nuclear power, seeking a stable, low-carbon energy source to meet this growing demand. Simultaneously, there's a renewed interest in fossil fuels, as evidenced by the record-breaking oil lease sale in Alaska. Big Tech companies are pouring billions into carbon credits, attempting to offset their environmental footprint, but the sheer scale of energy consumption suggests this may be a short-term palliative rather than a long-term solution.
For the Nasdaq100, which is heavily weighted towards technology and AI-driven companies, this energy dynamic presents both risks and opportunities. On one hand, companies at the forefront of AI development and data center infrastructure may see increased demand for their services and products. On the other hand, the rising cost of energy and the potential for regulatory scrutiny over emissions could become significant headwinds. Furthermore, if the energy crisis exacerbates inflation and leads to higher interest rates, it could dampen the valuation multiples of growth stocks, which are already sensitive to such macro factors. The sustainability of the AI boom will, in part, depend on the global ability to meet its colossal energy requirements affordably and sustainably.
Trading Implications and Risk Management
For traders and investors, the current environment calls for a disciplined approach. The prevailing bearish trend on the Nasdaq100, supported by strong ADX readings and negative MACD momentum, suggests that caution is paramount. The oversold RSI and Stochastic readings on shorter timeframes might offer opportunities for short-term counter-trend trades, but these should be approached with tight risk management, as the overall trend remains firmly downwards.
The critical support level at $23,675.46 is the line in the sand. A decisive break below this level would likely signal a continuation of the downtrend, potentially targeting $23,000 and then $22,500. Such a move would invalidate any bullish short-term thesis and confirm the bearish outlook. Conversely, a sustained move above the $24,166.02 resistance level, coupled with positive MACD and RSI divergence, could signal the beginning of a short-term recovery, targeting higher resistance levels.
Risk management is key. Given the high volatility and the potential for sharp moves in either direction, position sizing should be conservative. Stop-loss orders should be placed judiciously, respecting the key support and resistance levels identified. For those looking to capitalize on the bearish trend, shorting on rallies towards resistance levels, with stops placed above those levels, could be a viable strategy. For those seeking long opportunities, waiting for clear signs of trend exhaustion or a confirmed bullish reversal pattern, ideally after a break of immediate resistance, would be prudent.
The correlation with the DXY and the broader equity market cannot be overstated. A rising DXY and falling S&P 500 should be seen as warning signs for the Nasdaq100. Conversely, a weakening dollar and a stabilizing or rising S&P 500 could provide a more supportive backdrop for a potential Nasdaq100 rebound. The energy crisis and its inflationary implications also warrant close monitoring, as they could influence central bank policy and, by extension, market sentiment.
Frequently Asked Questions: Nasdaq100 Analysis
What happens if Nasdaq100 breaks below the $23,675 support level?
A close below $23,675.46 on a 4-hour or daily chart would likely invalidate any near-term bullish hopes and signal a continuation of the downtrend. This could lead to further declines, targeting the $23,000 psychological level and potentially extending towards $22,500 as the next significant support zone.
Is the RSI at 32.52 on the daily chart a buy signal for Nasdaq100 at $23,986.80?
While an RSI of 32.52 indicates oversold conditions, it is not a standalone buy signal, especially with the strong bearish ADX of 44.59. Traders should look for confirmation, such as bullish divergence on the MACD or a break above immediate resistance, before considering a long position.
How is the current DXY strength at 99.25 affecting Nasdaq100's trend analysis?
The strengthening US Dollar Index (DXY) at 99.25 acts as a headwind for growth assets like the Nasdaq100. This correlation suggests that as the dollar strengthens, liquidity tightens for global investors, putting downward pressure on tech stocks, which are often more sensitive to such macro shifts.
How will upcoming inflation data impact Nasdaq100 trading around the $23,986.80 level?
If inflation data comes in hotter than expected, it could reinforce expectations of higher-for-longer interest rates, further pressuring the Nasdaq100 and potentially leading to a test of key support levels. Conversely, cooler-than-expected data might offer some relief, potentially triggering a short-term rebound.
The Path Forward: Navigating Volatility
The Nasdaq100 remains in a precarious position, caught between oversold technical conditions and a persistent bearish macro environment. The coming week will be critical in determining whether the index can find a stable footing or succumbs to further selling pressure. While the technical indicators on shorter timeframes hint at potential for a short-term bounce, the underlying trend and broader market correlations suggest that caution is the most prudent approach. Investors and traders must remain vigilant, closely monitoring key support and resistance levels, particularly the crucial $23,675.46 zone. The interplay of inflation data, central bank rhetoric, and geopolitical developments will continue to dictate market sentiment. Patience and disciplined risk management will be the cornerstones for navigating this challenging period. Remember, the market always presents opportunities, but it rewards those who wait for the right setup and manage their risk effectively.
Track markets in real-time
AI-powered analysis, technical indicators and real-time price data.
Join Our Telegram Channel
Breaking market news, AI analysis and trading signals instantly.
Join Channel