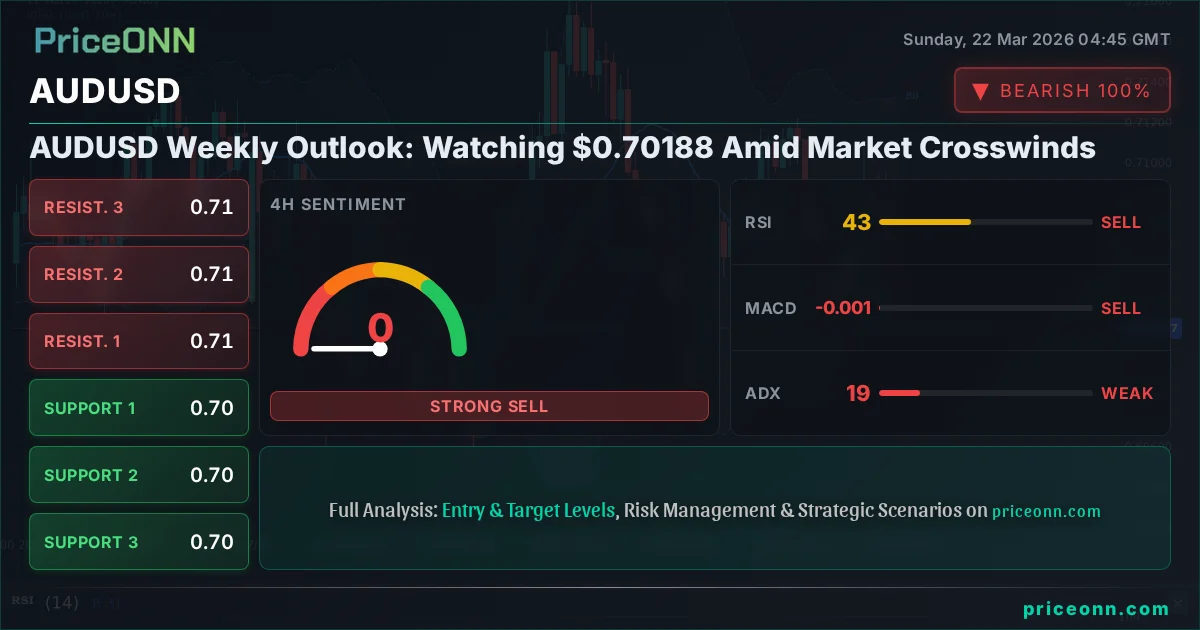
AUDUSD Weekly Outlook: Watching $0.70188 Amid Market Crosswinds
AUDUSD held steady around $0.70188 last week. Key levels watched as DXY strength battles risk sentiment and upcoming data.
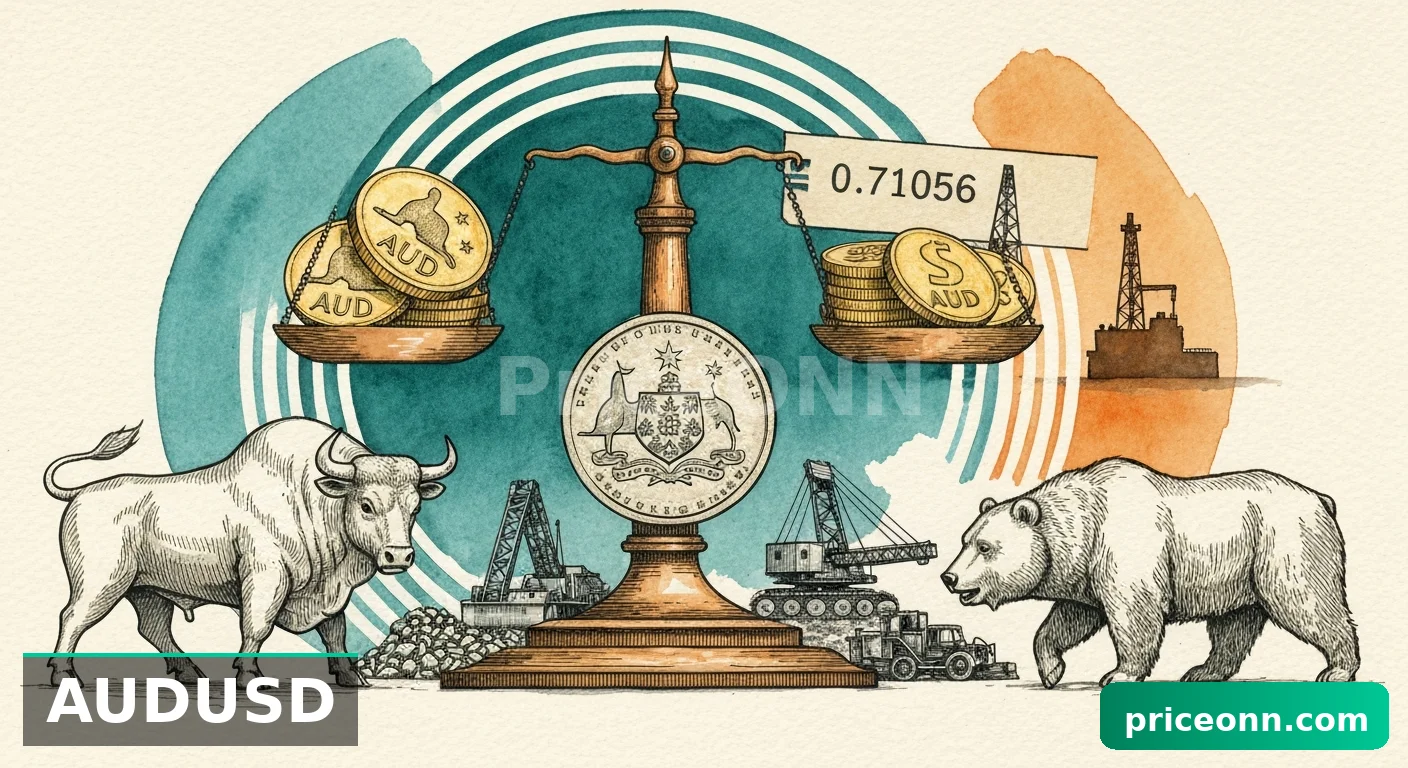
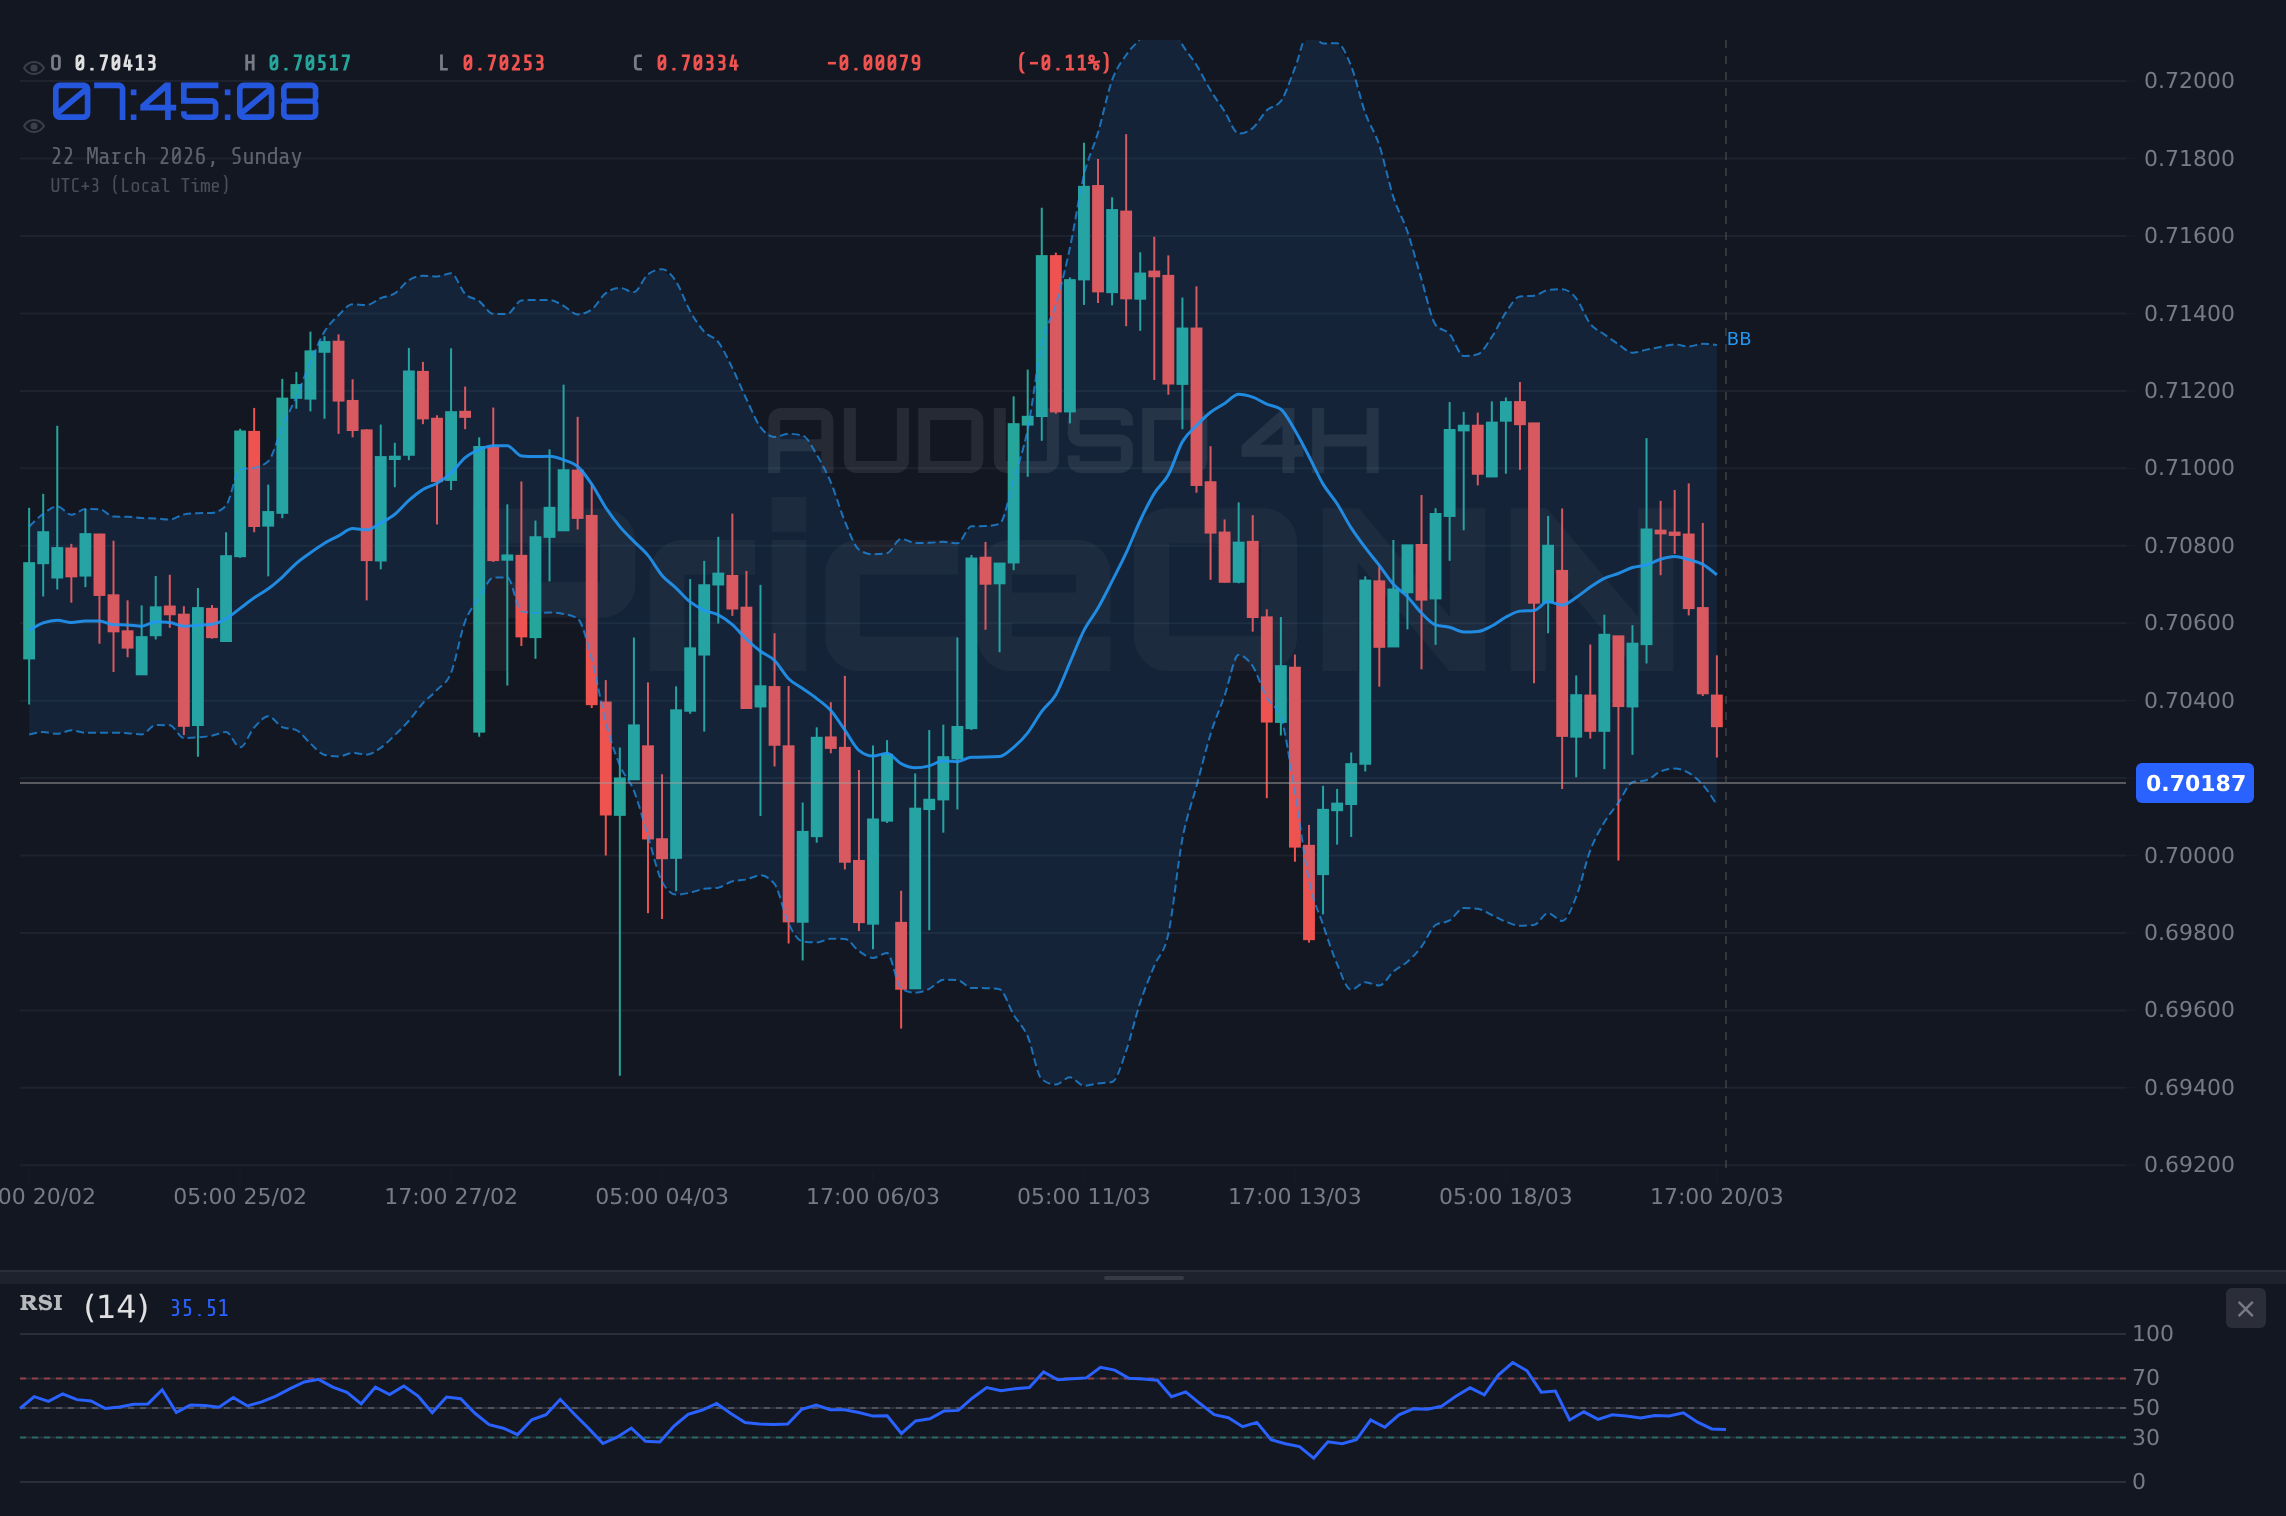
The Australian Dollar to US Dollar (AUDUSD) pair navigated a relatively flat week, consolidating around the critical $0.70188 mark. This period of relative calm followed significant volatility in the preceding weeks, leaving traders and analysts scrutinizing the interplay of global economic forces and technical signals. As we step into a new trading week, the $0.70188 level remains a focal point, with market participants keen to understand whether this consolidation is a pause before a decisive move or a prelude to continued range-bound trading. The broader market sentiment, heavily influenced by the US Dollar Index (DXY), commodity price action, and evolving central bank expectations, will undoubtedly play a crucial role in shaping the AUDUSD’s trajectory.
- AUDUSD is consolidating around the $0.70188 level after a volatile prior week, with the 1H RSI at 34.27 signaling potential bearish momentum.
- Key support is identified at $0.69997, while resistance looms at $0.70271, with ADX at 22.47 indicating a moderate downtrend.
- The US Dollar Index (DXY) at 99.25 shows a mixed picture across timeframes, influencing AUDUSD's correlation.
- Broader market sentiment, driven by energy price surges and risk appetite shifts, will be key in determining the next directional move for AUDUSD.
Last week’s price action for AUDUSD was characterized by a tight range, failing to establish a clear direction. The pair ultimately closed near where it opened, reflecting a market caught between opposing fundamental and technical pressures. On the 1-hour chart, indicators such as the RSI(14) at 34.27 suggest a bearish leaning, indicating that sellers may have a slight edge in the short term. However, this is juxtaposed with the broader daily trend, which, while showing weakness, is not yet in a strong directional phase according to the ADX at 20.48. This divergence across timeframes and indicators paints a picture of indecision, a common scenario when markets are awaiting fresh catalysts.
The $0.70188 price point is more than just a number; it represents a delicate balance of supply and demand. Below this, the immediate support at $0.69997, followed by $0.69901, becomes critical. A sustained break below these levels, particularly if accompanied by increasing trading volume, could signal a bearish continuation. Conversely, upward momentum would need to overcome resistance first at $0.70271, then $0.70449, to suggest a bullish reversal. The prevailing trend strength, as indicated by the ADX, is currently moderate on the daily chart (20.48), suggesting that while a trend exists, it lacks the conviction for a strong breakout in either direction without significant new impetus.
The technical indicators provide a nuanced, and at times conflicting, view. On the 1-hour timeframe, the Stochastic Oscillator is deep in oversold territory (K: 9.76, D: 12.46), often seen as a buy signal in ranging markets, yet the RSI at 34.27 points lower. The MACD histogram is negative, reinforcing the bearish sentiment on this short-term chart. However, moving to the daily chart, the picture becomes more muddled. The ADX value of 19.51 suggests a weak trend, meaning that price action might be more influenced by noise and short-term sentiment shifts rather than a dominant trend. This weak trend environment means that traditional indicator signals might be less reliable, requiring confirmation from price action itself.
This week’s price action on AUDUSD, closing around $0.70188, reflects a market grappling with a complex web of global influences. The US Dollar Index (DXY), currently trading around 99.25, presents a mixed signal. While the 1-hour timeframe shows a bullish bias, the 4-hour chart indicates a bearish lean, and the daily trend is firmly bullish. This duality in the dollar’s performance means its impact on AUDUSD is not straightforward. A stronger dollar typically weighs on AUDUSD, but if that strength is driven by risk aversion, it could simultaneously boost demand for the safe-haven dollar while potentially pressuring commodity-linked currencies like the Australian Dollar.
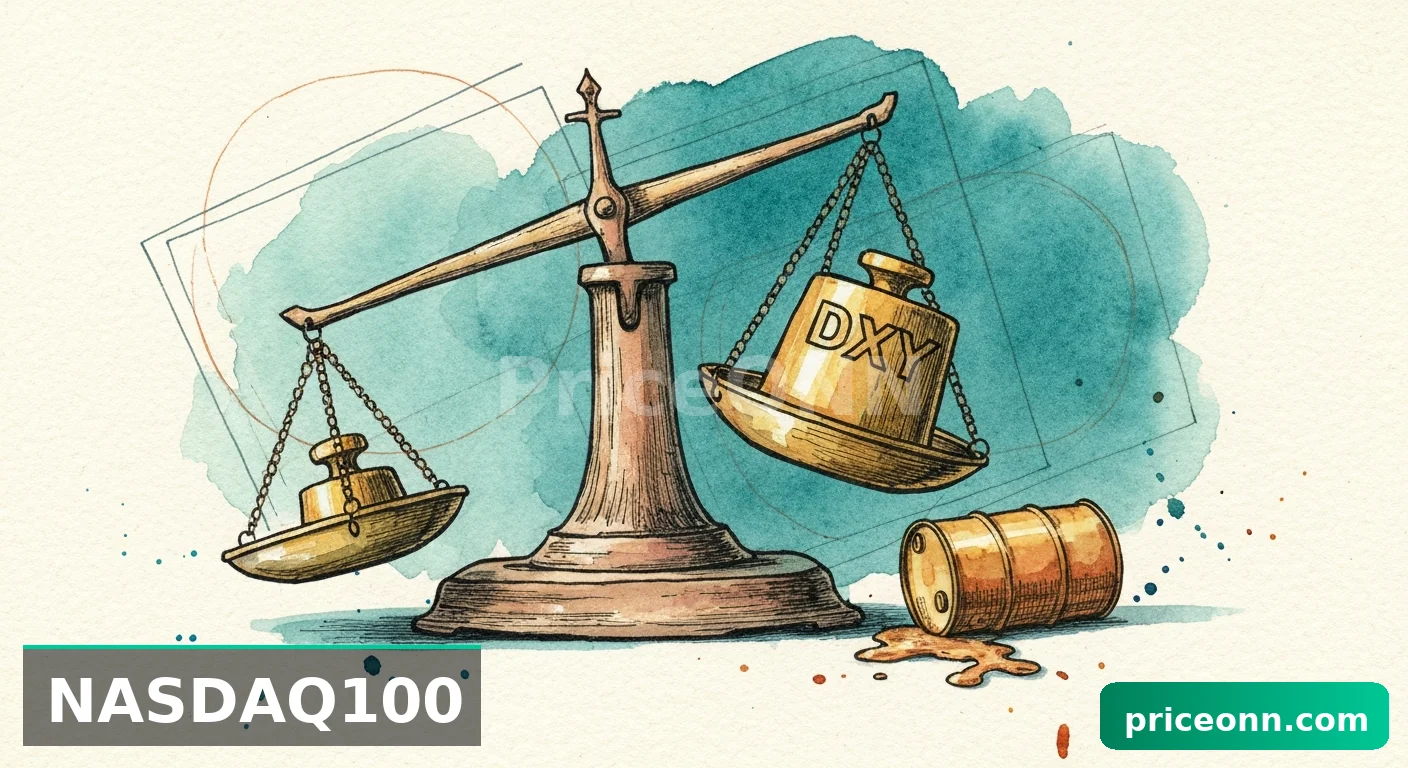
The correlation with major indices like the SP500 and Nasdaq100 is also a key factor to monitor. With the SP500 trading at 6536.67 and showing a strong bearish trend on the 1-hour and 4-hour charts, a risk-off sentiment is palpable. This often translates to reduced appetite for riskier assets, including the Australian Dollar, and increased demand for safe havens like the US Dollar. If this risk-off sentiment intensifies, it could provide headwinds for AUDUSD, pushing it towards the lower support levels identified around $0.69997 and below. The Nasdaq100, currently at 23986.8, also exhibits a strong bearish trend on shorter timeframes, reinforcing the notion of a cautious market environment.
Navigating the $0.70188 Confluence Zone
The immediate price zone around $0.70188 is a battleground for bulls and bears. On the 1-hour chart, the stochastic oscillator is flashing oversold conditions, hinting at a potential short-term bounce. However, the RSI at 34.27 and the ADX at 22.47 suggest that any bounce might be met with selling pressure, especially as the broader trend on the daily chart shows a weakening but still present bearish tilt. The key here is confluence – where do multiple indicators and price levels align? Currently, there isn't strong confluence for a decisive move, which explains the choppy price action.
Looking at the commodity complex, particularly oil prices, provides another layer of context. Brent crude is trading at $112.54, showing a strong bullish trend on the daily chart, while WTI is at $98.39, also exhibiting a strong daily uptrend. Rising oil prices can be a double-edged sword for AUDUSD. On one hand, Australia is a commodity exporter, and higher commodity prices can theoretically boost the nation's terms of trade and support the AUD. On the other hand, surging energy prices can fuel inflation fears globally, potentially leading central banks to maintain tighter monetary policies or even raise rates further, which could strengthen the US Dollar and thus pressure AUDUSD.
The geopolitical landscape remains a significant undercurrent. Recent news highlights tensions in energy hubs and discussions around energy security, with events like the Ras Laffan attack potentially disrupting energy markets. While not directly tied to the Australian economy, such global instability often fuels demand for safe-haven assets, primarily the US Dollar. This dynamic adds another layer of complexity to the AUDUSD outlook, as geopolitical risk events can override typical commodity-driven correlations, leading to scenarios where a rise in oil prices doesn't necessarily translate into a stronger Australian Dollar.
The Australian Dollar's fundamentals are also under scrutiny. Last week’s news, including reports on Australia's unemployment rate surprising to the upside and the PBOC holding rates steady, provides mixed signals. While higher unemployment might suggest economic headwinds, the market’s reaction and the RBA’s stance are crucial. PriceONN’s market news highlighted that AUD/USD dipped as Australia's unemployment rate surprised higher, but also noted prior strength stemming from RBA rate hike bets and a weaker dollar. This indicates that market sentiment can quickly shift based on central bank actions and relative economic performance.
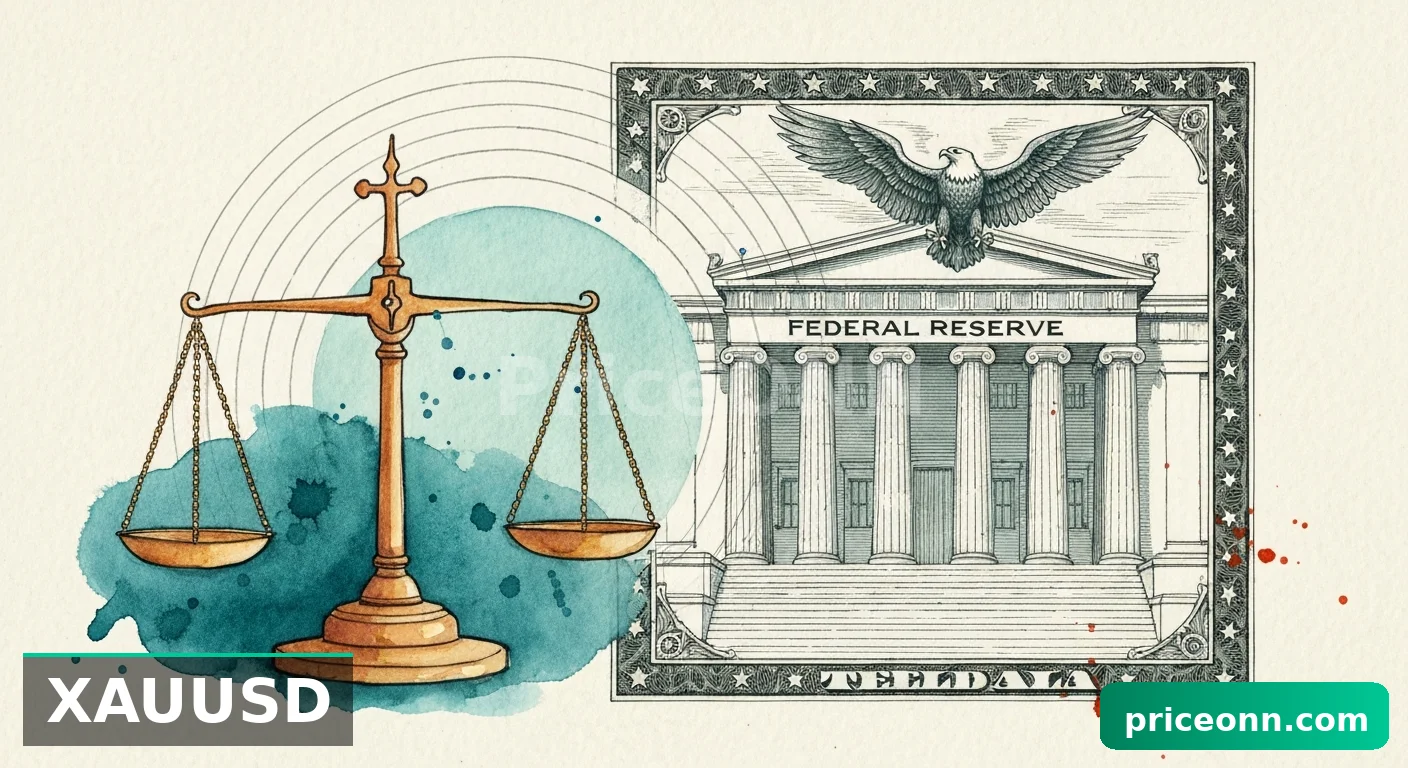
The narrative around central bank policies, particularly the Federal Reserve, continues to be a dominant theme. While the provided data doesn't include specific Fed meeting minutes or rate hike probabilities, the general market expectation of policy divergence often dictates currency movements. If the Fed maintains a hawkish stance or signals fewer rate cuts than anticipated, it would likely support the US Dollar, creating downward pressure on AUDUSD. Conversely, any indication of a dovish pivot from the Fed could weaken the dollar and provide a lift to the Aussie. Traders are constantly weighing these expectations against actual economic data releases.
From a multi-timeframe perspective, the AUDUSD presents a challenging trading environment. The 1-hour chart shows bearish signals with an RSI at 34.27 and ADX at 22.47, suggesting potential downside. The 4-hour chart, however, shows mixed signals with a neutral trend (ADX 19.14) and a Stochastic oscillator showing potential for a bounce, albeit with a bearish K/D cross. The daily chart reinforces the idea of a weak trend (ADX 19.51) with oversold conditions on the Stochastic (K: 8.67, D: 13.12), hinting at a potential buying opportunity if the price action confirms it. This lack of clear directional bias across all timeframes underscores the current market's indecision.
The $0.70188 Level: A Battleground for Weeks Ahead
The consolidation around $0.70188 has been a defining feature of AUDUSD's recent performance. This flat week, characterized by a tight range and indecisive technical signals, suggests that the market is in a holding pattern. The ADX values across different timeframes (1H: 22.47, 4H: 19.14, 1D: 19.51) consistently point towards weak trending conditions, which often precede a significant price move. Traders are likely waiting for a catalyst - be it a key economic data release, a geopolitical event, or a shift in central bank rhetoric - to break this stalemate.
The recent news flow provides context for this consolidation. Reports of Australia’s unemployment rate surprising higher would typically weigh on the AUD. However, this was counterbalanced by speculation around RBA rate hikes and shifts in Fed expectations, as highlighted in PriceONN’s market news. This push and pull between domestic economic data, RBA policy expectations, and global monetary policy dynamics creates the perfect environment for range-bound trading around key psychological levels like $0.70188.
Technically, the 1-hour chart’s RSI at 34.27 and Stochastic in oversold territory suggest that the immediate downside might be limited, potentially leading to a bounce towards the $0.70271 resistance. However, the strength of the daily trend, despite its low ADX value, cannot be ignored. If the broader market sentiment turns risk-averse, driven by factors like a strengthening DXY or escalating geopolitical tensions, AUDUSD could easily break below the $0.69997 support. The lack of strong momentum on the daily chart means that any short-term move needs confirmation from a decisive break of these key levels.
The correlation with broader market movements is particularly important. With the SP500 at 6536.67 and Nasdaq100 at 23986.8 showing bearish trends on shorter timeframes, a risk-off environment seems to be building. This typically benefits the US Dollar, which could exert downward pressure on AUDUSD, especially if the DXY begins a sustained rally. The current DXY price of 99.25 is hovering near resistance on some timeframes, making its next move critical. A break above DXY resistance could spell trouble for AUDUSD, pushing it towards its lower support levels.
Furthermore, the energy market’s performance, with Brent at $112.54 and WTI at $98.39 showing strong daily uptrends, adds another layer of complexity. While higher energy prices can sometimes support commodity currencies, they can also ignite inflation concerns, potentially leading to a stronger USD if central banks react hawkishly. This creates a scenario where even positive commodity price action might not translate into gains for AUDUSD if the DXY strengthens concurrently.
The search queries related to AUDUSD, such as "aud usd 0.7200 target" and "audusd fundamentals," indicate that traders are actively looking for directional cues and deeper analysis. While $0.7200 currently seems distant given the price action around $0.70188, the mention of this target suggests underlying bullish sentiment or expectations for a future rally. Understanding the fundamental drivers - ranging from RBA policy expectations to global inflation and risk sentiment - is crucial for deciphering whether such targets are achievable in the near to medium term.
The current technical setup on AUDUSD, with its trading range around $0.70188 and mixed indicator signals, suggests a period of consolidation. The weak trend indicated by the ADX on daily and 4-hour charts implies that significant price swings are unlikely without a clear catalyst. Traders are likely adopting a cautious approach, waiting for a break above the $0.70271 resistance or a decisive drop below the $0.69997 support to establish a clear direction. The interplay between the US Dollar’s performance, global risk sentiment, commodity prices, and central bank policy expectations will be the key determinants.
The daily chart shows the RSI at 47.97, hovering near the midpoint, and the Stochastic oscillator in oversold territory (K: 35.85, D: 44.21), suggesting that while selling pressure has been present, there might be room for a bounce. However, the MACD histogram is negative, indicating bearish momentum. This creates a tug-of-war scenario. A break above the $0.70271 resistance, confirmed by increasing volume and a positive shift in broader market sentiment, could open the door for a move towards $0.70449. Conversely, a failure to hold the $0.69997 support could lead to a test of $0.69901 and potentially lower.
The DXY's current position at 99.25 is also a critical factor. If the dollar index manages to break above its immediate resistance levels on the daily chart, it would likely put significant downward pressure on AUDUSD, especially given the latter’s current bearish lean on shorter timeframes. The correlation between AUDUSD and DXY is typically inverse, and a sustained dollar rally would make it difficult for the Aussie to find significant upside traction.
Market participants are also keenly watching for any shifts in the Federal Reserve’s policy outlook. While specific Fed Funds Futures probabilities are not provided in this market data, the general market narrative around rate cut expectations is a constant driver. Any data that suggests a more hawkish Fed - perhaps due to persistent inflation or strong employment figures - could strengthen the dollar and weigh on AUDUSD. Conversely, signs of a Fed leaning towards earlier or more aggressive rate cuts could weaken the dollar and offer support to the pair.
The performance of cryptocurrencies like Bitcoin (BTCUSD at 69329) and Ethereum (ETHUSD at 2115.18), both showing bearish trends on shorter timeframes, can also serve as a barometer for overall risk appetite. A continued sell-off in major cryptocurrencies often correlates with a broader risk-off sentiment, which would likely negatively impact AUDUSD. The lack of a clear directional bias in these digital assets mirrors the indecision seen in forex and equity markets.
Given the current technical picture - a flat week, consolidation around $0.70188, weak trend signals on daily charts (ADX 19.51), and conflicting indicators - caution is the prevailing sentiment. The ADX at 19.51 on the daily chart signifies a lack of strong trend, making it difficult to establish a high-conviction trade based purely on technicals. This environment favors range trading strategies or waiting for a clear breakout confirmation. The immediate support at $0.69997 and resistance at $0.70271 are the levels to watch for potential short-term opportunities, but a sustained move beyond these points would be required for a more significant directional trade.
The Path Forward: What to Watch Next
As we look ahead, several factors will be crucial in determining the next move for AUDUSD. Key economic data releases from both Australia and the United States will be paramount. Any surprises in inflation, employment, or GDP figures could shift central bank expectations and, consequently, currency valuations. The ongoing geopolitical developments and their impact on global risk sentiment will also remain a significant backdrop, potentially driving safe-haven flows into the US Dollar.
From a technical standpoint, the $0.70188 level continues to be the pivot. A confirmed break above $0.70271 could target $0.70449 and potentially higher, especially if broader market sentiment turns risk-on. Conversely, a decisive drop below $0.69997 might open the path towards $0.69901 and further downside. The weak trending nature indicated by the ADX suggests that breakouts may not be sustained initially and could be prone to false moves, emphasizing the need for confirmation and careful risk management.
The correlation analysis remains vital. A strengthening DXY, particularly if it breaks key resistance levels, would likely exert downward pressure on AUDUSD. Conversely, if risk appetite improves and major indices like the SP500 (at 6536.67) and Nasdaq100 (at 23986.8) begin to recover, it could provide a tailwind for the Australian Dollar. The performance of oil prices, while supportive of commodity currencies in theory, needs to be viewed in conjunction with its potential inflationary impact and the subsequent USD reaction.
Traders should remain vigilant for divergences between indicators and price action. For instance, while the daily Stochastic is oversold, a lack of follow-through buying could signal a deeper correction. Similarly, any bearish divergence on the RSI as price approaches resistance could warn of a potential reversal. The current market environment demands patience and a focus on risk management, waiting for clearer signals and confirmations before committing to significant positions.
Ultimately, the AUDUSD pair is reflecting the broader market's uncertainty. With key levels like $0.70188 holding, the market is in a state of equilibrium, but one that feels temporary. The interplay of monetary policy divergence, inflation concerns, geopolitical risks, and shifting risk sentiment creates a complex environment. As we move through the upcoming week, close observation of these drivers, coupled with adherence to risk management principles, will be essential for navigating the potential volatility.
Frequently Asked Questions: AUDUSD Analysis
What happens if AUDUSD breaks below the $0.69997 support level?
A break below $0.69997 on AUDUSD, supported by increased volume and bearish market sentiment, could signal a continuation of the downtrend. This might lead to a test of the next support at $0.69901, with further downside potential towards $0.69723 if the bearish momentum persists.
Is the current RSI at 34.27 a buy signal for AUDUSD at $0.70188?
An RSI of 34.27 on the 1-hour chart suggests oversold conditions, which can sometimes precede a bounce. However, it is not a standalone buy signal, especially with the daily chart showing weak trend strength (ADX 19.51) and negative MACD momentum. Confirmation from price action breaking resistance at $0.70271 would be needed.
How will the strong DXY at 99.25 affect AUDUSD's outlook?
A DXY at 99.25, especially if it breaks higher resistance levels, typically exerts downward pressure on AUDUSD due to their inverse correlation. This strengthening dollar could make it difficult for AUDUSD to hold above $0.70188 and might push it towards support levels, particularly if global risk sentiment favors the greenback.
What should traders watch for a decisive move in AUDUSD from current levels?
Traders should watch for a clear break and sustained move above resistance at $0.70271, potentially targeting $0.70449, or a decisive drop below support at $0.69997, targeting $0.69901. Confirmation from increased volume, improved trend strength (higher ADX), and aligned indicators across multiple timeframes will be crucial.
"Patience is a virtue in these choppy markets. Wait for clear signals and manage your risk diligently. Opportunity often lies just beyond the current indecision."
Track markets in real-time
AI-powered analysis, technical indicators and real-time price data.
Join Our Telegram Channel
Breaking market news, AI analysis and trading signals instantly.
Join Channel