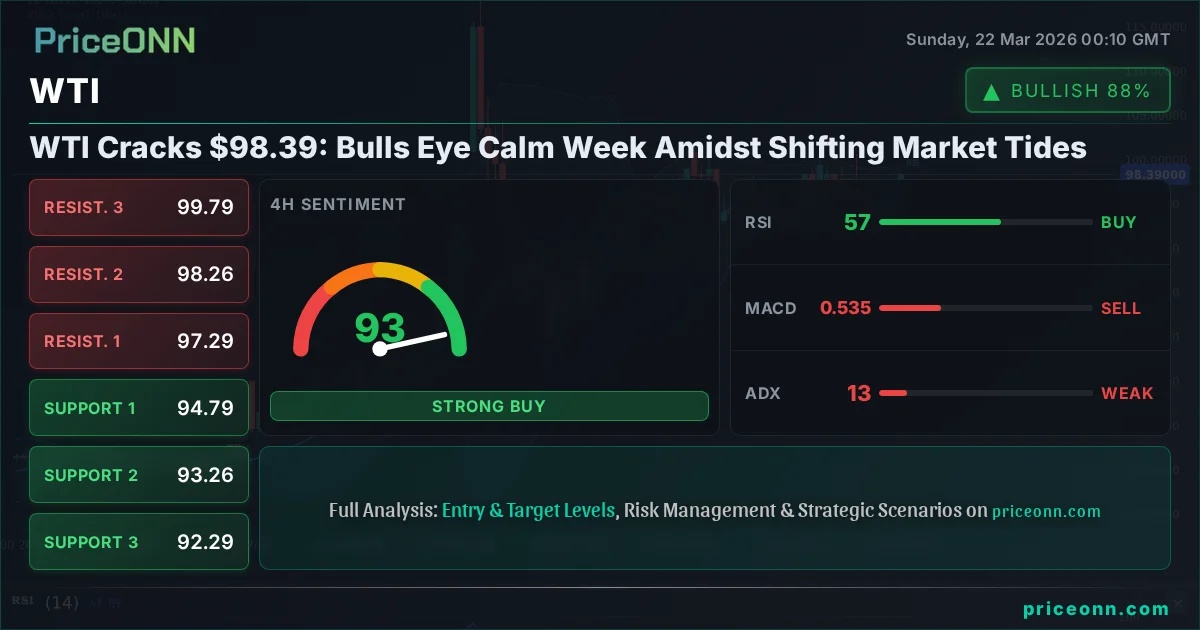
WTI Cracks $98.39: Bulls Eye Calm Week Amidst Shifting Market Tides
WTI crude trades at $98.39. After a volatile week, can bulls maintain momentum as geopolitical tensions simmer and macro factors shift?
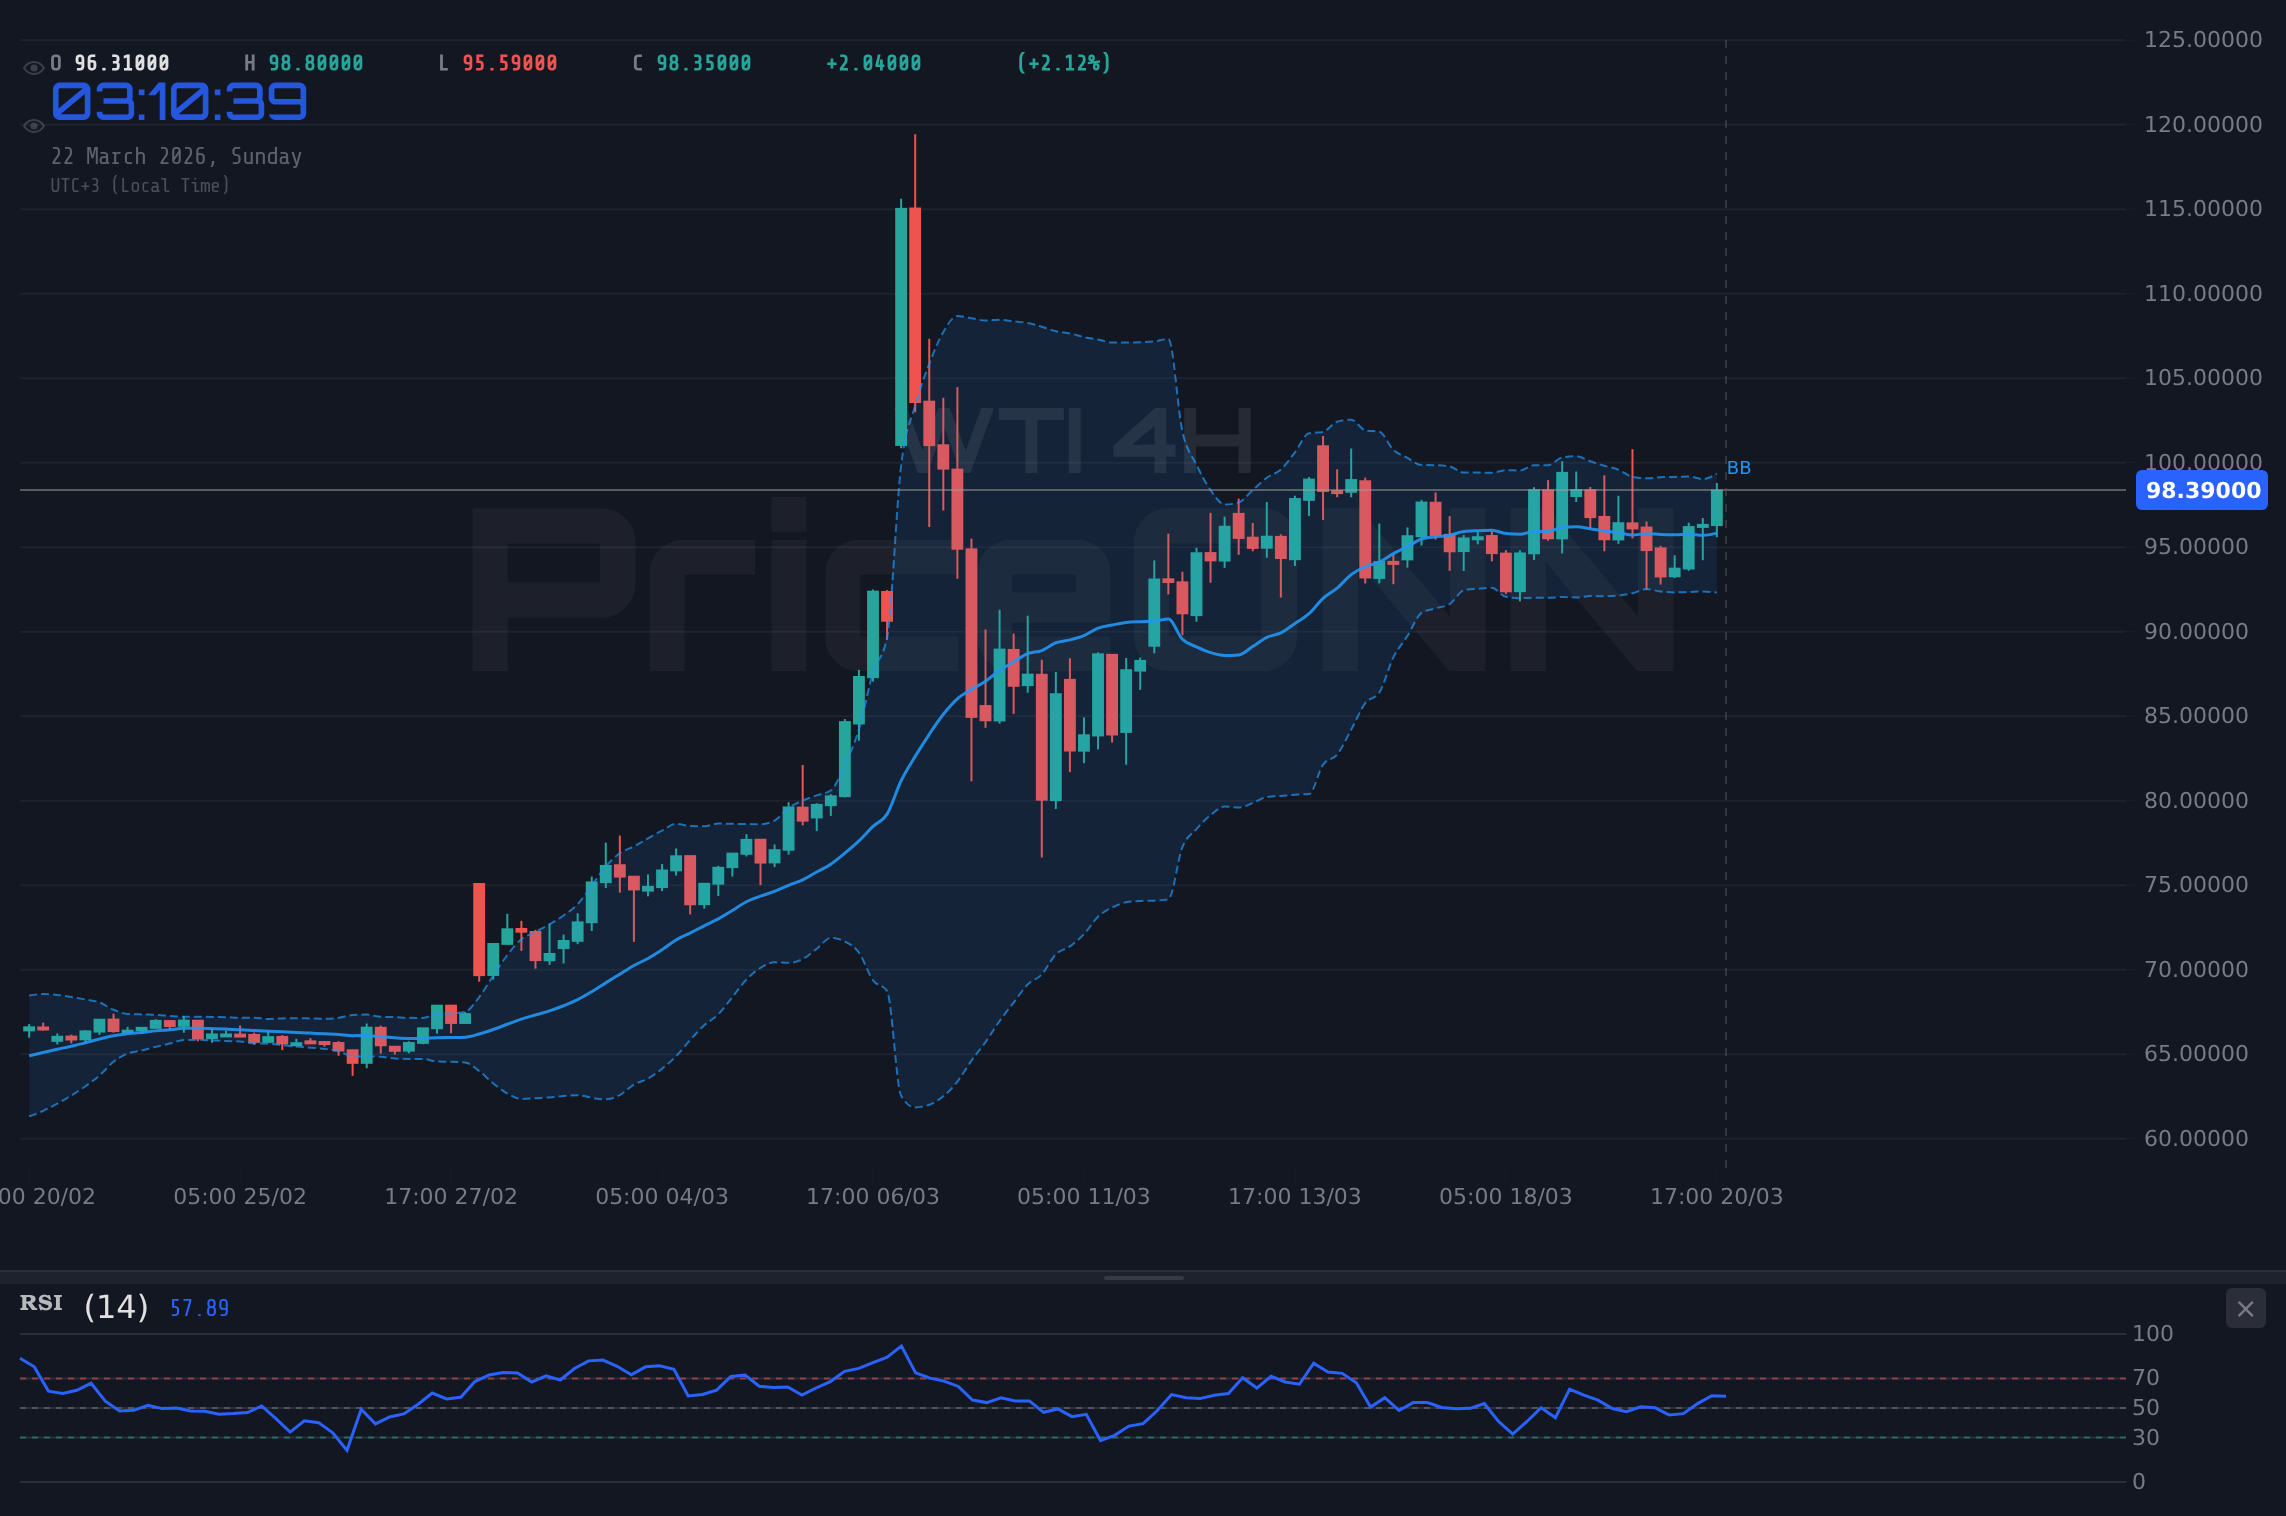
The tug-of-war between bullish and bearish forces in the crude oil market has intensified, with WTI hovering precariously around the $98.39 mark. This past week has been a testament to the complex interplay of geopolitical risk, macroeconomic shifts, and evolving market sentiment. As traders brace for the upcoming week, the critical question remains: are the bulls gaining a sustainable advantage, or is this merely a temporary respite before further volatility? This analysis delves into the competing narratives, dissecting the technical landscape and fundamental underpinnings that will shape WTI's trajectory in the coming days.
- WTI crude is trading at $98.39, with the 4-hour ADX at 13.05 indicating a weak, potentially ranging trend, suggesting caution for aggressive entries.
- The daily RSI stands at 70.58, signaling overbought conditions that could lead to profit-taking or consolidation.
- Key support for WTI is identified at $91.26 (S1), while resistance looms at $99.60 (R1), forming a crucial battleground.
- Geopolitical tensions in the Middle East continue to underpin oil prices, but signs of de-escalation efforts and a strengthening DXY could present headwinds.
The narrative surrounding WTI crude oil is currently a delicate balance, teetering between the persistent influence of geopolitical instability and emerging signs of macroeconomic recalibration. Last week saw significant price action, culminating in WTI trading at $98.39. While the immediate outlook might suggest a degree of calm, the underlying currents are far from settled. This period demands a nuanced approach, one that acknowledges the forces pushing prices higher while remaining acutely aware of the potential triggers for a sharp reversal.
The energy markets, particularly crude oil, have been exceptionally sensitive to global events. The past week was no exception, with significant price swings reflecting the market's reaction to developing geopolitical situations and shifting economic outlooks. WTI, our primary focus, has been navigating these choppy waters, and understanding the forces at play is crucial for any trader looking to position themselves effectively. The current price of $98.39 is not just a number; it represents a confluence of supply-demand dynamics, risk premiums, and broader market sentiment.
The recent headlines have painted a complex picture. On one hand, ongoing geopolitical tensions, particularly in the Middle East, have consistently acted as a bullish catalyst for oil prices, reminding the market of potential supply disruptions. News of attacks on energy hubs, while concerning, often injects a risk premium into the market, pushing prices upwards. However, counterbalancing this is the evolving macroeconomic landscape. Signs of potential de-escalation in certain conflict zones, coupled with a strengthening US Dollar (DXY), can act as powerful headwinds, capping rallies and inviting profit-taking. The DXY itself has shown resilience, trading at 99.25, which typically exerts downward pressure on dollar-denominated commodities like WTI.
Furthermore, the broader commodity complex has experienced significant shifts. Gold, silver, and copper prices have seen notable declines, as reported by market news, indicating a potential cooling of inflation expectations or a broader risk-off sentiment taking hold in other asset classes. This divergence can sometimes be a leading indicator for crude oil, suggesting that the current bullish narrative for energy might face increased scrutiny. The fact that these key industrial and safe-haven commodities are faltering adds another layer of complexity to WTI's outlook.
The technical indicators also present a mixed, albeit cautious, picture for WTI. While the daily chart shows a strong uptrend with an RSI at 70.58, signaling overbought conditions, the shorter timeframes paint a picture of a market that might be losing momentum. The 4-hour ADX, for instance, is sitting at a low 13.05, which is a red flag for trend traders, indicating a lack of strong directional conviction and suggesting a choppy, range-bound environment rather than a clear breakout. This low ADX reading is precisely why a trade recommendation is currently absent; the market conditions are not conducive to high-probability trades.
The Bull Case: Geopolitical Risk and Demand Resilience
Despite the mixed signals, a compelling case can be made for continued bullish momentum in WTI, primarily driven by the persistent geopolitical risk premium and surprisingly resilient demand dynamics. The ongoing conflicts and tensions in the Middle East continue to cast a long shadow over global oil supply. The specter of potential supply disruptions, even if not immediately realized, keeps a floor under prices. Any escalation or new flare-up in the region can swiftly reignite buying interest, pushing WTI higher.
The news from March 21st, highlighting an attack on Qatar's Ras Laffan energy hub, serves as a stark reminder of this vulnerability. While the immediate impact on LNG was discussed, such events underscore the fragility of energy infrastructure in critical supply regions. This inherently supports higher oil prices as a hedge against future supply shocks. Traders and institutional players factor this risk into their positions, creating a structural bid for crude.
Beyond immediate geopolitical events, the demand side also presents a more robust picture than some might expect. Despite concerns about global economic slowdowns, key economies are showing pockets of strength. The news regarding Alaska's record-breaking oil and gas lease sale, generating $163.7 million, signals renewed major oil interest and exploration, suggesting that long-term demand projections remain positive. While the immediate impact might be on future supply, it reflects a continued belief in the underlying demand for oil.
Furthermore, the discussion around AI's insatiable energy demand and the potential for a nuclear fusion revolution, while futuristic, highlights the long-term reliance on energy sources. Even the immediate surge in data center energy consumption due to AI is creating tangible, near-term demand for power, which, in turn, supports energy prices. This backdrop suggests that the structural demand for oil, while evolving, is not disappearing overnight and may even find new drivers.
Technically, the daily chart offers some support for the bullish thesis. The trend is still technically classified as 'Uplift' with a strength of 100% on the 1D timeframe, albeit with an RSI at 70.58 which is entering overbought territory. The MACD on the daily chart is positive, showing momentum, and the Bollinger Bands are above the middle band, suggesting an upward bias. The Stochastic Oscillator, while showing some divergence on shorter timeframes, indicates potential for further upward movement on the daily chart, with K line above D line. The ADX on the daily chart is 59.27, indicating a very strong uptrend. This suggests that if any supportive news emerges, the existing trend could reassert itself.
The bullish scenario hinges on the continuation of geopolitical risk premiums and the market largely shrugging off concerns about economic slowdowns. If supply-side disruptions remain a tangible threat, and if key economic indicators continue to show resilience, WTI could well push towards higher resistance levels. The key is whether the market prioritizes the immediate supply risks over the longer-term demand concerns and potential for central bank tightening.
The Bear Case: Macro Headwinds and Technical Exhaustion
Conversely, a strong bearish argument can be constructed by focusing on the mounting macroeconomic headwinds and the signs of technical exhaustion, particularly on shorter timeframes. The global economic outlook remains a significant concern, with inflation proving persistent in many major economies. This could force central banks, including the Federal Reserve, to maintain or even increase interest rates, which historically dampens economic activity and, consequently, oil demand.
The US Dollar's unexpected weakening last week, despite rising global risks, is a complex signal. While a weaker dollar can sometimes support commodity prices, its recent movements, coupled with rising Treasury yields, present a confusing picture. However, the DXY's current position at 99.25 and its strong daily uptrend (92% strength) suggests it might regain its footing. A stronger dollar typically makes oil more expensive for holders of other currencies, potentially dampening demand and pressuring prices downward.
The news regarding gold, silver, and copper prices tumbling this week is also a significant bearish signal for the broader commodity complex, including oil. When safe-haven assets and key industrial metals enter bear market territory, it often reflects a broader risk-off sentiment or a reassessment of inflation expectations. If these markets are signaling a slowdown, it's logical to assume that crude oil, a key driver of global inflation, could face similar pressures. The fact that these markets are already declining suggests that the bullish narrative for oil might be losing traction.
From a technical standpoint, the shorter-term charts present clear warning signs. On the 1-hour timeframe, the ADX is a mere 13.05, indicating a very weak trend and suggesting that any upward move is likely to be met with significant selling pressure as traders attempt to take profits or initiate short positions. The RSI is at 61.45, which is moving towards overbought territory but is not yet an immediate sell signal. However, the Stochastic Oscillator on the 1-hour chart is showing K at 91.26 and D at 89.37, indicating an extremely overbought condition and a high probability of a pullback or reversal. The 4-hour chart echoes this caution, with an ADX of 13.05, further reinforcing the idea of a non-trending, choppy market on shorter frames.
The daily RSI at 70.58, while indicating strength, is also entering the overbought zone. Historically, when RSI reaches these levels without corresponding fundamental catalysts for further sustained upside, a correction or consolidation often follows. The market seems to be at a critical juncture where the bullish momentum, fueled by geopolitical fears, might be meeting technical exhaustion and broader macroeconomic concerns.
The bearish scenario is predicated on the idea that the market is beginning to price in a potential global economic slowdown, coupled with a strengthening dollar and a broader cooling of the commodity complex. If geopolitical tensions ease, even slightly, the risk premium supporting oil prices could evaporate quickly. Furthermore, if major central banks signal a prolonged period of higher interest rates, the demand destruction narrative could gain prominence, leading to a significant price correction.
Navigating the Cross-Currents: Key Levels and Intermarket Dynamics
To make sense of the conflicting signals, a close examination of key technical levels and intermarket correlations is essential. The current price of WTI at $98.39 sits within a crucial zone, caught between the immediate bullish sentiment and the broader bearish undertones. The support levels on the daily chart are identified at $91.26 (S1), $87.69 (S2), and $82.92 (S3). Conversely, resistance levels are seen at $99.60 (R1), $104.37 (R2), and $107.94 (R3). The $99.60 level is particularly significant; a sustained break above this could embolden the bulls, while failure to do so could invite sellers.
The correlation with the US Dollar Index (DXY) remains a paramount consideration. With the DXY currently at 99.25 and showing a strong daily uptrend (92% strength), any further strengthening of the dollar could exert significant downward pressure on WTI. Conversely, if the DXY falters, it could provide additional tailwind for oil prices. The interplay between these two is critical for understanding short-term price action.
The performance of other commodities also provides vital context. The recent weakness in gold, silver, and copper suggests a potential shift in market sentiment away from inflation hedges or a broader economic slowdown narrative. If oil prices continue to rise while these other key commodities fall, it would signal a decoupling that warrants further investigation. Typically, a strong oil price rally is accompanied by strength in other industrial metals, reflecting robust global demand. The current divergence is a point of caution for the bulls.
The ADX readings across different timeframes offer a stark warning. The 4-hour ADX at 13.05 and the 1-hour ADX at 13.05 signal a lack of strong directional conviction in the short-to-medium term. This suggests that the market is likely to experience choppiness and potentially range-bound conditions. While the daily ADX at 59.27 indicates a very strong uptrend, the conflicting signals on shorter frames imply that the trend may be maturing or facing significant headwinds. Traders should be wary of chasing breakouts in such an environment.
The RSI on the daily chart at 70.58 is another level to watch closely. While not yet in extreme overbought territory, it is approaching a zone where corrections have historically occurred. A sustained move above 70 often signals strong bullish momentum, but it also increases the probability of a pullback as the market takes a breather or as sellers step in to capitalize on the high prices.
The Verdict: A Cautious Outlook with Defined Risk Levels
Weighing the geopolitical tailwinds against the macroeconomic headwinds and technical signals, the outlook for WTI crude oil appears to be one of cautious optimism, leaning towards consolidation rather than a runaway rally in the immediate short term. The persistent geopolitical risks provide a strong foundational support for prices, making a sharp, sustained decline unlikely without a significant de-escalation or a major shift in global demand.
However, the technical picture, particularly on the 1-hour and 4-hour charts, coupled with the strength of the US Dollar and the weakness in other commodities, suggests that the upside may be capped in the near term. The low ADX readings on shorter timeframes point towards a choppy, potentially sideways market. This environment is not ideal for trend-following strategies and requires a more patient, range-trading or mean-reversion approach, albeit with extreme caution.
The key levels to watch are paramount. A sustained break and hold above the daily resistance at $99.60 would be needed to confirm a continuation of the bullish trend, potentially targeting the next resistance at $104.37. On the downside, failure to hold the $91.26 support level could signal a more significant correction, possibly targeting $87.69. Given the current ADX readings, a clear breakout above $99.60 or a decisive breakdown below $91.26 may not occur without a catalyst.
The market sentiment analysis suggests that while geopolitical fears are keeping a bid under oil, the broader economic concerns and the potential for a stronger dollar are acting as a drag. This duality creates a scenario where WTI might trade within a defined range, with significant volatility on news events but lacking a clear directional trend until a more definitive macroeconomic or geopolitical catalyst emerges.
For traders, this means exercising discipline. The current market conditions, characterized by strong daily trends but weak short-term momentum and conflicting intermarket signals, necessitate a focus on risk management. Entries should be sought on pullbacks towards key support levels rather than chasing extended moves, and stops should be placed tightly, acknowledging the potential for sharp reversals or range-bound trading.
Scenario Analysis: Mapping the Path Forward
To provide a clearer roadmap, let's consider the potential scenarios that could unfold in the coming week, based on the current technical and fundamental landscape.
Bearish Scenario: Consolidation and Downside Risk
65% ProbabilityNeutral Scenario: Range-Bound Volatility
25% ProbabilityBullish Scenario: Geopolitical Premium Persists
10% ProbabilityFrequently Asked Questions: WTI Analysis
What happens if WTI breaks below $91.26 support?
A break below the $91.26 support level on WTI would signal a significant shift in market sentiment, likely invalidating the current bullish narrative. This could lead to a rapid sell-off targeting the next support at $87.69, driven by demand destruction fears or de-escalation in geopolitical tensions.
Should I buy WTI at current levels of $98.39 given the daily RSI at 70.58?
Buying at $98.39 with the daily RSI at 70.58 carries risk, as it indicates overbought conditions. While the trend is strong, a pullback is possible. A more prudent approach might be to wait for a dip towards support levels like $91.26 or confirmation of a breakout above $99.60, especially given the weak short-term ADX readings.
Is the ADX at 13.05 a sell signal for WTI right now?
An ADX reading of 13.05 is not a direct sell signal but rather an indicator of a weak trend. It suggests choppy, range-bound conditions on the 1-hour and 4-hour charts, making aggressive trend-following trades risky. This low ADX reading implies that the market lacks conviction and might consolidate or reverse sharply.
How will the DXY's trend at 99.25 affect WTI this week?
With the DXY at 99.25 showing a strong daily uptrend (92% strength), a strengthening dollar poses a headwind for WTI. A higher DXY typically makes oil more expensive for holders of other currencies, potentially dampening demand and pressuring prices lower. Traders should monitor DXY's movement closely as a key correlated factor.
The energy markets are a constant dance between supply-side risks and demand-side realities, all filtered through the lens of macroeconomic policy and geopolitical events. For WTI, the $98.39 level represents a critical juncture. While geopolitical tensions provide a strong underpinning, the technical indicators on shorter timeframes and the broader macroeconomic environment suggest that significant upside may be challenged without clear catalysts. Patience and disciplined risk management will be key for navigating this complex landscape in the week ahead. Remember, volatility creates opportunity, and understanding these dynamics is the first step towards capitalizing on them.
“The market always tells you where it’s going, but you have to listen carefully. Right now, WTI is whispering caution, even as geopolitical headlines shout bullishness. Respect the levels, manage your risk, and wait for clarity.”
Track markets in real-time
AI-powered analysis, technical indicators and real-time price data.
Join Our Telegram Channel
Breaking market news, AI analysis and trading signals instantly.
Join Channel