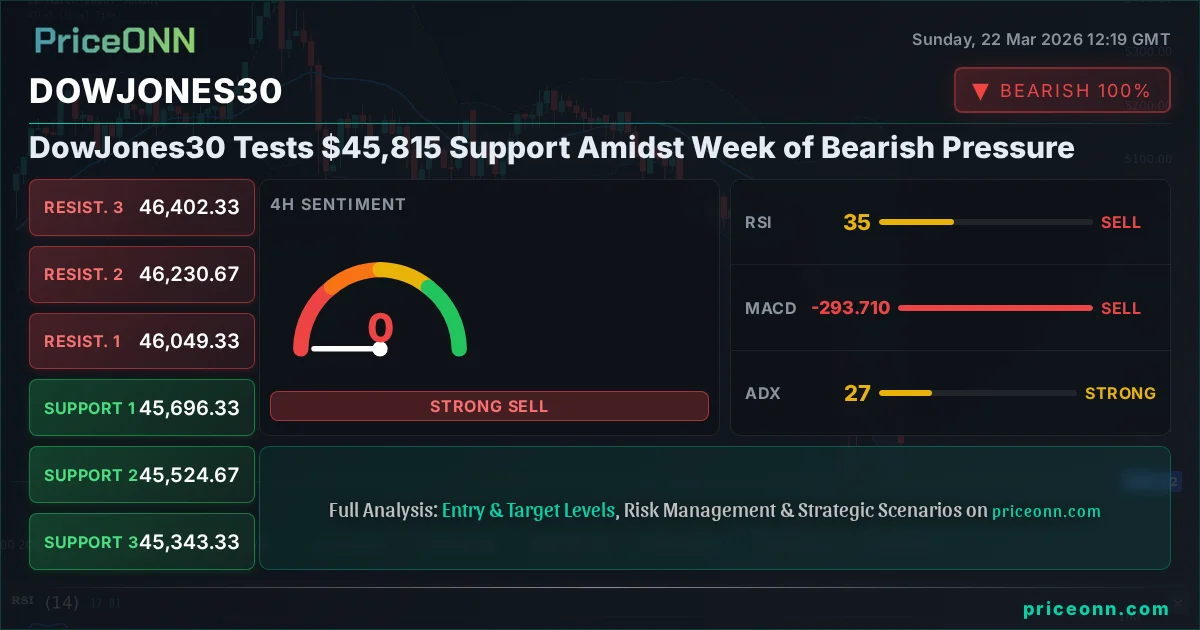
DowJones30 Tests $45,815 Support Amidst Week of Bearish Pressure
The DowJones30 closed last week near $45,815.46 after a bearish sentiment dominated, with key levels tested. What's next?
The past trading week saw the Dow Jones Industrial Average ($DJI) grapple with significant bearish pressure, culminating in a close around the critical $45,815.46 mark. While the index experienced a notable downturn, the resilience shown at this key support level has ignited a debate among traders and analysts: are we on the cusp of a bounce, or is this merely a pause before further declines? This analysis delves into the confluence of technical signals, macroeconomic undercurrents, and market sentiment that shaped the past week and will likely dictate the Dow's trajectory in the coming days. Understanding the interplay between global risk appetite, the strength of the US Dollar, and energy market dynamics is crucial for navigating the choppiness that lies ahead.
- The DowJones30 closed the week at $45,815.46, testing significant support after a broad market sell-off.
- The 4-hour RSI reading at 32.35 signals oversold conditions, but the ADX at 24.88 indicates a strong downtrend is still in play.
- Key support for the DowJones30 lies at $45,696.33 (S1), with a decisive break below targeting $45,343.33 (S3).
- Resistance is firmly set at $46,049.33 (R1), a level that needs to be reclaimed for a bullish shift.
- The DXY's rise to 99.25 and falling S&P 500 index (6536.67) highlight a risk-off environment impacting the DowJones30.
The Bearish Case: Why the DowJones30 Faces Headwinds
A Week of Declining Risk Appetite
The trading week ending March 22nd, 2026, painted a decidedly bearish picture for the Dow Jones Industrial Average. After closing the previous week near $45,815.46, the index succumbed to selling pressure, driven by a confluence of global macroeconomic concerns and a general risk-off sentiment that permeated financial markets. The daily chart clearly illustrates this downtrend, with the index experiencing a significant -0.58% decline on Friday alone, bringing its total weekly losses into focus. This was not an isolated event; major US equity indices like the S&P 500 ($SP500) and the Nasdaq 100 ($Nasdaq100) also posted substantial losses, falling -1.2% and -1.67% respectively on Friday. This synchronized weakness across the broader market suggests that the headwinds facing the Dow Jones are systemic rather than specific to individual components.
The Dollar Index (DXY) also played a role, ticking up to 99.25. A stronger dollar often correlates with pressure on global equities, as it makes US assets more expensive for foreign investors and can signal tighter global liquidity conditions. Furthermore, the energy markets saw significant volatility, with Brent crude oil ($BRENT) rallying 4.58% to $112.54 and WTI crude ($WTI) jumping 3.76% to $98.39. While rising oil prices can sometimes be inflationary and boost energy stocks, they also raise concerns about economic growth and corporate margins for non-energy sectors, contributing to the broader risk aversion.
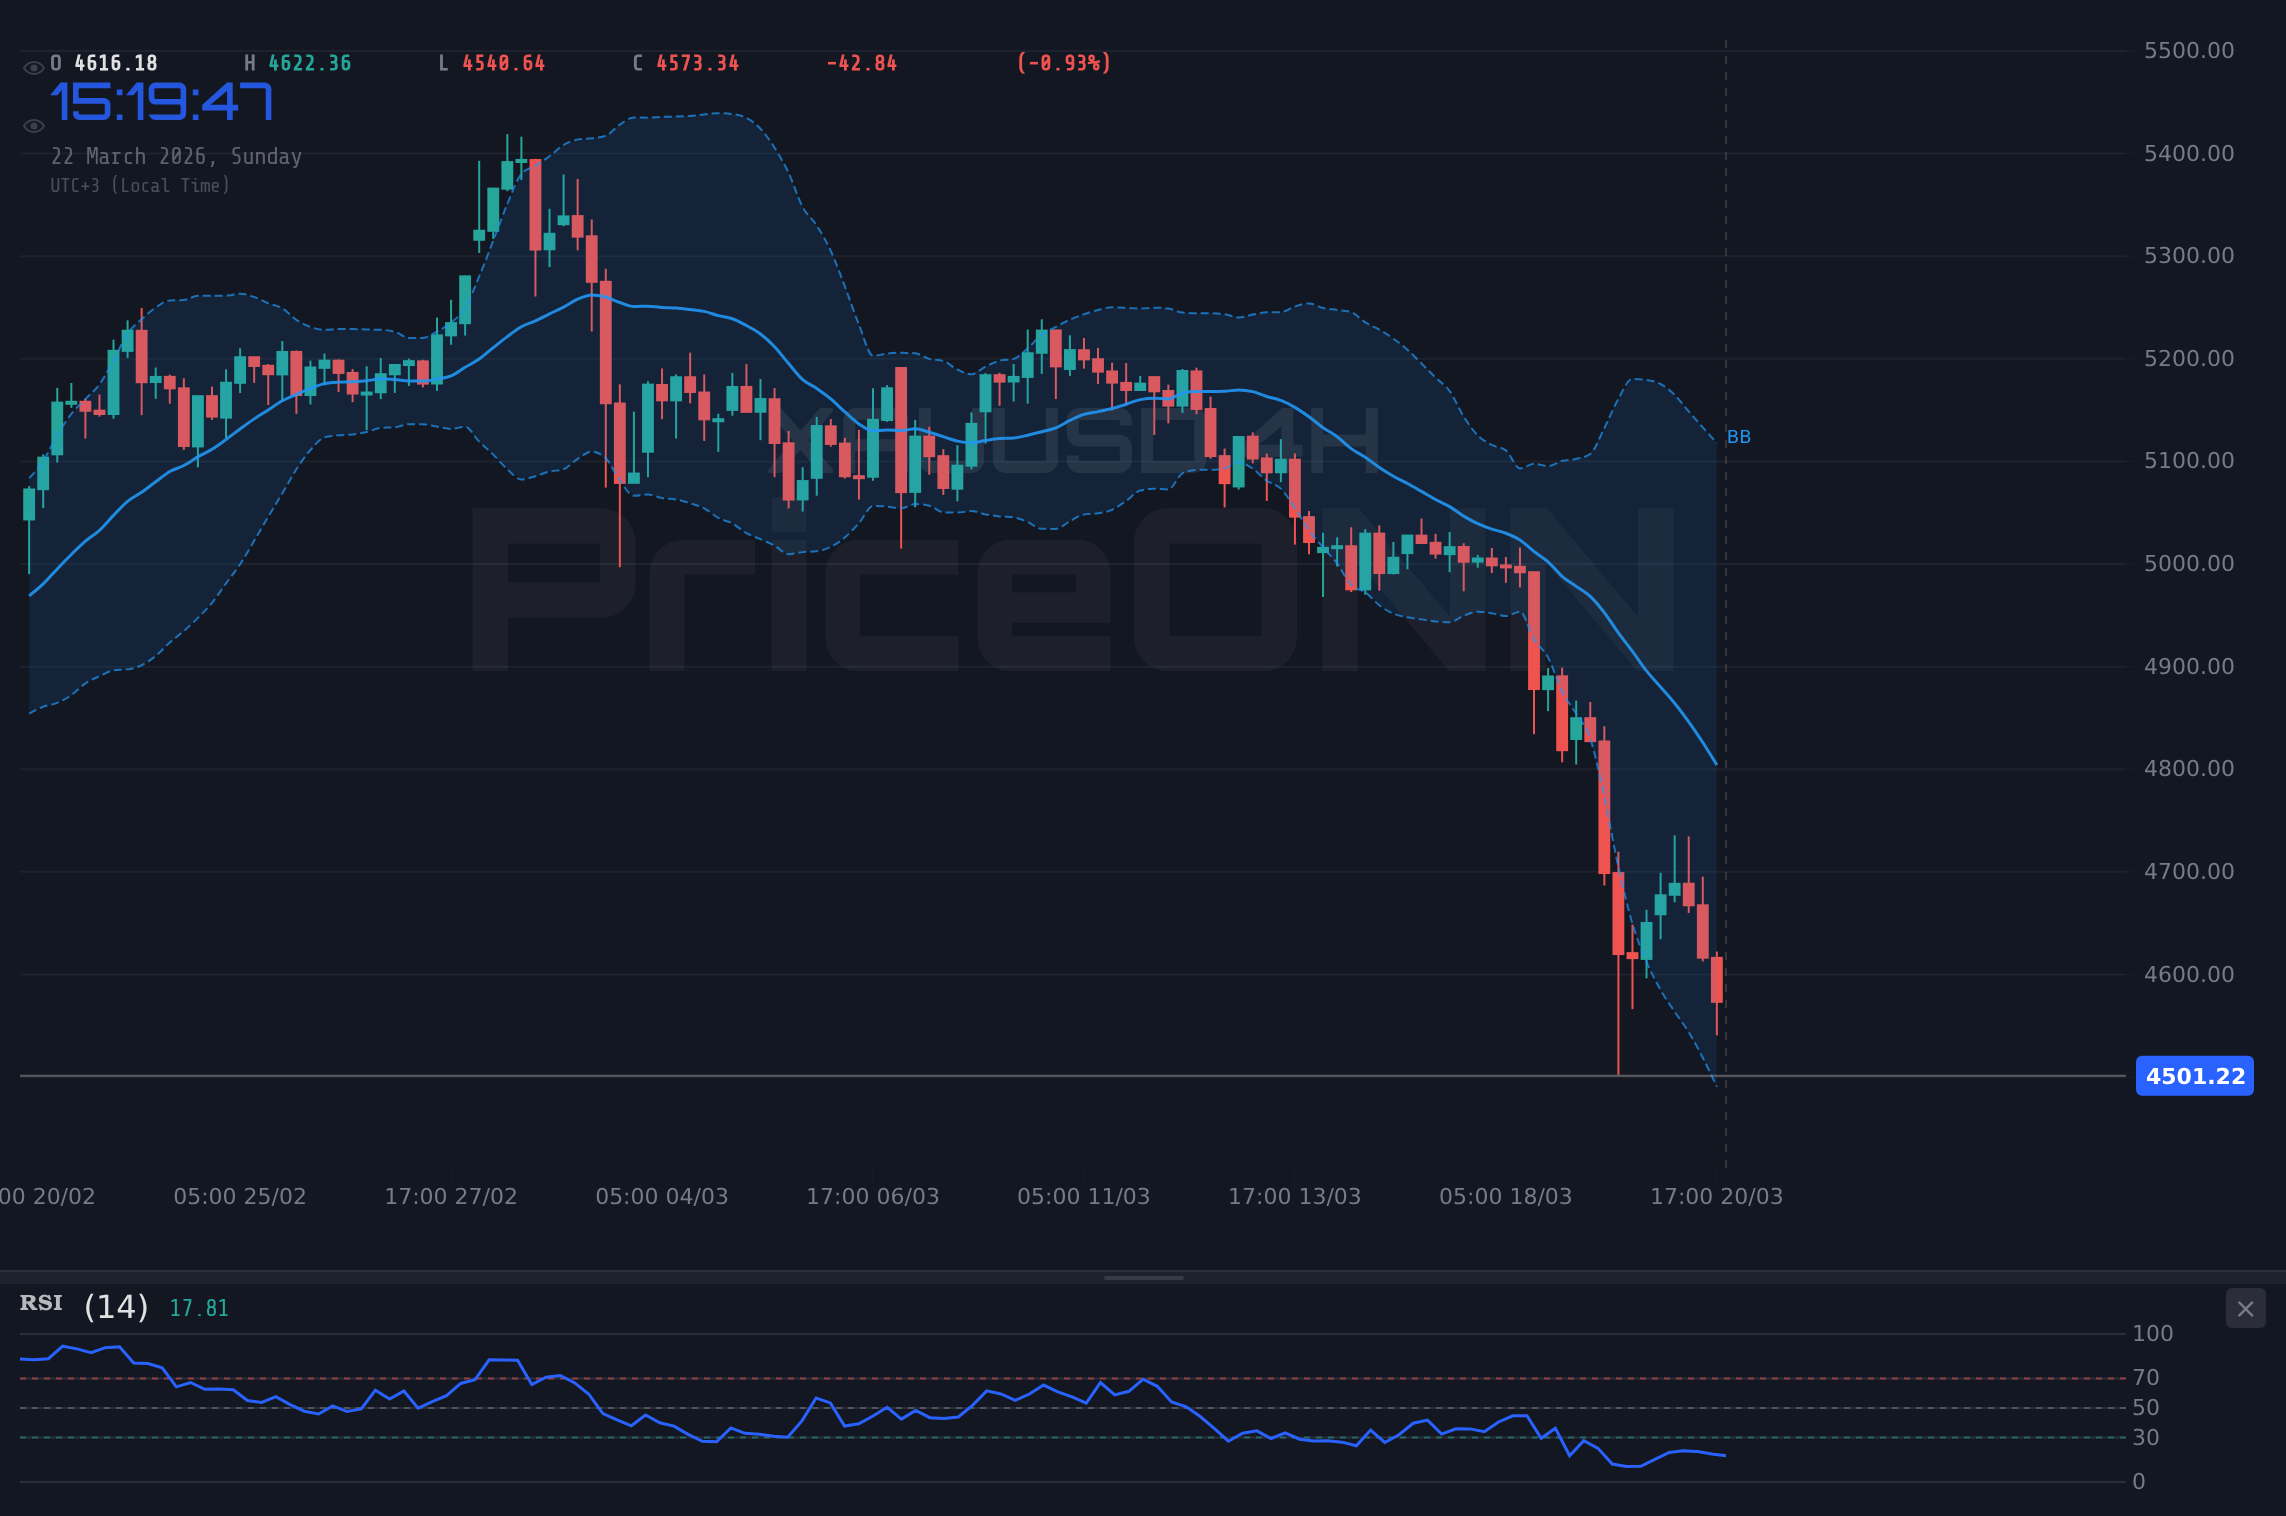
The technical indicators on the daily timeframe for the Dow Jones Industrial Average ($DJI) reinforce the bearish narrative. The Relative Strength Index (RSI) at 27.11 is deep in oversold territory, suggesting that the selling may have been overextended in the short term. However, the Moving Average Convergence Divergence (MACD) histogram remains negative, with the MACD line below its signal line, indicating that bearish momentum is still in play. The Average Directional Index (ADX) at 41.79 is particularly telling; it signifies a very strong downtrend, suggesting that the current price action is not merely a blip but part of a more significant directional move. This is further corroborated by the Stochastic Oscillator, with %K at 10.5 and %D at 16.36, both in the extreme oversold zone and indicating a potential for a bounce, but within the context of a dominant bearish trend.
Key Levels Under Fire
The most immediate concern for Dow Jones bulls is the price action around the $45,815.46 level. This price point, representing the close from last Friday, has become a battleground. The data shows that on the 1-hour timeframe, the trend is neutral with 50% strength, but the ADX at 32.46 still indicates a strong downtrend. The 4-hour chart paints a clearer picture: a strong downtrend (94% strength) with the ADX at 27.11. This suggests that while the price might find some temporary footing, the underlying trend is decidedly downward. The key support levels identified are $45,696.33 (S1), $45,524.67 (S2), and $45,343.33 (S3). A sustained break below $45,696.33 would be a significant bearish development, potentially triggering further panic selling and accelerating the descent towards lower targets.
Conversely, the resistance levels loom large. The first significant hurdle for any potential recovery is $46,049.33 (R1). This level, along with $46,230.67 (R2) and $46,402.33 (R3), represents a formidable barrier. For the bearish thesis to remain intact, the Dow Jones must stay below $46,049.33. A failure to hold this level, especially with convincing volume and bullish momentum, could signal a shift in sentiment. However, given the current technical indicators – particularly the strong ADX and negative MACD on multiple timeframes – the path of least resistance appears to be downwards. The oversold readings on RSI and Stochastic might suggest a short-term relief rally is possible, but without a clear catalyst or a significant shift in broader market sentiment, such rallies are likely to be met with selling pressure, offering opportunities for bears to re-enter or add to their positions.
Macroeconomic Clouds Gathering
The macroeconomic backdrop continues to present challenges for risk assets like the Dow Jones. While the provided data doesn't include specific forward-looking economic calendar events for the upcoming week, the general sentiment suggests caution. Central bank policy remains a key focus. The Federal Reserve's stance on interest rates, particularly in light of persistent inflation concerns (even if not explicitly detailed in the provided data, it's a known macro driver), will be paramount. If inflation proves stickier than anticipated, it could force the Fed to maintain a hawkish stance or even consider further tightening, which would be detrimental to equities. The market is always pricing in future expectations, and any hint of prolonged higher rates can dampen corporate earnings outlooks and increase the discount rate applied to future cash flows, thereby pressuring stock valuations.
The correlation between the Dow Jones and the US Dollar Index (DXY) is also a critical factor. With the DXY showing strength, currently at 99.25, it implies a demand for safe-haven assets or a repricing of interest rate differentials that favor the dollar. This dynamic often works against equities, especially those with significant international exposure. Furthermore, the energy market's volatility, exemplified by the sharp rise in Brent and WTI crude, adds another layer of complexity. Higher energy prices can translate into higher input costs for businesses across the board, potentially squeezing profit margins and impacting consumer spending, both of which are negative for the Dow Jones. The narrative around AI's energy demand, as hinted at in the breaking news, also underscores a growing concern about the sustainability of growth and the potential for energy supply constraints to become a more significant factor in the coming months.
The Verdict on the Bearish Case
Based on the technical indicators and the prevailing market conditions, the bearish case for the Dow Jones Industrial Average holds considerable weight. The strong downtrend signals on daily and 4-hour charts, evidenced by the high ADX values and negative MACD, suggest that the recent decline is more than just a temporary pullback. The oversold conditions present an opportunity for a short-term bounce, but without a fundamental shift or a clear break above key resistance levels, any such rally is likely to be capped. The S&P 500 and Nasdaq 100's correlated weakness, coupled with a rising DXY and volatile energy prices, paints a picture of a market environment where risk aversion is likely to persist. Until the Dow Jones can decisively reclaim the $46,049.33 resistance level, and ideally break above it with conviction, the path of least resistance remains to the downside, with support levels at $45,696.33 and potentially lower targets around $45,343.33 in play.
The Bullish Counter-Argument: Waiting for a Turnaround
Signs of Potential Capitulation and Oversold Conditions
Despite the prevailing bearish sentiment, a closer examination of the technicals reveals elements that could support a bullish turnaround for the Dow Jones Industrial Average ($DJI). The most striking observation is the RSI reading on the daily chart, which has fallen to 27.11. This level is firmly within oversold territory, historically a precursor to significant bounces or trend reversals. Similarly, the Stochastic Oscillator (%K at 10.5, %D at 16.36) is also deeply oversold. When these oscillators reach such extreme levels, it often indicates that the market has been oversold to the point where a reversal becomes increasingly probable, especially if buying pressure begins to emerge.
The 1-hour chart, while showing a neutral trend, does offer some hints of potential buying interest. The ADX on this timeframe is 32.46, which, while indicating a strong trend, is less extreme than the 41.79 seen on the daily chart. The MACD, although currently negative, often precedes a bullish signal by showing divergence before a crossover. If we see a bullish crossover on the MACD, coupled with a sustained move above the $45,815.46 closing price and then a break of the $46,049.33 resistance, it could signal the beginning of a recovery. The fact that the index is currently testing significant support at $45,815.46 and has bounced from lows around $45,367 on Friday also suggests that there are buyers stepping in at these lower price points, preventing a more severe collapse.
The Importance of Key Support Levels
The $45,815.46 closing price from last Friday is not just a number; it represents a psychological and technical pivot point. The fact that the Dow Jones is hovering around this level indicates its importance. Support levels at $45,696.33 (S1) and $45,524.67 (S2) are crucial. If these levels hold, and particularly if the index can bounce convincingly from them, it would invalidate the immediate bearish outlook. The bullish scenario hinges on the ability of buyers to defend these levels and push the price back above the $46,049.33 (R1) resistance. A strong close above R1, ideally accompanied by increasing volume and a shift in momentum indicators, would be the first concrete sign of a potential trend change.
Furthermore, the correlation with other markets can sometimes offer clues. While the DXY is currently strong, its movement is not always a perfect inverse indicator for equities, especially if the strength is driven by factors other than aggressive Fed tightening expectations. If the dollar's rise is seen as a temporary safe-haven play that eases, it could provide some relief to risk assets. Similarly, while oil prices are rising, the narrative around AI's energy demand could eventually lead to increased investment in energy production, potentially stabilizing prices or even leading to a moderation if supply catches up. A shift in risk sentiment, perhaps triggered by unexpected positive economic data or a de-escalation of geopolitical tensions (though none are explicitly mentioned in the provided news), could quickly change the market's complexion.
Potential Catalysts for a Rebound
Looking ahead, while specific economic data releases for the upcoming week are not detailed, market participants will be keenly watching for any signals from the Federal Reserve or other major central banks regarding their monetary policy stance. Any indication of a dovish pivot, or even a pause in anticipated rate hikes, could provide a significant boost to equities. Similarly, any positive developments on the geopolitical front or signs of stabilizing inflation could reduce the demand for safe-haven assets like the dollar, thereby supporting the Dow Jones. The breaking news regarding AI's impact on energy demand, while currently a source of concern, could also spur innovation and investment in new energy solutions, potentially alleviating long-term supply worries and offering a more optimistic outlook.
From a technical perspective, a confirmed bullish divergence on the MACD, coupled with RSI moving out of oversold territory and holding above 30, would be a strong signal. A break above the 1-hour resistance at $45,728.33 and then the more critical $46,049.33 (R1) would be the primary trigger for a bullish scenario. This would likely be accompanied by increasing volume, confirming that buyers are stepping in with conviction. If the index can manage to hold above these levels, it would set the stage for a potential move towards higher resistance targets. The fact that the Dow Jones is currently trading at $45,815.46, just above key support, means that a relatively small shift in sentiment or a successful defense of these levels could lead to a disproportionately large upward move, especially if short positions are squeezed.
The Verdict: Navigating the Crossroads
Weighing the Technicals and Fundamentals
The Dow Jones Industrial Average finds itself at a critical juncture, trading near $45,815.46 after a challenging week. The technical indicators present a mixed but predominantly bearish picture. On the daily chart, the RSI at 27.11 and Stochastic at extreme oversold levels scream 'potential bounce', but the ADX at 41.79 and negative MACD histogram paint a picture of a strong, ongoing downtrend. The 4-hour chart reinforces this, showing a strong downtrend with ADX 24.88, yet oversold oscillators. The immediate support at $45,696.33 (S1) is paramount. A failure to hold here would likely accelerate losses towards $45,343.33 (S3). Resistance at $46,049.33 (R1) is the key level for bulls to reclaim.
The broader market context does little to offer immediate comfort. A rising DXY to 99.25, falling S&P 500 (6536.67) and Nasdaq 100 (23986.8), and volatile energy prices create an environment where risk aversion is likely to persist. The narrative around AI's energy demand and potential inflationary pressures adds to the uncertainty. Central bank policy, especially the Fed's stance on rates, remains a significant overhang. Without clear signals of a dovish shift or a de-escalation in geopolitical risks, the path of least resistance for the Dow Jones appears to be downwards.
The Path Forward: Scenarios and Strategy
Given the current technical setup and market environment, a cautious approach is warranted. The probability of a bearish continuation seems higher in the short term due to the strong trend signals and macro headwinds. However, the oversold conditions cannot be ignored, suggesting that a bounce is plausible. This leads to three potential scenarios:
Bearish Continuation: Testing Lower Ground
65% ProbabilityConsolidation and Volatility: Trading the Range
25% ProbabilityBullish Reversal: Reclaiming Key Levels
10% ProbabilityTrading Strategy and Risk Management
For traders considering positions in the Dow Jones Industrial Average, risk management is paramount. Given the strong trend signals and the mixed technical picture, caution is advised. A bearish strategy could involve looking for opportunities to short on rallies towards resistance levels, particularly if they fail to break convincingly above $46,049.33. Entry triggers would be a close below $45,696.33 (S1), with targets at $45,524.67 and $45,343.33. Stop-loss orders should be placed above the immediate resistance, perhaps around $46,100, to limit downside risk.
For bulls, the strategy would be to wait for confirmation. A confirmed break and hold above $46,049.33 (R1) would be the primary entry signal, targeting $46,230.67 (R2) and $46,402.33 (R3). Stops should be placed below the breakout level, perhaps around $45,800, to protect against false breakouts. Given the current oversold conditions, a short-term bounce is possible, but it would require significant buying pressure to sustain. The neutral scenario involves range-bound trading, looking for buys near support ($45,696.33) and sells near resistance ($46,049.33), with tight stop-losses. The probabilities assigned reflect the current technical and fundamental environment, where bearish continuation appears most likely, but the possibility of a bounce due to oversold conditions cannot be entirely dismissed.
| Indicator | Value | Signal | Interpretation |
|---|---|---|---|
| RSI (14) | 27.11 | Oversold | Deep oversold territory, potential for bounce but trend is down. |
| MACD Histogram | -269.54 | Negative | Bearish momentum persists, below signal line. |
| Stochastic | K:10.5, D:16.36 | Oversold | Both lines in extreme oversold zone, indicating potential reversal or consolidation. |
| ADX | 41.79 | Strong Trend | Very strong downtrend confirmed, suggesting further downside is likely without a major shift. |
| Bollinger | Lower Band | Breakdown | Price is below the lower band, indicating extreme selling pressure. |
Frequently Asked Questions: DowJones30 Analysis
What happens if DowJones30 breaks below $45,696.33 support this week?
A break below $45,696.33 (S1) would invalidate any immediate bullish hopes and likely trigger further selling pressure. The next significant support level to watch would be $45,524.67 (S2), with a potential downside target towards $45,343.33 (S3) as the strong downtrend indicated by the ADX at 41.79 continues.
Should I buy DowJones30 at current levels around $45,815.46 given the oversold RSI?
While the RSI at 27.11 is oversold, it's not a direct buy signal in a strong downtrend. A cautious approach is recommended. Look for confirmation, such as a close above $46,049.33 (R1) or bullish MACD crossover, before considering a long position. The probability of a sustained bounce is currently low at 10% without clear catalysts.
Is the ADX at 41.79 a strong sell signal for DowJones30?
An ADX value of 41.79 on the daily chart indicates a very strong trend. In this context, it reinforces the bearish outlook, suggesting that the current downward move has significant momentum. While it doesn't explicitly signal a 'sell' on its own, it confirms that the market conditions are highly favorable for short positions or for staying out of the market until a clearer trend reversal signal emerges.
How will the DXY's strength at 99.25 affect the DowJones30's outlook this week?
The DXY's rise to 99.25 typically exerts downward pressure on risk assets like the DowJones30. This correlation suggests that a stronger dollar may continue to weigh on the index, especially if it reflects risk aversion or higher US interest rate expectations. Traders should monitor the DXY's trajectory alongside the Dow Jones, as a sustained dollar rally could hinder any attempts at a significant equity rebound.
Track markets in real-time
AI-powered analysis, technical indicators and real-time price data.
Join Our Telegram Channel
Breaking market news, AI analysis and trading signals instantly.
Join Channel