SP500 Weekly: Bears Grip at $6,536.67 - Next Week Outlook
SP500 struggles below $6,536.67 amid strong downtrend signals. Bears target $6,450.90, while bulls need a close above $6,572.10. Watch DXY and oil for clues.
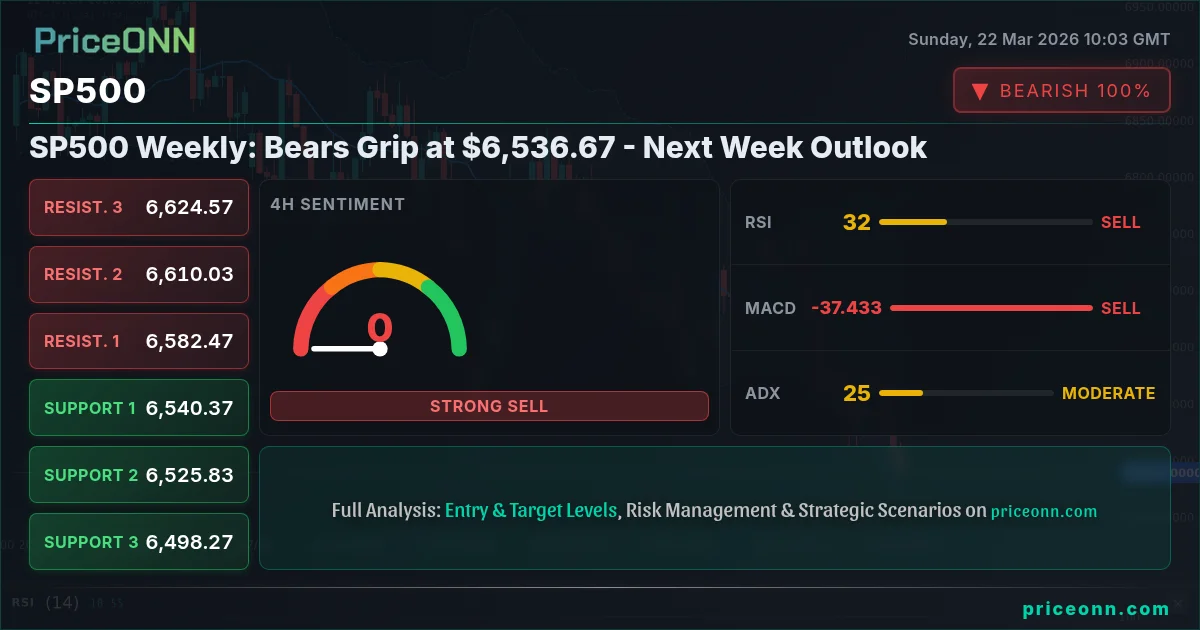
The S&P 500 index closed last Friday at a critical juncture, trading at $6,536.67, with bears firmly in control and a palpable sense of caution permeating market sentiment. Last week was defined by a significant downturn, with the index experiencing a sharp 1.2% decline, shedding $79.53 from its previous closing price and testing lows not seen in recent trading sessions. This downward pressure was not an isolated event but rather a symptom of broader market forces, including a strengthening US Dollar Index (DXY) and persistent concerns over inflation, which continue to weigh on risk appetite. The daily trading range for the SP500, from $6,473.20 to $6,633.00, underscored the volatility and the struggle for direction. As we look ahead to the upcoming trading week, the technical indicators and macroeconomic backdrop suggest that the bearish sentiment may persist, but key levels will dictate whether this is a short-term correction or the start of a deeper trend. Understanding the interplay between global indices, commodity prices, and currency movements is paramount for navigating this complex market environment.
- The SP500 closed at $6,536.67, down 1.2% for the week, with bears in control.
- Critical support sits at $6,450.90, tested multiple times this week, while resistance at $6,572.10 capped upside.
- RSI at 32.52 signals oversold conditions on the daily chart, but the ADX at 44.59 indicates a strong downward trend.
- The strengthening DXY at 99.25 and rising oil prices create a complex macro environment for equities.
The Dominance of Bearish Sentiment: Last Week's Price Action
Last week's trading on the S&P 500 was unequivocally dominated by sellers. The index's closing price of $6,536.67 marked a significant retreat from its weekly highs, reflecting a broad-based risk-off sentiment that gripped financial markets. The 1.2% daily loss, equating to $79.53, was not merely a statistical blip; it represented a decisive move below key short-term moving averages and signaled a potential shift in market momentum. On the 1-hour chart, the trend is clearly defined as downward with 94% strength, a testament to the immediate selling pressure observed. This was corroborated by the MACD histogram remaining negative and below its signal line, a classic bearish indicator suggesting that momentum is firmly with the sellers. The ADX on this timeframe, at 37.97, further reinforces this view, indicating a strong, established downtrend. For intraday traders, this environment was characterized by sharp sell-offs and limited, often fleeting, rallies, making it challenging to capture quick profits without significant risk. The failure to hold above the $6,572.10 resistance level on multiple occasions also served as a warning sign, highlighting the strength of the selling conviction at these higher price points.
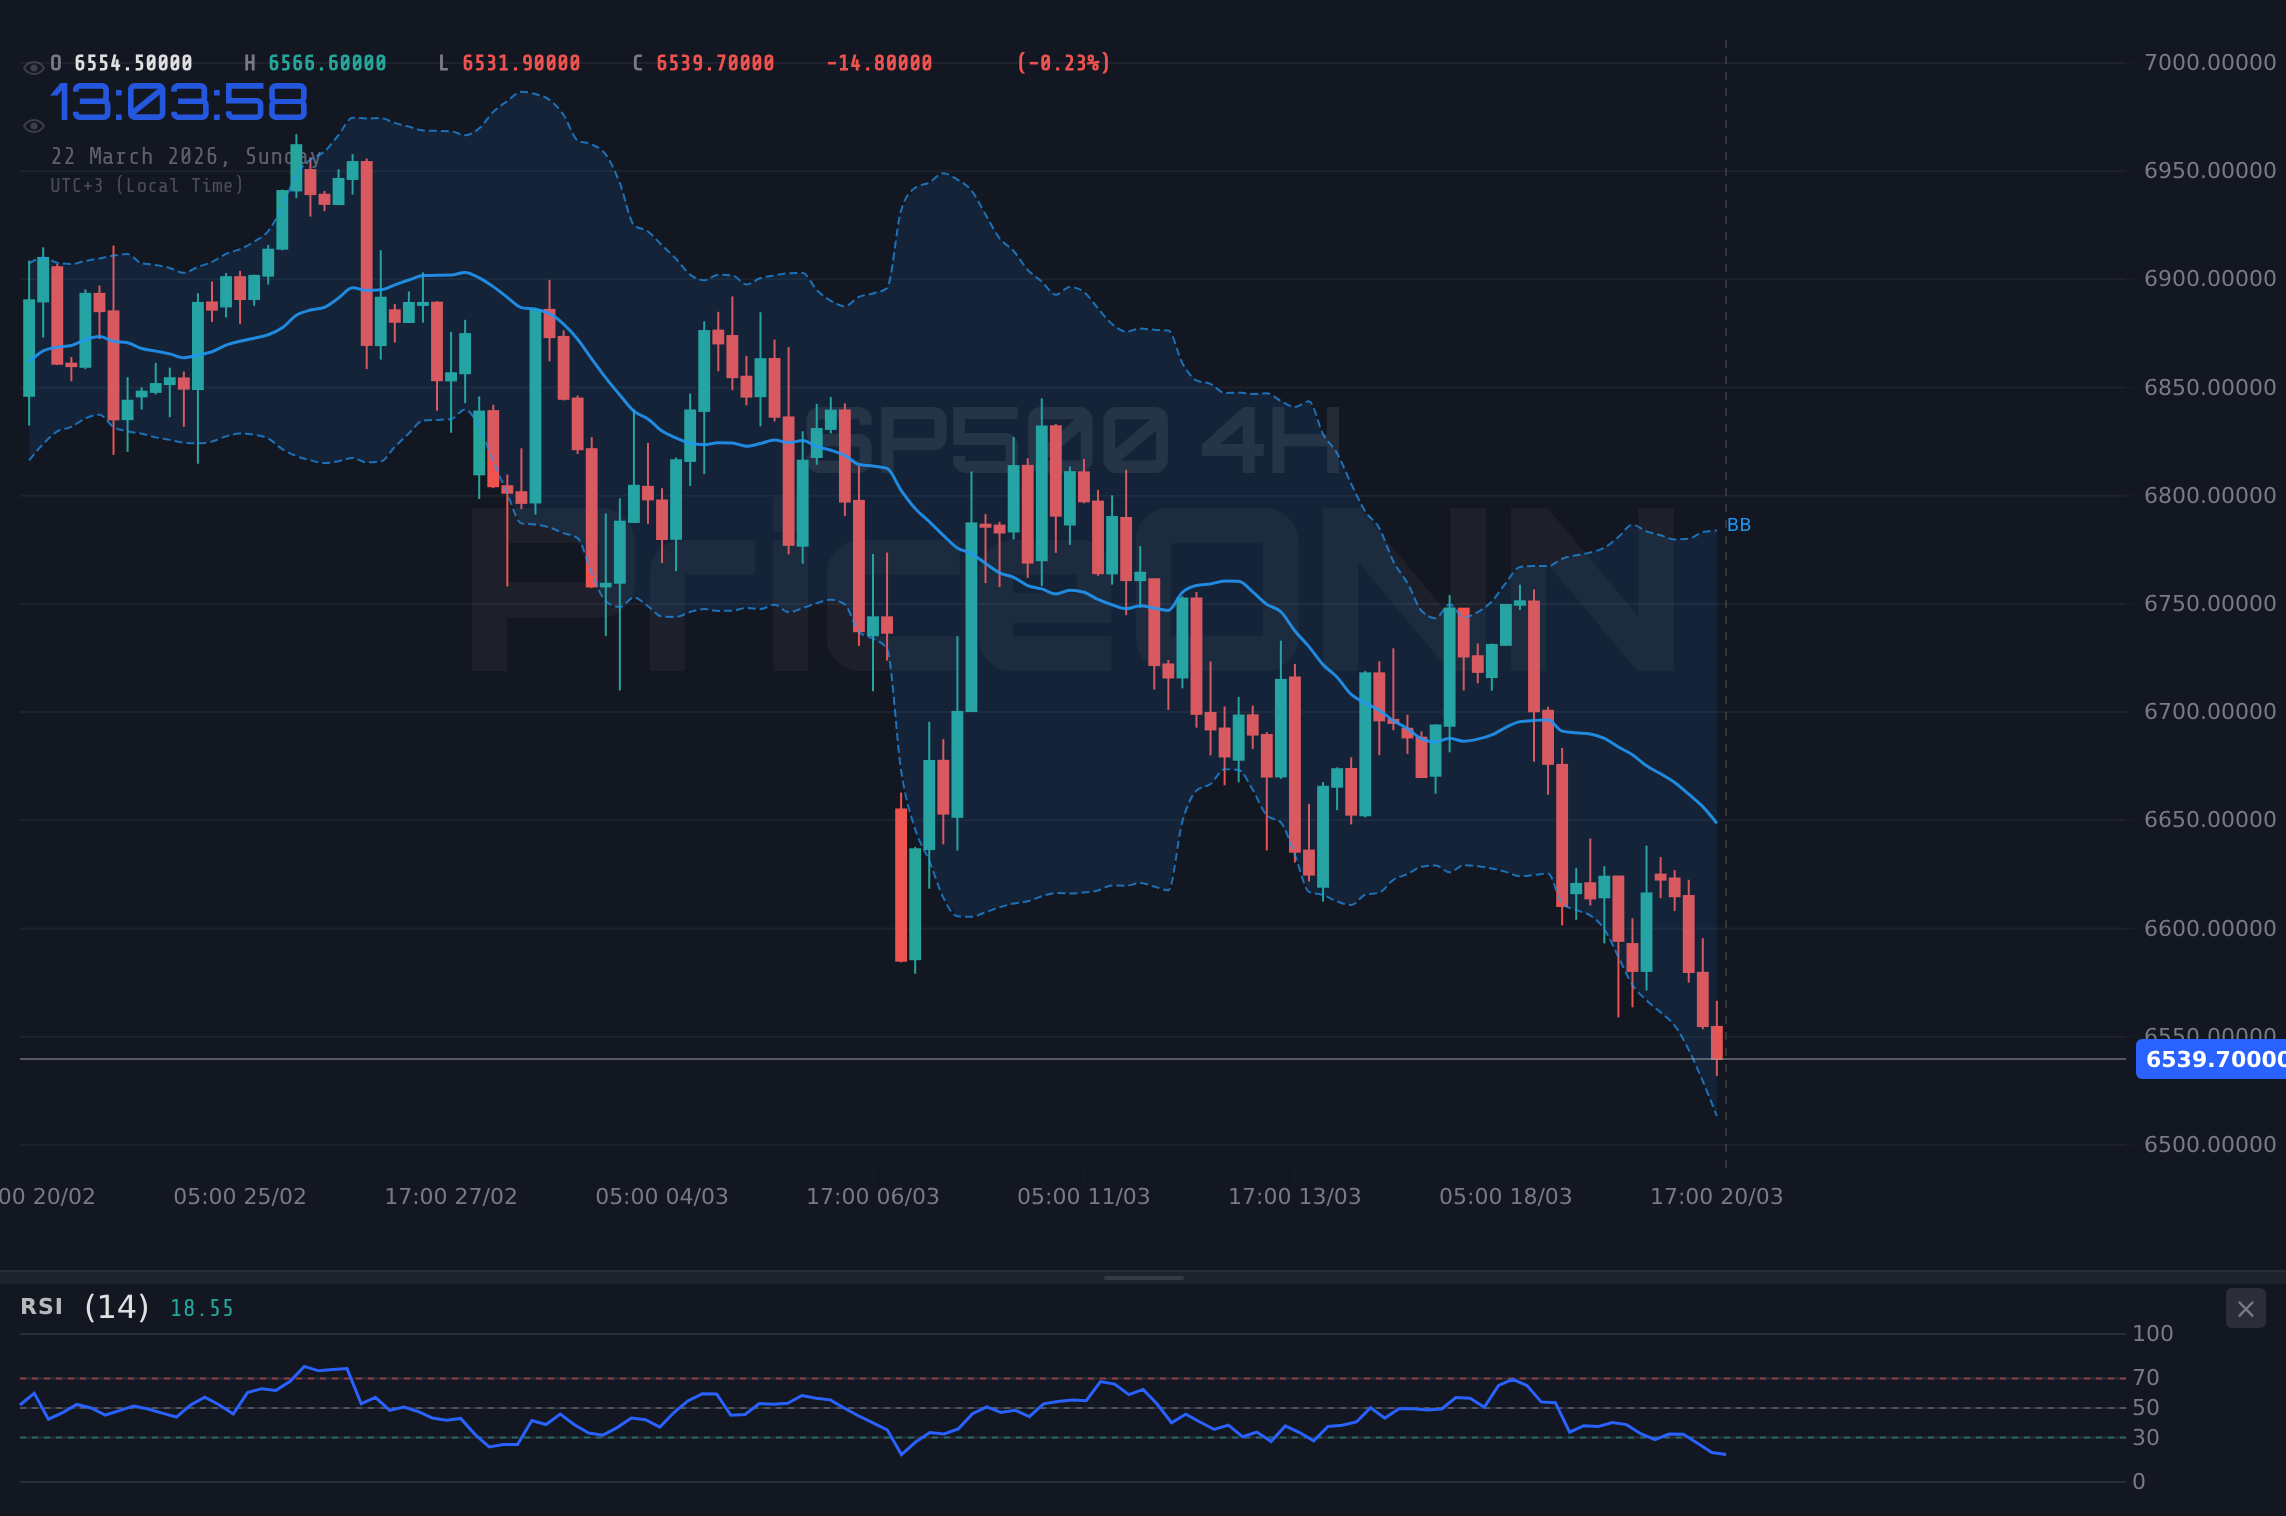
Delving deeper into the 4-hour timeframe, the bearish trend remains robust, with a 92% strength reading. The price action here showed the index struggling to break through the 50-period moving average, which often acts as a dynamic resistance level. The RSI(14) reading of 32.35, while approaching oversold territory, did not provide a strong enough signal to deter the sellers, especially when viewed in conjunction with other indicators. The Stochastic Oscillator, with %K at 10.52 and %D at 26.57, clearly indicated an oversold condition but also confirmed the bearish momentum as %K remained below %D, suggesting further downside potential before any significant bounce. The ADX at 24.88 points to a moderately strong trend, enough to suggest that the bearish momentum is not just a fleeting event but has some staying power. This timeframe is crucial for swing traders looking to capture moves over a few days, and the data clearly pointed towards caution and short-selling opportunities rather than long positions. The failure to find footing above the $6,540.37 support level was a key bearish signal on this chart, indicating that previous support had become new resistance.
On the daily chart, the picture becomes even more stark. The trend is unequivocally bearish, with 100% strength. The closing price of $6,536.67 sits precariously close to the lower Bollinger Band, a sign of extreme selling pressure and potential for a short-term oversold bounce, but the overall trend remains down. The RSI(14) at 32.52 is deep in oversold territory, a level historically associated with significant buying opportunities. However, the MACD continues to print negative histogram values, indicating sustained selling momentum, and remains below its signal line. The ADX value of 44.59 is particularly noteworthy; readings above 40 signify a very strong trend, and in this case, it's a strong downtrend. This suggests that any counter-trend rallies are likely to be short-lived and met with renewed selling pressure. For long-term investors, this daily chart presents a dilemma: the oversold RSI suggests a potential buying opportunity, but the strong ADX and negative MACD warn against catching a falling knife. The key support level to watch on this timeframe is $6,486.83, a break below which could signal a much deeper correction.
Bearish Scenario: The Path of Continued Decline
65% ProbabilityNeutral Scenario: Range-Bound Consolidation
25% ProbabilityBullish Scenario: A Resilient Rebound
10% ProbabilityIntermarket Correlations: The Dollar's Shadow and Oil's Fury
The performance of the S&P 500 cannot be viewed in isolation. Last week, its decline was significantly influenced by, and in turn influenced, other key markets. The US Dollar Index (DXY) played a pivotal role. Closing at 99.25, up 0.35% for the week, the dollar exhibited strength that typically correlates inversely with major equity indices, especially those priced in the greenback. On the 1-hour chart, the DXY showed a downtrend with 91% strength, but its daily chart trend is decisively upward (92% strength), with RSI at 57.21 and ADX at 34.64. This suggests that while there might be short-term fluctuations, the underlying strength of the dollar is a headwind for US equities. A stronger dollar makes US exports more expensive and can reduce the repatriated earnings of multinational corporations, both factors that can dampen investor enthusiasm for stocks. The $99.43 resistance level on the DXY is a key point to watch; a break above it could signal further pressure on the SP500.
Simultaneously, the energy complex, particularly WTI crude oil, presented a mixed but ultimately supportive signal for inflation concerns, which indirectly impacts equities. WTI closed the week sharply higher at $98.39, a gain of 3.76% ($3.56), indicating strong demand or supply-side disruptions. The daily chart shows a powerful uptrend (100% strength) with RSI at 70.58, bordering on overbought conditions, and a very strong ADX of 59.27. This surge in oil prices, driven by geopolitical tensions and robust demand, fuels inflation expectations. Higher energy costs translate into higher input costs for businesses across the board, potentially squeezing profit margins and leading to higher consumer prices. While energy stocks might benefit, the broader market often suffers from the inflationary pressure and the potential for central banks to respond with more aggressive monetary tightening. The correlation here is clear: rising oil prices and a strong dollar often create a challenging environment for stock markets like the SP500, especially when inflation is already a concern.
The performance of other major indices also provides crucial context. The Nasdaq 100, heavily weighted towards technology stocks, saw a steeper decline than the SP500, falling 1.67% to close at 23,986.80. This suggests that growth-oriented sectors are particularly vulnerable to the current risk-off sentiment and rising interest rate expectations. The Dow Jones Industrial Average, while also down 0.58% to $45,815.46, showed slightly more resilience, a common occurrence in risk-off environments where more established, dividend-paying companies can sometimes offer a relative safe haven compared to high-growth tech stocks. The fact that both the Nasdaq and Dow Jones are exhibiting strong bearish trends on their daily charts (100% and 98% strength respectively) paints a grim picture for the broader stock market. The SP500's correlated move downwards, therefore, is not surprising but rather a confirmation of a systemic risk aversion. The correlation analysis highlights that any sustained recovery in the SP500 would likely require a simultaneous weakening of the dollar, a cooling of oil prices, and a stabilization or recovery in the tech-heavy Nasdaq.
The confluence of a strong US Dollar, rising oil prices, and deeply oversold equity markets presents a complex risk landscape. Geopolitical tensions in energy markets, coupled with uncertain central bank policy, could lead to sharp, unexpected moves. Traders should exercise extreme caution and manage risk tightly, especially around key economic data releases and the upcoming week's trading sessions.
The Technical Battleground: Levels to Watch This Week
From a purely technical standpoint, the SP500's chart presents a battleground where key support levels are being tested under immense selling pressure, while resistance levels are proving formidable barriers to any potential recovery. On the 1-hour chart, the immediate support is identified at $6,491.30, followed by $6,476.40 and then $6,450.90. These are the levels that intraday traders and scalpers will be closely monitoring for potential bounces or breakdowns. The resistance on this timeframe is capped at $6,531.70, $6,557.20, and $6,572.10. The fact that the index failed to decisively break above $6,572.10 last week is a significant bearish signal for short-term traders, suggesting that this level will act as a ceiling in the immediate future. A failure to hold $6,491.30 could trigger a rapid move towards $6,476.40 and potentially the more critical $6,450.90 level.
Moving to the 4-hour chart, the support levels become more significant for swing traders. Key levels are $6,540.37, $6,525.83, and $6,498.27. The struggle around $6,540.37 is particularly important, as its failure to hold suggests it has transitioned from support to resistance. If the bearish momentum continues, a break below $6,525.83 could accelerate the decline towards $6,498.27. On the resistance side, $6,582.47, $6,610.03, and $6,624.57 are the hurdles that bulls must overcome to even consider a trend reversal. The proximity of the current price to these support levels means that risk management is paramount. For swing traders, a break below $6,525.83 might signal an opportunity to enter short positions targeting $6,498.27, with a stop loss placed just above the new resistance at $6,540.37. Conversely, a strong bounce off $6,540.37, confirmed by increased volume and a break above $6,582.47, could signal a short-term long opportunity.
The daily chart provides the long-term perspective, and the levels here are crucial for investors. The primary support is established at $6,569.53, followed by $6,522.87 and $6,486.83. The failure to hold $6,569.53 is a bearish indicator, and a decisive break below $6,522.87 would likely confirm the continuation of the downtrend, potentially targeting the significant psychological level around $6,500 and then the more substantial support at $6,486.83. On the upside, resistance is formidable, starting at $6,652.23, then $6,688.27, and a major hurdle at $6,734.93. For investors, the current price action around $6,536.67 presents a challenging environment. While the oversold RSI(14) at 32.52 might tempt some to buy, the strong daily ADX of 44.59 and the negative MACD signal a high-risk entry. A more prudent approach for investors might be to wait for confirmation: either a decisive break above the $6,652.23 resistance, suggesting a bottom is in, or a further decline testing the $6,486.83 support, which could offer a better risk-reward ratio for long positions if other indicators begin to align positively.
Navigating the Treacherous Waters: Strategies for Different Trader Types
The current market environment, characterized by strong bearish trends on multiple timeframes and conflicting signals from indicators like the RSI, demands tailored strategies for different types of market participants. For the scalper, operating on the 1-hour chart, the focus is on capturing small, quick profits from intraday volatility. The key is to identify immediate support and resistance levels and trade the bounces or breakdowns. For instance, a scalper might look to short the SP500 if it fails to break above the intraday resistance at $6,531.70, targeting the $6,491.30 support. Conversely, a quick scalp long could be initiated if price bounces strongly off $6,491.30, targeting $6,531.70. Strict risk management is essential, with tight stop-losses just beyond the immediate support or resistance levels. The high ADX on the 1-hour chart (37.97) means trends can be sharp, so quick entries and exits are crucial. The Stochastic Oscillator, moving from oversold territory on this timeframe, might offer short-term buy signals, but these must be treated with extreme caution given the dominant bearish trend.
Swing traders, who typically hold positions for a few days to a couple of weeks, will be looking at the 4-hour and daily charts. The 4-hour chart shows strong bearish momentum with an ADX of 24.88 and the MACD below its signal line. The key levels to watch here are the $6,540.37 support and the $6,582.47 resistance. A swing trader might consider a short position if price breaks decisively below $6,540.37, aiming for the $6,498.27 support, with a stop-loss above $6,582.47. Alternatively, if price shows signs of consolidating and holding above $6,540.37, a swing trader might look for a bounce towards $6,582.47, but this would be a counter-trend trade and thus riskier. The daily chart's oversold RSI at 32.35 presents a potential turning point, but the strong ADX at 44.59 suggests that betting on a reversal is currently premature. Patience is key; waiting for a clear break of either the key daily support at $6,486.83 or the resistance at $6,652.23 would provide a more defined setup.
For long-term investors, the situation is more nuanced. The daily chart’s oversold RSI might be tempting, but the overwhelming bearish trend strength (ADX 44.59) and negative MACD are strong deterrents. History suggests that while oversold conditions can precede a rebound, a strong trend like this can persist, leading to further significant drawdowns. For example, during the market downturns of 2022, RSI readings below 30 often persisted for weeks, accompanied by strong ADX values, before a sustainable bottom was formed. Investors might consider a phased approach: perhaps initiating small long positions or scaling into the market if the SP500 can decisively break and hold above the $6,652.23 resistance level, confirming a potential trend change. Alternatively, waiting for a deeper pullback towards the $6,486.83 support, or even lower if the macro environment deteriorates further, could offer a more attractive entry point with a better long-term risk-reward profile. The current price action does not scream 'buy the dip' without significant caveats; it rather signals 'caution and wait for confirmation'.
The Macroeconomic Crosscurrents: Inflation, Rates, and Geopolitics
The persistent strength of the US Dollar (DXY at 99.25 and rising) is a significant factor influencing the SP500's trajectory. The dollar's upward trend on the daily chart (ADX 34.64) is supported by its RSI of 57.21, indicating healthy momentum. This strength often stems from expectations of tighter monetary policy or a 'safe haven' appeal during times of global uncertainty. If the Federal Reserve signals a more hawkish stance, perhaps due to persistent inflation, the dollar could strengthen further, applying additional pressure on US equities. The market is constantly pricing in Fed actions, and any deviation from expected rate cuts or hikes can cause significant market volatility. Currently, the CME FedWatch tool (if available, otherwise general market expectations) would be a key reference for understanding these rate expectations. A stronger dollar can also impact corporate earnings, as US companies with significant overseas operations see their foreign profits translate into fewer dollars.
Inflation remains a central theme, with rising oil prices serving as a potent reminder. WTI crude oil's surge to $98.39, with a daily RSI of 70.58 and a powerful ADX of 59.27, highlights ongoing supply-side concerns, potentially exacerbated by geopolitical instability. The recent news about an attack on Qatar's Ras Laffan energy hub, as reported by energy news outlets, underscores the fragility of the global energy market and could be a catalyst for further oil price appreciation. Higher energy costs directly impact consumer spending power and corporate costs, creating a stagflationary environment that is detrimental to equity markets. This inflationary pressure complicates the Federal Reserve's policy decisions; they face a dilemma between controlling inflation and supporting economic growth. The market's reaction to upcoming inflation data (CPI, PCE) will be critical in shaping expectations for future Fed actions and, consequently, the direction of the SP500.
Geopolitical risks also loom large. While not explicitly detailed in the provided data, general knowledge of global tensions (e.g., ongoing conflicts, trade disputes) contributes to market uncertainty and can trigger 'risk-off' sentiment, benefiting safe-haven assets like the dollar and gold (though gold is currently in a strong downtrend at $4,501.45, RSI 29.67, ADX 19.51, suggesting its safe-haven appeal is temporarily subdued). The interplay between these global events and domestic economic factors creates a complex web of influences on the SP500. For instance, a sudden escalation in geopolitical tensions could lead to a flight to safety, bolstering the dollar and potentially accelerating the sell-off in equities as investors de-risk their portfolios. Conversely, a de-escalation could boost risk appetite, potentially leading to a recovery in the SP500, although this would likely need to be supported by improved economic data or a less hawkish central bank stance.
As the dust settles on a tumultuous week, the SP500 stands at $6,536.67, firmly entrenched in a bearish trend. The confluence of a strong dollar, rising oil prices, and aggressive selling pressure across major indices paints a challenging picture for the immediate future. While the daily RSI is deeply oversold, signaling potential for a short-term bounce, the powerful ADX and negative MACD on multiple timeframes suggest that bears are likely to remain in command. The key levels to watch are the $6,486.83 support and the $6,652.23 resistance. A break below the former could signal a deeper correction, while a decisive move above the latter might indicate the start of a sustained recovery. For now, caution is the prevailing sentiment, and traders and investors alike must remain vigilant, focusing on risk management and waiting for clear technical or fundamental catalysts before committing to significant positions. The path forward is fraught with uncertainty, but understanding these key levels and correlations provides a roadmap for navigating the potential volatility ahead.
Frequently Asked Questions: SP500 Analysis
What happens if SP500 breaks below the critical support level of $6,486.83?
A break below $6,486.83 on the SP500 would likely confirm the continuation of the strong daily downtrend (ADX 44.59). This could trigger further selling pressure, potentially targeting the $6,450.90 level as the next significant support, with a possibility of retesting psychological levels around $6,300 if the bearish momentum intenshens.
Should I consider buying SP500 at current levels around $6,536.67 given the oversold RSI?
Buying at $6,536.67 is high-risk despite the daily RSI at 32.52. The strong bearish trend (ADX 44.59) and negative MACD suggest rallies are likely to be sold. A more prudent approach would be to wait for confirmation, such as a close above $6,652.23 resistance, or a deeper pullback to $6,486.83 support for a potentially better risk-reward entry.
Is the current ADX reading of 44.59 on the SP500 daily chart a strong sell signal?
An ADX of 44.59 on the SP500 daily chart indicates a very strong trend, and given the overall price action and other indicators, this signifies a strong downtrend. While not a direct 'sell' signal itself, it strongly suggests that the prevailing downward momentum is powerful and likely to continue, making short-term counter-trend trades highly risky.
How will the strengthening DXY at 99.25 impact SP500 next week?
The strengthening DXY, with its daily uptrend confirmed by an ADX of 34.64, generally exerts downward pressure on US equities like the SP500. This inverse correlation means further dollar strength could lead to additional declines in the SP500, especially if key support levels like $6,486.83 fail to hold.
| Indicator | Value | Signal | Interpretation |
|---|---|---|---|
| RSI (14) | 32.52 | Oversold | Potential for bounce, but trend still favors sellers |
| MACD Histogram | -1.2 | Negative Momentum | Sustained selling pressure |
| Stochastic | K:16.28, D:27.82 | Oversold | Momentum favors downside |
| ADX | 44.59 | Strong Trend | Confirms powerful downtrend |
| Bollinger Bands | Lower Band Break | Bearish Breakout | Extreme selling pressure |
Track markets in real-time
AI-powered analysis, technical indicators and real-time price data.
Join Our Telegram Channel
Breaking market news, AI analysis and trading signals instantly.
Join Channel