XAGUSD Slides to $68.00: A Deep Dive into the Bearish Momentum
Silver's sharp descent to $68.00 continues as strong downtrend signals emerge. Analyzing key levels and macro forces driving the slide.
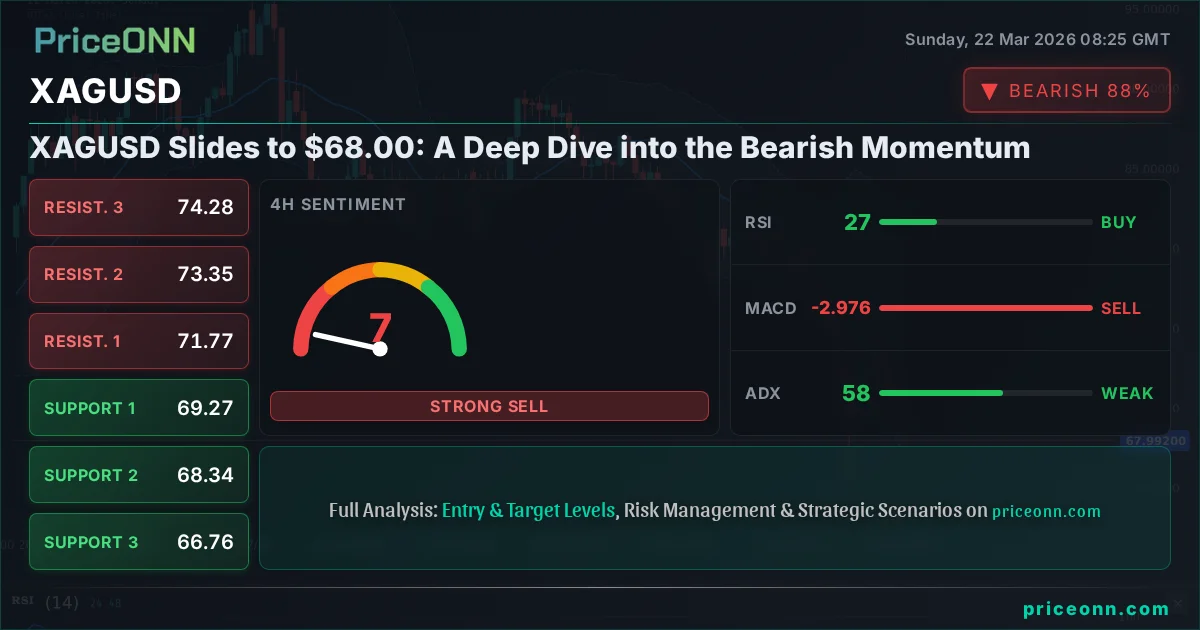
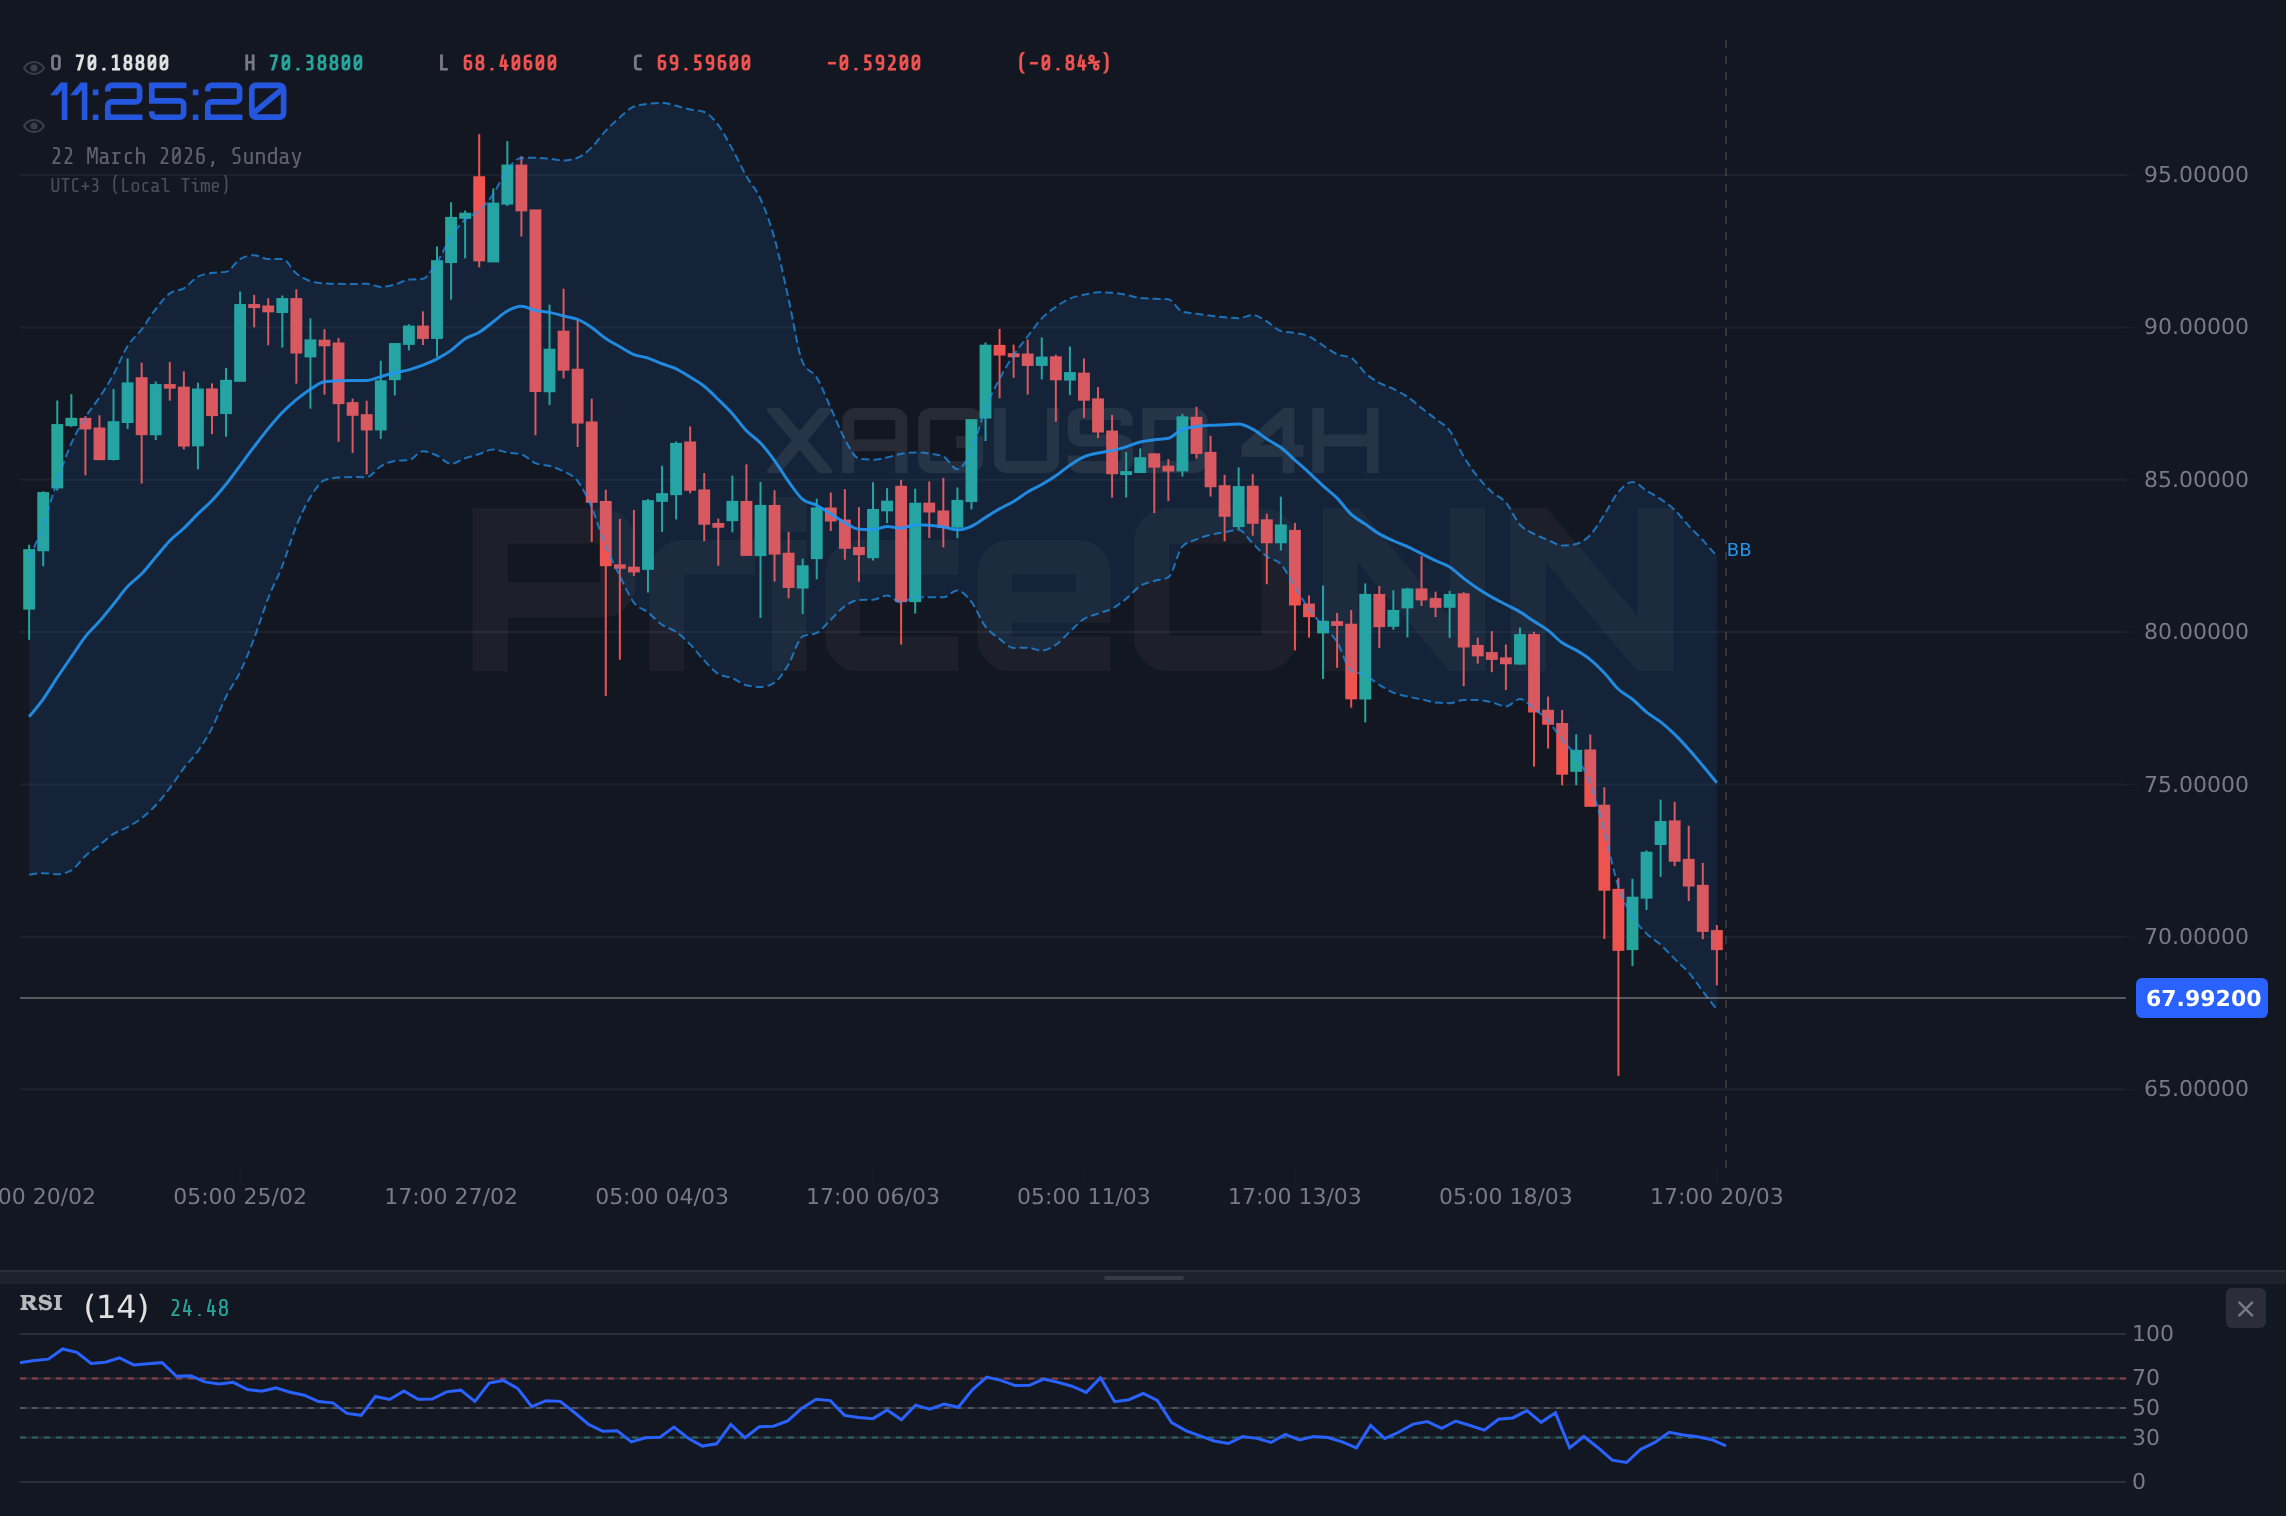
The precious metals market has witnessed a significant downturn, with silver, or XAGUSD, leading the charge in its bearish trajectory. Last Friday, the price of silver plummeted, settling near the critical $68.00 mark. This sharp decline, representing a substantial 6.55% drop from its recent highs, underscores a market grappling with strong bearish momentum. The question on every trader's mind is whether this slide is merely a pause before a recovery or the harbinger of further significant losses. This analysis dives deep into the technical and fundamental factors driving XAGUSD's current predicament, exploring the intermarket dynamics and potential outlook for the coming weeks.
- The RSI at 30.79 on the 1H chart signals oversold territory, but the ADX at 36.09 indicates a strong downtrend is still in play on the 4H.
- Critical support sits at $67.33, a level that, if broken decisively, could open the door for a move towards $65.40.
- The MACD histogram shows negative momentum across multiple timeframes, confirming the bearish pressure on XAGUSD.
- The strengthening US Dollar Index (DXY) at 99.25 is a significant macroeconomic driver exerting downward pressure on silver prices.
Macroeconomic Currents Driving Silver's Descent
The global economic landscape is currently characterized by a confluence of factors that are collectively weighing on silver prices. The US Dollar Index (DXY), a key barometer of the dollar's strength against a basket of major currencies, has seen a notable uptick, currently trading around 99.25. Historically, a stronger dollar tends to put pressure on commodities priced in USD, including silver, as they become more expensive for holders of other currencies. This inverse relationship is a fundamental driver that cannot be ignored when assessing the bearish slide in XAGUSD. As the DXY shows a resurgence, particularly on the daily timeframe where it exhibits a strong 92% bullish trend, the headwinds for silver intensify.
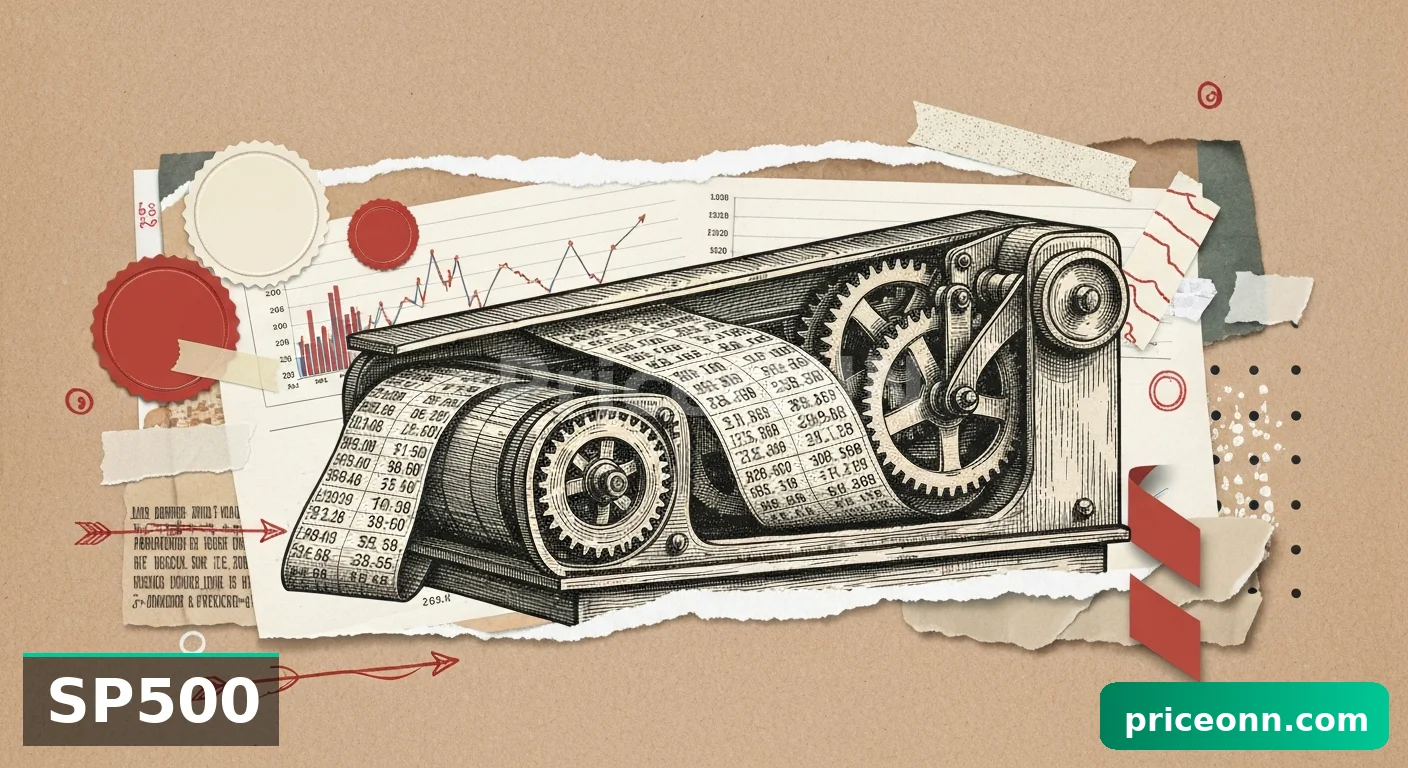
Furthermore, the broader risk sentiment in the markets plays a crucial role. Major equity indices like the S&P 500 and Nasdaq have experienced significant pullbacks, with the S&P 500 down 1.2% and the Nasdaq shedding 1.67% on Friday. This risk-off sentiment typically sees investors flocking to perceived safe-haven assets. While gold often benefits from such sentiment, the current environment appears different. The sharp decline in silver, which often exhibits higher volatility than gold, suggests that broader deleveraging or a flight to cash might be overshadowing traditional safe-haven demand for precious metals. This dynamic is particularly concerning for silver bulls, as it indicates that even during periods of market stress, silver is not necessarily the preferred safe haven.
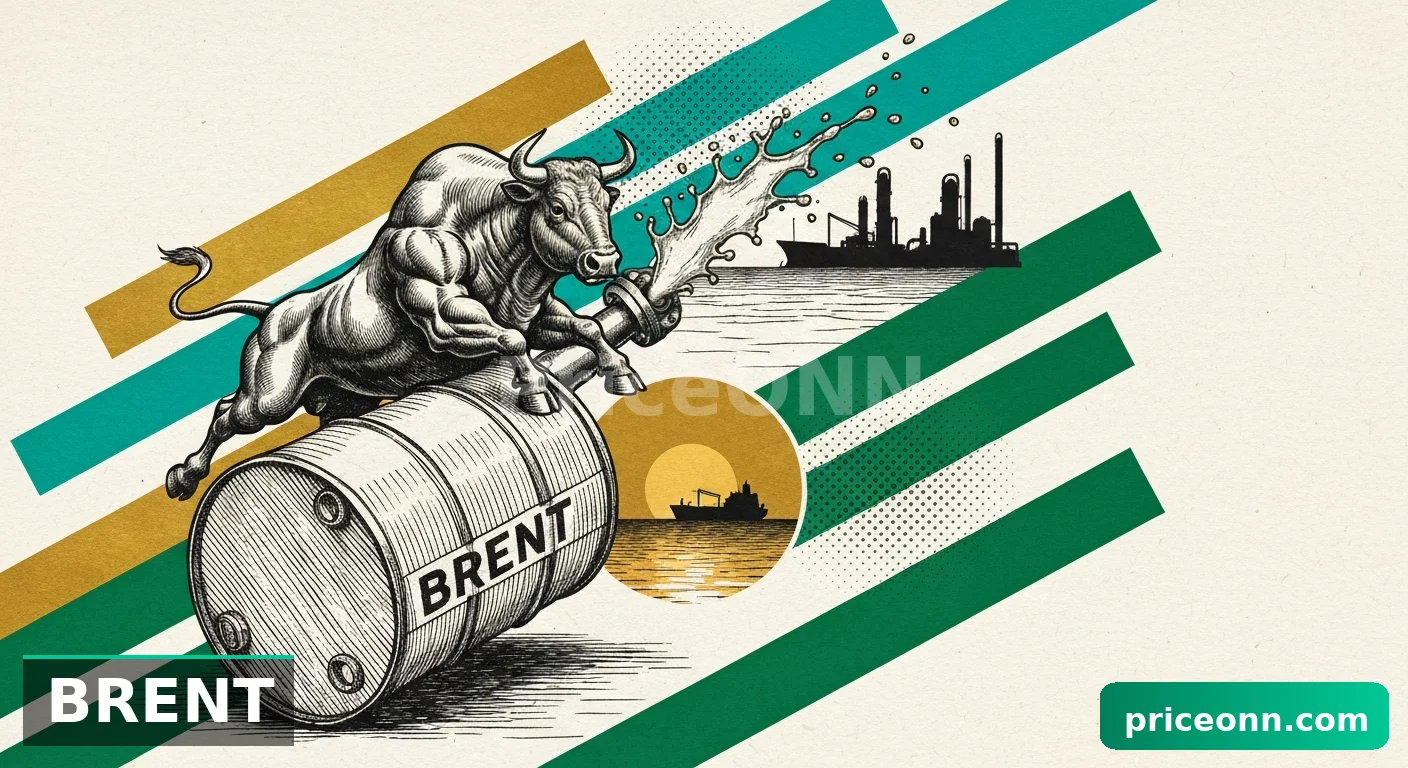
Geopolitical tensions, while often a catalyst for precious metal rallies, have not provided a substantial tailwind for silver recently. While news surrounding the Ras Laffan energy hub attack and discussions around AI's impact on energy demand highlight ongoing global instability, the immediate effect on silver has been muted. The narrative around energy markets, particularly with Brent Crude and WTI showing strong upward momentum, typically fuels inflation concerns, which in turn can be supportive of gold and silver. However, the current price action in XAGUSD suggests that other, more potent, bearish forces are at play, potentially overshadowing any inflation hedge narrative.
The interplay between interest rates and commodity prices is another critical piece of the puzzle. While the provided data doesn't include specific interest rate figures, the general expectation of monetary policy actions by major central banks continues to shape market sentiment. If central banks are perceived to be leaning towards tighter monetary policy or maintaining higher rates for longer, this can increase the opportunity cost of holding non-yielding assets like silver, thereby suppressing its price. The market's interpretation of Fed communications and economic data releases will be crucial in shaping this aspect of the narrative moving forward.
Technical Breakdown: Charting the Bearish Path
The technical landscape for XAGUSD paints a decidedly bearish picture, particularly when examining the shorter timeframes. On the 1-hour chart, the trend is firmly established as bearish with a strength of 98%, supported by a confluence of indicators. The Relative Strength Index (RSI) at 30.79, while bordering on oversold, has not yet triggered a significant bullish reversal. Crucially, the Moving Average Convergence Divergence (MACD) indicator is showing negative momentum, with the MACD line firmly below its signal line. Furthermore, the Bollinger Bands are exhibiting a bearish breakdown, with the price trading below the lower band, a pattern often preceding further downside.
Zooming out to the 4-hour timeframe, the bearish trend becomes even more pronounced, with a 100% trend strength. The RSI here is even lower, at 27.35, suggesting extreme oversold conditions. However, the Average Directional Index (ADX) at a formidable 62.89 confirms a very strong downtrend, indicating that current oversold conditions may not immediately translate into a meaningful bounce. The Stochastic Oscillator, with K at 41.73 and D at 50.8, further reinforces the bearish sentiment, showing a clear bearish crossover. The overall signal across these shorter timeframes is overwhelmingly 'SELL', with only one 'BUY' signal across all indicators on the 1H chart, highlighting the prevailing bearish sentiment.
The daily chart presents a slightly more nuanced, yet still predominantly bearish, view. The trend is classified as bearish with 90% strength. The RSI at 29.67 is deep in oversold territory, suggesting that a potential technical bounce is overdue. However, the ADX at 19.51 indicates a relatively weak trend on this timeframe, hinting at potential consolidation or sideways movement if a strong catalyst for reversal does not emerge. The MACD remains bearish, and the Stochastic Oscillator shows %K (8.67) below %D (13.12), reinforcing the oversold condition. Despite the daily oversold readings, the persistent strength of the downtrend on shorter timeframes suggests that any rallies might be short-lived, offering little respite for the bulls.
The key support levels to watch on the 1-hour chart are $67.33, $66.59, and $65.40. A decisive break below $67.33 would be a significant bearish signal, potentially accelerating the decline towards the subsequent levels. On the resistance side, immediate hurdles are seen at $69.26, $70.45, and $71.18. For any bullish sentiment to even begin to take hold, XAGUSD would need to convincingly break and hold above these resistance points, particularly the $71.18 level, which would then target higher levels.
Intermarket Correlations: What Other Markets Are Saying
The performance of other key markets provides crucial context for silver's current predicament. The strong upward trend in the US Dollar Index (DXY) is a dominant factor. As noted, the DXY's daily chart shows a robust 92% trend strength, currently trading at 99.25. This strengthening dollar directly correlates with a weaker XAGUSD, as seen in the data. When the DXY moves higher, it typically exerts downward pressure on dollar-denominated commodities.
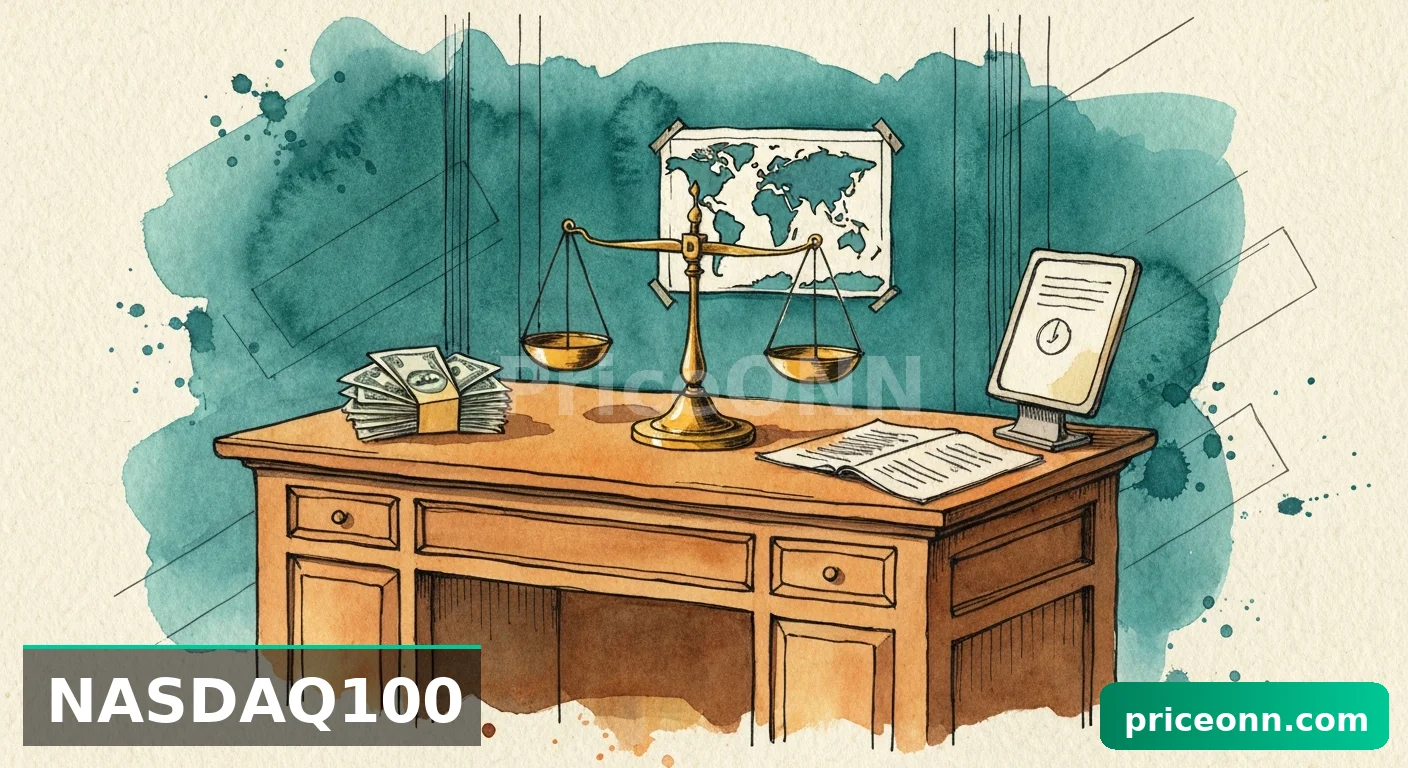
Equities, often seen as a proxy for risk appetite, are also painting a bearish picture. The S&P 500, trading at 6536.67, is down 1.2% for the day, with a strong 94% bearish trend on the 1-hour chart. The Nasdaq 100, at 23986.8, is down 1.67%, also showing a strong bearish trend. This risk-off environment is generally negative for industrial commodities and can impact silver's industrial demand component. While safe-haven assets like gold might benefit, the current broad market sell-off suggests a flight to safety in cash or highly liquid government bonds rather than precious metals.
Energy markets, particularly Brent Crude and WTI, are showing significant strength. Brent is up 4.58% at $112.54, and WTI has gained 3.76% to trade at $98.39. This surge in oil prices, driven by geopolitical events and potential supply disruptions, usually fuels inflation expectations. Higher inflation can be a bullish factor for gold and, by extension, silver, as they are often seen as inflation hedges. However, the current disconnect between rising oil prices and falling silver prices is noteworthy. It suggests that the bearish technicals and the strong dollar are currently overriding any potential inflation-hedging demand for silver. This divergence warrants close monitoring, as a sustained rise in oil prices without a corresponding boost in silver could signal underlying weakness in the commodity complex or a specific bearish catalyst for silver.
Cryptocurrencies, particularly Bitcoin (BTCUSD) and Ethereum (ETHUSD), are also experiencing significant downturns. BTCUSD is down 2.19% at $68,809, and ETHUSD has fallen 3.15% to $2,083.39. Both are showing predominantly bearish signals on shorter timeframes. Historically, cryptocurrencies have been viewed by some as a digital alternative to gold, and their price action can sometimes correlate with precious metals. The current parallel decline suggests a broader risk-asset sell-off affecting multiple asset classes, reinforcing the idea that investors are moving away from riskier assets in favor of safer havens like cash or potentially strengthening currencies.
Fundamental Drivers: Beyond the Charts
While technical indicators provide a clear signal of the current bearish trend, understanding the underlying fundamental drivers is crucial for a comprehensive outlook. The persistent strength of the US dollar is a primary concern. As the DXY continues its upward trajectory, supported by a strong 92% daily trend, it creates a challenging environment for dollar-denominated commodities. If the Federal Reserve maintains a hawkish stance, or if economic data from the US continues to outperform expectations, the dollar could remain firm, acting as a persistent headwind for silver.
The industrial demand component for silver also warrants attention. Silver is not just a precious metal; it's a vital industrial commodity used in electronics, solar panels, and automotive manufacturing. A slowdown in global economic growth, or a contraction in manufacturing output, could dampen demand for silver from these sectors. The current risk-off sentiment and the weakness in equity markets might be precursors to a broader economic slowdown, which would negatively impact industrial demand for silver. This is a key factor to watch as economic indicators for the coming months unfold.
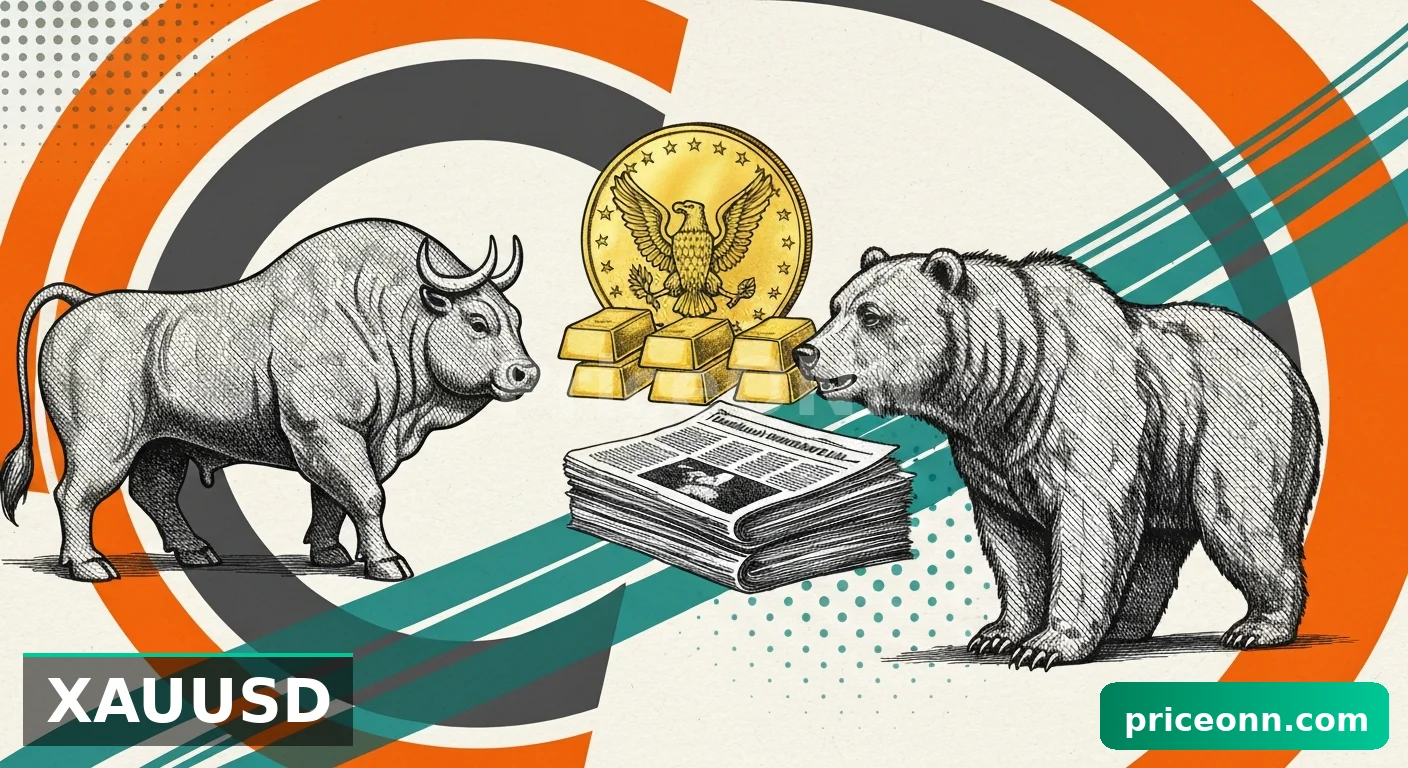
Central bank buying of gold has been robust, with record purchases in recent years. While this has provided a floor for gold prices, the extent to which central banks are accumulating silver is less transparent. However, any significant central bank interest in silver could provide a substantial fundamental support. Currently, there is no strong indication of a major shift in central bank silver holdings that would counteract the prevailing bearish technicals and dollar strength.
The supply side of the silver market also plays a role. Mine production and silver recycling are the primary sources. Any disruptions to mining operations, whether due to geopolitical issues, labor strikes, or environmental concerns, could theoretically tighten supply and support prices. However, the current market data does not suggest any immediate supply shocks that would offset the strong bearish technical signals and dollar strength. The focus remains on demand-side pressures and macroeconomic headwinds.
Market sentiment, as reflected in various financial news outlets and analyst reports, has also turned increasingly bearish on silver in recent weeks. This shift in sentiment can become a self-fulfilling prophecy, as negative sentiment can lead to further selling pressure, reinforcing the downtrend. The fact that many recent PriceONN articles have highlighted the sharp decline in silver prices and the testing of key support levels below $70 underscores this bearish narrative. Traders are actively discussing the possibility of silver falling towards $65, indicating a widespread expectation of further downside.
Scenario Analysis: Navigating the Path Forward
Given the current technical and fundamental landscape, several scenarios can be envisioned for XAGUSD. The overwhelming bearish sentiment on shorter timeframes, coupled with a strong dollar and risk-off environment, points towards continued downward pressure. However, the oversold conditions on daily charts suggest that a technical bounce is possible, though its sustainability remains questionable.
Bearish Continuation: The Slide Extends
65% ProbabilityConsolidation and Range-Bound Trading
25% ProbabilityOversold Bounce and Short-Covering Rally
10% ProbabilityThe dominant scenario, given the current technical strength indicators like the 4H ADX at 62.89 and the prevailing macroeconomic conditions, is a continuation of the bearish slide. A break below the immediate 1-hour support at $67.33 would likely trigger further selling, potentially targeting the $66.59 and $65.40 levels. This scenario is further supported by the consistent negative momentum observed in the MACD across timeframes and the oversold readings on the Stochastic, which often persist in strong trends.
A neutral scenario involves silver consolidating within a defined range. This could occur if the market fails to generate enough momentum to break key support or resistance levels, leading to a period of sideways trading. Such consolidation might occur between the $67.33 support and the $69.26 resistance on the 1-hour chart, or a slightly wider range defined by the 4-hour support at $68.34 and resistance at $71.77. In this scenario, traders would look for opportunities to trade the range boundaries, although the strong downtrend signals suggest this might be a temporary phase before the next directional move.
The bullish scenario, while less probable in the immediate term, cannot be entirely dismissed. A sharp, technically driven bounce could occur if short-sellers decide to cover their positions aggressively, or if a sudden shift in market sentiment or a significant geopolitical event triggers a flight to precious metals. For this to gain traction, XAGUSD would need to decisively break above the immediate 1-hour resistances, particularly $70.45 and $71.18, with confirming volume and a shift in MACD momentum. Such a move could potentially target the 4-hour resistance level at $73.35. However, without a clear catalyst, this remains a low-probability outcome in the current environment.
Market Sentiment and Trader Positioning
The prevailing market sentiment surrounding silver is undeniably bearish. Recent PriceONN market news highlights a consistent theme of sharp declines, with articles focusing on silver plunging over 6% in a single day and the key levels below $70 being tested. The narrative suggests that a significant amount of value has been wiped off mining stocks as gold, silver, and copper prices plummet, indicating broad weakness across the precious metals sector.
The keyword intelligence data further corroborates this bearish outlook. Keywords such as 'XAGUSD price forecast', 'XAGUSD weekly outlook', and 'XAGUSD support and resistance' are highly searched, indicating active interest from traders looking for direction. The emphasis on 'current silver price XAGUSD March 2 2026' and similar phrases suggests traders are actively monitoring the price action and seeking real-time analysis. The fact that 'silver price volatile run' is already ranking suggests that volatility is a key characteristic of the current market, which often accompanies sharp moves in either direction, but currently favors the downside.
Trader positioning, as can be inferred from technical signals, appears to be heavily skewed towards short positions. The overwhelming 'SELL' signals across multiple timeframes and indicators, particularly the strong ADX readings, suggest that most market participants are betting on further declines. The oversold conditions indicated by RSI and Stochastic on daily charts might tempt some contrarian buyers, but the prevailing trend strength on shorter timeframes suggests that such positions would be entering against a strong current. Any sustained move higher would likely require a significant shift in market sentiment or a clear technical breakout above key resistance levels.
The correlation with other markets also informs sentiment. The weakness in equities and cryptocurrencies, alongside a strengthening dollar, creates a challenging environment for silver. This broad risk-off sentiment often leads to reduced speculative demand for commodities like silver, which are sensitive to both industrial outlooks and investor risk appetite. Unless these macro factors shift significantly, sentiment is likely to remain cautious to bearish for XAGUSD.
The current market environment is highly volatile, with strong directional trends indicated by technical indicators. Traders should exercise extreme caution, employ robust risk management strategies, and avoid entering positions against strong prevailing trends without clear confirmation or valid setups. The oversold conditions on longer timeframes present a potential for sharp, short-covering rallies, which could trap unwary trend-followers.
Looking Ahead: Key Levels and Events to Watch
As we move into the next trading week, the focus for XAGUSD will undoubtedly remain on the key technical levels and any shifts in the macroeconomic narrative. The immediate support at $67.33 is paramount. A break below this level would validate the bearish scenario and likely accelerate the decline towards $66.59 and potentially $65.40. On the upside, resistance at $69.26 and $70.45 will be critical hurdles. A sustained move above these levels, especially with increasing volume, could signal a potential short-covering rally, but it would need to overcome the strong bearish momentum.
The US Dollar Index (DXY) will continue to be a primary driver. Any signs of weakness in the DXY, perhaps due to shifts in Fed expectations or weaker US economic data, could offer some respite to silver. Conversely, continued dollar strength, driven by hawkish Fed rhetoric or strong economic performance, will likely keep XAGUSD under pressure. Investors will be closely watching upcoming US economic data releases, such as inflation figures or employment reports, for clues on the Fed's future policy path.
The performance of other risk assets, particularly equities, will also be important. A continued sell-off in the S&P 500 and Nasdaq would reinforce the risk-off sentiment, potentially leading to further declines in silver. Conversely, any stabilization or recovery in equity markets could provide a more supportive backdrop. The strong upward momentum in oil prices, while currently disconnected from silver's price action, remains a factor to monitor. A sustained rally in oil could eventually feed into inflation concerns, which might indirectly support precious metals if other bearish factors subside.
The geopolitical landscape remains a wildcard. While recent events have not directly boosted silver, any escalation in global tensions could trigger a flight to safety, potentially benefiting precious metals. However, in the current environment, the dominant forces appear to be macroeconomic and technical. Traders should remain vigilant for any unexpected news that could dramatically alter the market's risk appetite or currency dynamics.
Frequently Asked Questions: XAGUSD Analysis
What happens if XAGUSD breaks below the $67.33 support level?
If XAGUSD decisively breaks below the $67.33 support on the 1-hour chart, it would signal further bearish momentum. This could trigger a cascade of selling, potentially targeting the next support levels at $66.59 and $65.40 as the market chases lower prices.
Should I buy XAGUSD at current levels around $68.00 given the oversold RSI?
Given the strong bearish trend (ADX at 62.89 on 4H) and negative MACD momentum, buying at current levels around $68.00 is risky. While RSI is oversold, it can remain so during strong downtrends. A more prudent approach would be to wait for clear bullish confirmation, such as a break above $70.45 resistance, with a probability estimate of 10% for a short-covering rally.
Is the RSI at 30.79 a sell signal for XAGUSD right now?
An RSI reading of 30.79 is generally considered oversold, suggesting potential for a bounce. However, in the context of a strong downtrend (ADX 36.09 on 1H), it does not automatically signal a sell. Instead, it highlights extreme conditions that could precede a reversal or a period of consolidation, rather than an immediate sell signal on its own.
How will the DXY's strength around 99.25 affect XAGUSD this week?
The DXY's current strength around 99.25, with a strong daily trend, is a significant bearish factor for XAGUSD. This exerts downward pressure on silver, making it more expensive for foreign buyers. If the DXY continues to rise, it will likely hinder any recovery attempts in silver prices.
Technical Outlook Summary
| Indicator | Value | Signal | Interpretation |
|---|---|---|---|
| RSI (14) | 30.79 | Neutral | Nearing oversold on 1H, but still in downtrend context |
| MACD Histogram | Negative | Bearish | Confirms negative momentum across timeframes |
| Stochastic | K=12.72, D=17.11 | Bearish | Oversold crossover on 1H, indicating further downside potential |
| ADX | 36.09 | Bearish | Indicates a strong downtrend on 1H, confirming trend strength |
| Bollinger Bands | Below Lower Band | Bearish | Price is in extreme territory, suggesting continued pressure |
Key Levels for XAGUSD
Support Levels
Resistance Levels
Track markets in real-time
AI-powered analysis, technical indicators and real-time price data.
Join Our Telegram Channel
Breaking market news, AI analysis and trading signals instantly.
Join Channel