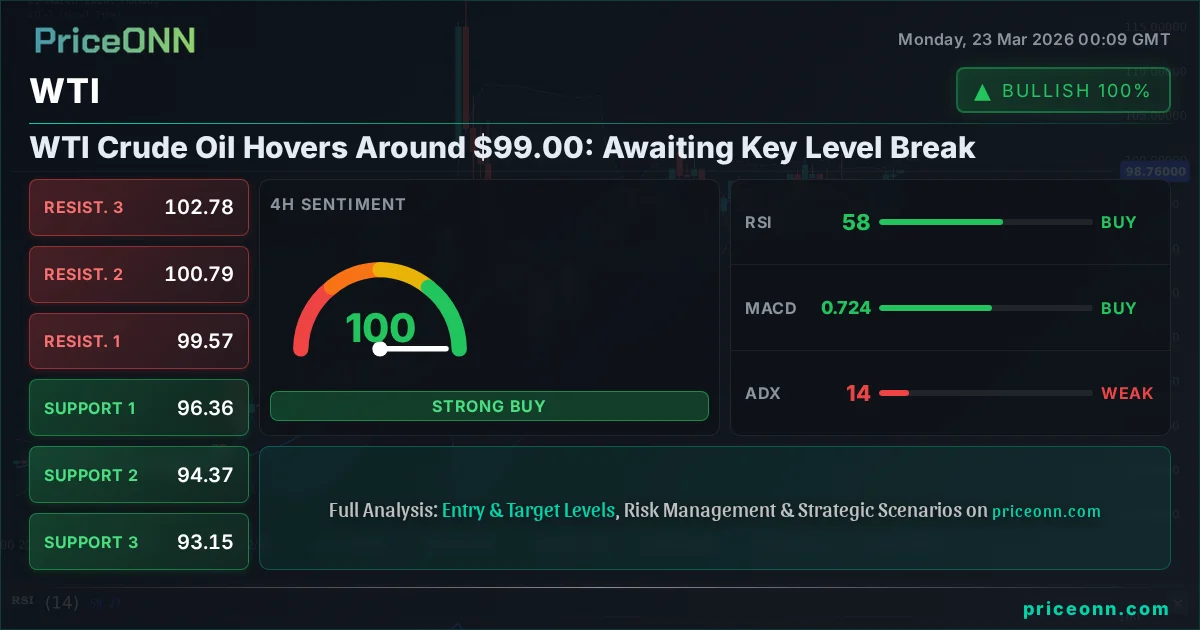
WTI Crude Oil Hovers Around $99.00: Awaiting Key Level Break
WTI crude oil is trading near $99.00, with technical indicators showing mixed signals. A decisive move above resistance or breakdown below support is needed.
The energy markets are holding their breath as WTI crude oil dances around the critical $99.00 psychological and technical level. This isn't just another price point; it's a pivot around which the immediate direction of the world's benchmark crude is likely to be decided. Having seen a significant rally recently, the question on every trader's mind is whether this momentum can be sustained, or if we're poised for a correction. The interplay between bullish technical signals and the looming risk of a macroeconomic downturn creates a complex picture, demanding a nuanced approach.
- WTI crude oil is currently trading at $99.00, a critical psychological and technical level.
- The 1-day RSI at 71.0 indicates a strong uptrend but is nearing overbought territory, suggesting caution.
- Key resistance is identified at $100.18, while immediate support lies at $96.79.
- Geopolitical tensions in oil-producing regions and central bank policy remain key drivers for WTI price action.
The recent surge in WTI, pushing it towards the $100 mark, has been fueled by a potent mix of supply-side concerns and resurgent demand expectations. Geopolitical tensions continue to simmer, particularly in regions critical for global oil output. While specific news items about solar or quantum batteries might seem distant, the overarching energy landscape is shifting. The recent Alaska oil lease sale, generating a record $163.7 million, signals renewed investment interest in traditional energy frontiers, even as the world grapples with decarbonization. However, this rally is happening against a backdrop of a strengthening dollar and mixed signals from major equity indices like the S&P 500 and Nasdaq, which are showing signs of weakness. This divergence highlights the delicate balance in the market: strong commodity-specific drivers are battling broader risk-off sentiment.
Looking at the daily chart, WTI's trend is undeniably bullish, with a strength score of 100%. This is reinforced by a strong ADX of 65.23, indicating a very robust upward trend. The RSI(14) is sitting at 70.99, firmly in overbought territory, which historically suggests that a pullback or consolidation might be on the horizon. However, in a strong trend, RSI can remain elevated for extended periods. The MACD is positive and above its signal line, supporting the bullish momentum, while Stochastic K is above D, also signaling upward strength. The Bollinger Bands are widening and price is trading above the middle band, confirming the bullish pressure. Yet, the very strength of this trend, coupled with the RSI reading, suggests that any significant catalyst could trigger profit-taking. The immediate overhead resistance is at $100.18, a level that has acted as a significant barrier previously. A sustained break above this point would be a strong signal for further upside, potentially targeting $102.02 and $103.57.
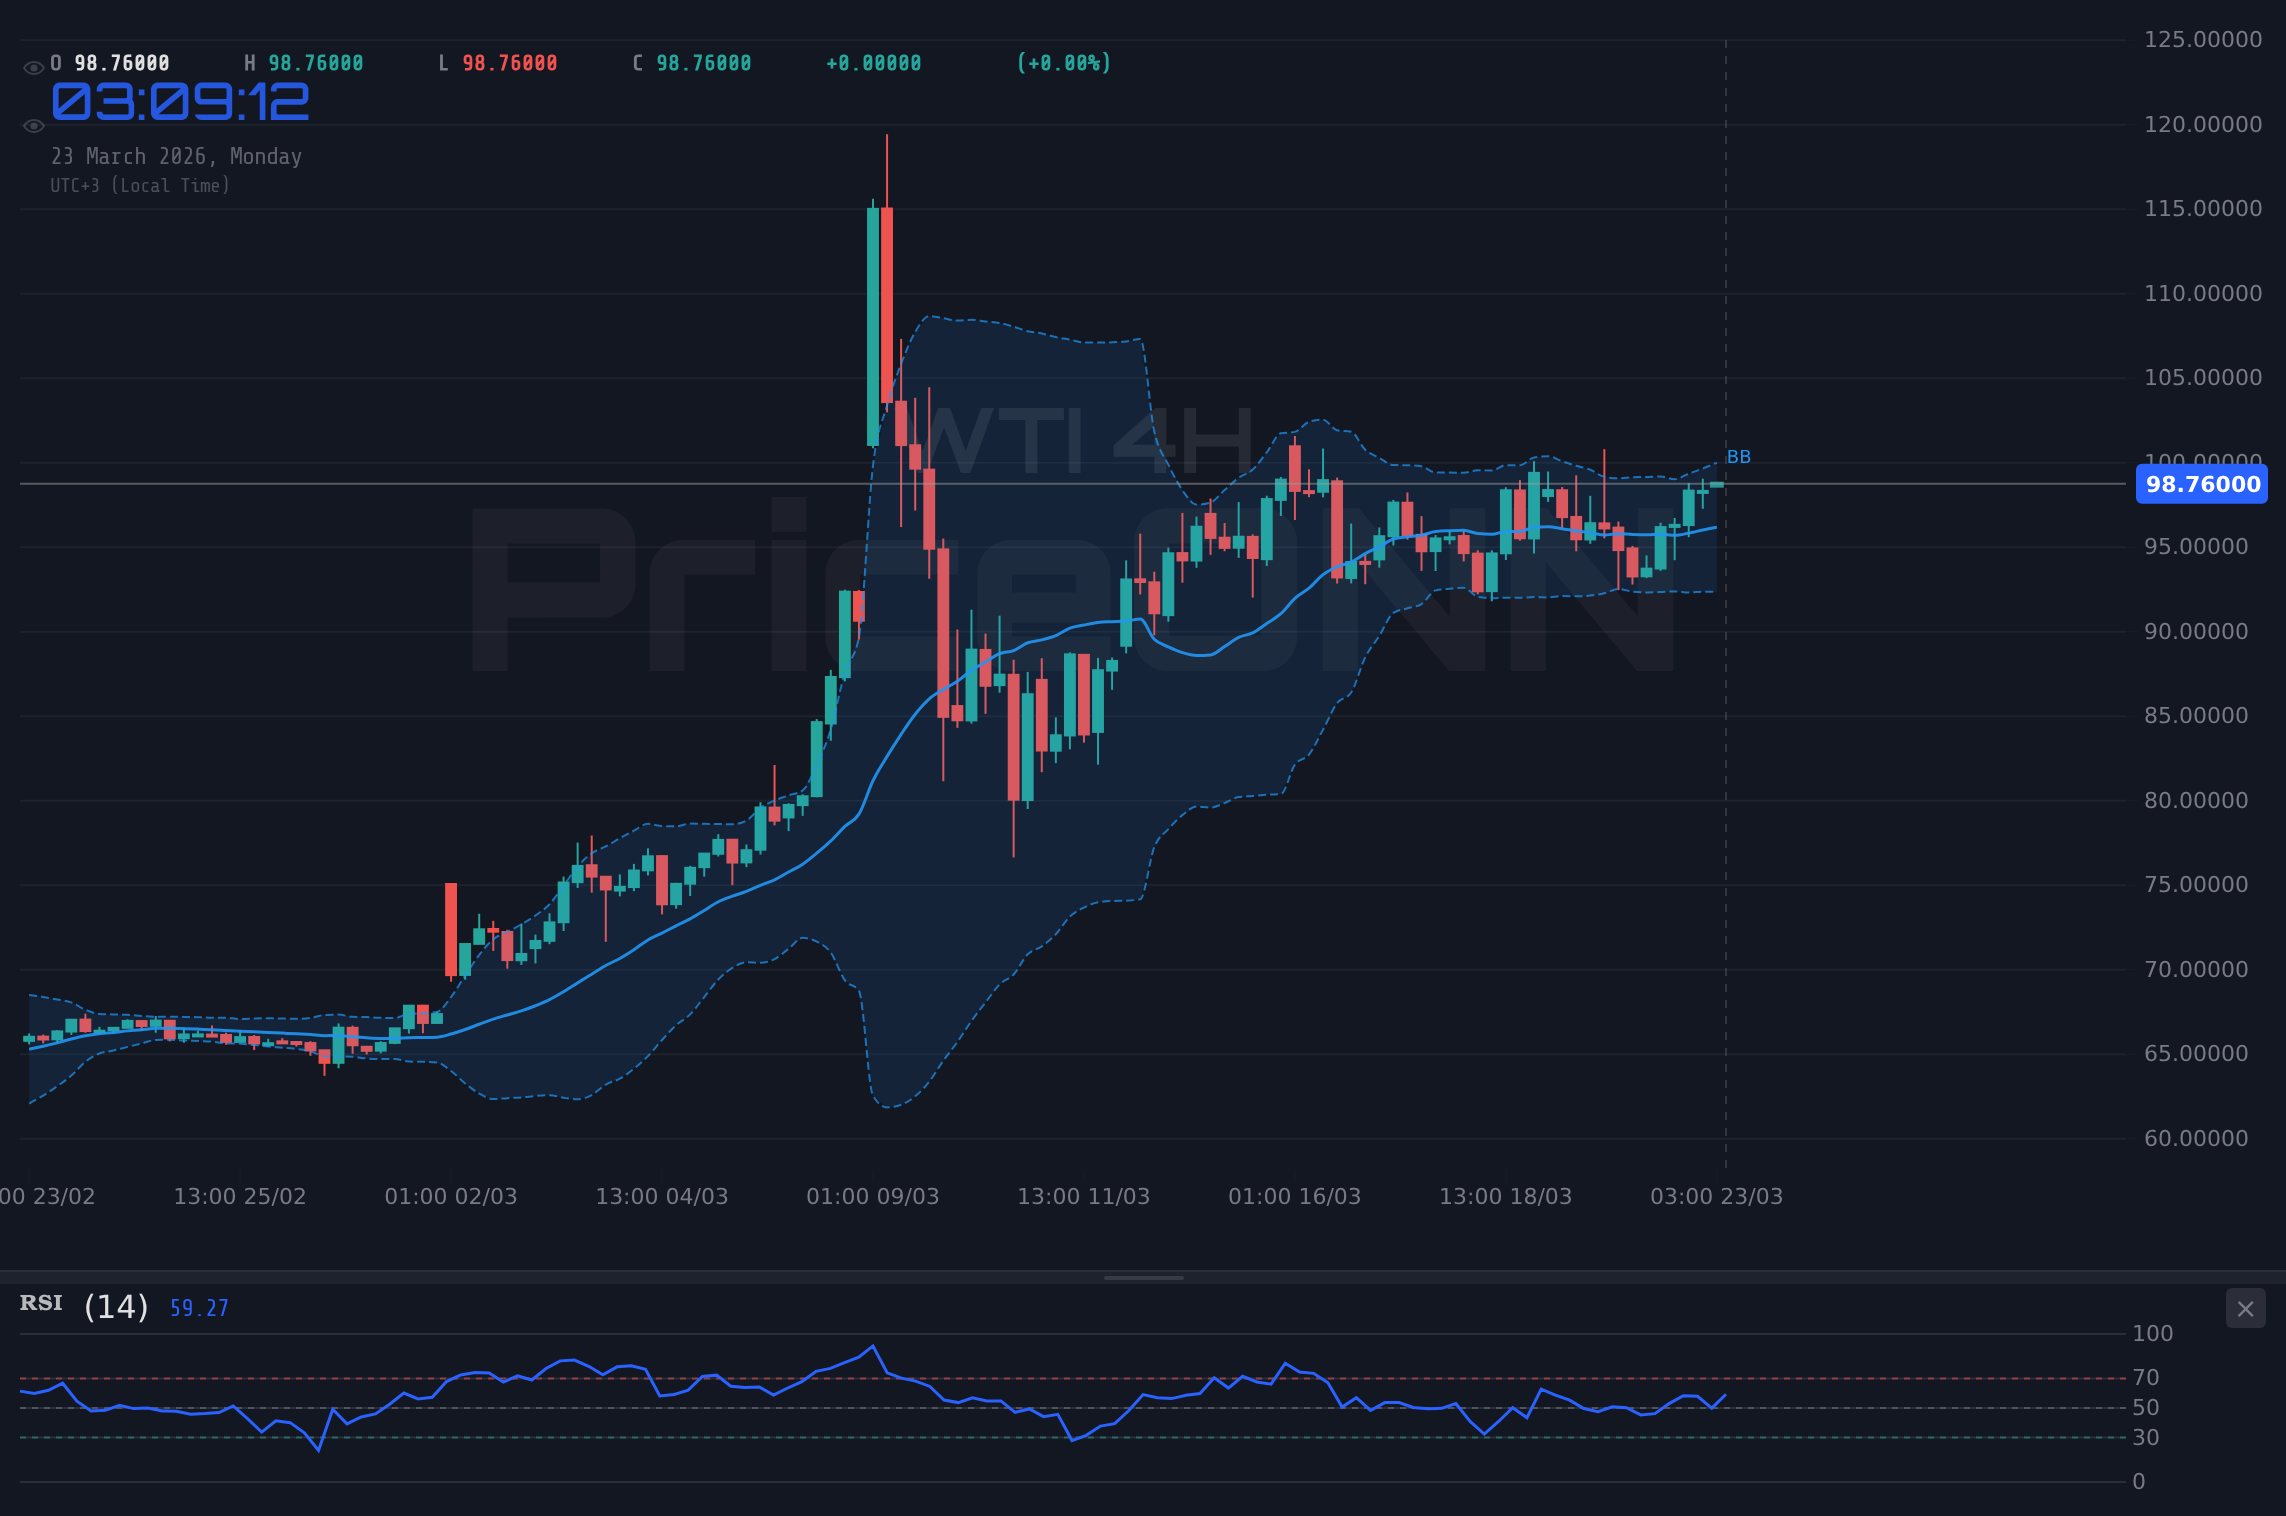
On the 4-hour timeframe, the trend remains strongly bullish (82% strength), but the ADX has moderated to 13.75. This lower ADX value, compared to the daily chart, suggests that while the trend is up, its strength is waning, and the market might be entering a choppier, more range-bound phase. The RSI at 58.27 is in neutral territory, providing no immediate overbought or oversold signal, but it is drifting lower from its recent highs. The MACD is positive and above the signal line, but the histogram is showing decreasing momentum. Stochastic K is above D, indicating upward movement, but it's not in extreme territory. The Bollinger Bands are still suggesting an uptrend, with price above the middle band. This timeframe presents a more cautious outlook compared to the daily chart. It implies that while the broader trend is up, the immediate path might involve more consolidation or minor pullbacks before any significant move.
The 1-hour chart paints an even more nuanced picture, with the trend currently neutral (50% strength) and a lower ADX of 21.82, confirming a lack of strong directional conviction in the very short term. The RSI at 62.93 is in the upper half of neutral territory, leaning towards bullish but not yet overbought. The MACD has crossed below its signal line, generating a bearish signal on this timeframe, which contradicts the longer-term trends. Stochastic K is above D, but the K line is actually decreasing, showing a slight bearish divergence. The Bollinger Bands are also showing price trading above the middle band, but they are beginning to narrow, suggesting decreasing volatility and a potential period of consolidation. This short-term indecision highlights the importance of the $99.00 level; a break above resistance at $100.18 could re-energize the bulls, while a failure to hold support at $96.79 might see sellers take control.
The correlation with the U.S. Dollar Index (DXY) is a crucial factor to monitor. With DXY currently trading at 99.35 and showing a daily upward trend (92% strength), a stronger dollar typically exerts downward pressure on commodities priced in dollars, like WTI. However, the current market narrative seems to be driven more by oil-specific supply concerns than by dollar strength alone. If the DXY were to break above its resistance at 99.75 and continue its ascent, it would likely add headwinds to crude oil prices. Conversely, a weakening dollar could provide an additional tailwind for WTI, especially if geopolitical risks remain elevated. The interplay between these two forces will be critical in determining the next significant price move.
Equities also play a role in the broader market sentiment. The S&P 500, trading at 6492.05, and the Nasdaq, at 23808.49, are both showing significant daily declines (-1.88% and -2.4% respectively). This risk-off sentiment in the stock markets can sometimes spill over into commodities, leading to broader sell-offs. If equity markets continue to slide, it could dampen demand expectations for oil, even if supply remains tight. The fact that WTI has shown resilience despite this equity weakness is a testament to the strength of the underlying bullish drivers in the oil market. However, a deeper dive into the stock market's technicals on the 4-hour chart shows RSI at 28.12 for the S&P 500 and 27.41 for the Nasdaq, both in oversold territory. This suggests that while equities are falling, they might be due for a short-term bounce, which could offer some relief to risk assets, including oil.
The recent news flow provides context for the current market dynamics. While headlines about quantum batteries and solar surges in red states might seem tangential, they speak to the broader energy transition narrative and the complex energy mix the world is navigating. The record bids in Alaska's oil and gas lease sale underscore the continued investment in fossil fuels, driven by immediate price dynamics and energy security concerns. This is happening even as big tech's AI-driven emissions spark discussions about carbon credits. This complex backdrop suggests that while the long-term transition to renewables is underway, the short-to-medium term outlook for oil demand remains robust, supported by current geopolitical realities and energy security needs. The continued investment in oil frontiers, despite political headwinds, reinforces the idea that traditional energy sources will play a significant role for the foreseeable future.
From a trading perspective, the current setup around $99.00 presents a 'watch and wait' scenario. The daily chart shows a strong bullish trend, but the RSI is flashing an overbought warning. The hourly and 4-hour charts show conflicting signals and waning momentum, indicating short-term indecision. The critical resistance level to watch is $100.18. A decisive close above this level on a 4-hour or daily chart, especially with increased volume, would signal a continuation of the uptrend, potentially targeting $102.02 and $103.57. On the downside, immediate support is found at $96.79. A break below this level, particularly a close below the 4-hour middle Bollinger Band, would invalidate the short-term bullish outlook and could lead to a retest of lower support levels around $95.24 and $94.37.
The ADX readings across timeframes are particularly telling. The very strong ADX on the daily (65.23) confirms the powerful trend, but the moderating ADX on the 4-hour (13.75) and 1-hour (21.82) charts suggests that the conviction behind the move is weakening as we approach the $100 mark. This divergence in trend strength across timeframes often precedes a period of consolidation or a potential reversal. Traders should be wary of chasing price above $99.00 without confirmation of a breakout above $100.18. Conversely, aggressive traders might look for signs of capitulation or a clear break of support levels for shorting opportunities, but the overall daily trend still favors the upside.
Central bank policy remains a background hum that could significantly influence the energy market. While WTI's recent strength is largely driven by supply-side factors and geopolitical risk premiums, a hawkish shift from major central banks like the Federal Reserve could strengthen the dollar and dampen risk appetite, indirectly pressuring oil prices. Conversely, any signs of dovishness or a pause in rate hikes could support risk assets and potentially oil. The current Fed Fund Futures pricing, while not explicitly provided in the market data, is always a key indicator to watch. Any significant shift in expectations about interest rate differentials would impact currency markets and, by extension, commodity prices.
Considering the conflicting signals across different timeframes and the current macroeconomic backdrop, patience is key. The $99.00 level is a battleground. Bulls need to see a decisive push through $100.18 to confirm the continuation of the rally. Bears are looking for a failure to hold $96.79 to signal a potential reversal. The market is at a crossroads, and the next few trading sessions will likely provide the clarity needed to establish a more defined trade plan. The high ADX on the daily chart suggests that when a move does happen, it could be significant.
The recent news about the USR stablecoin plummeting after an exploit, while in the crypto space, serves as a stark reminder of the inherent volatility and risks in financial markets. While WTI is a different asset class, the underlying theme of rapid price swings and the importance of robust collateral or fundamental support is universal. In WTI's case, the fundamental support currently stems from tight supply and geopolitical risk, but these factors can change rapidly.
Bearish Scenario: Consolidation Below Resistance
40% ProbabilityBullish Scenario: Breakout Above Key Level
55% ProbabilityNeutral Scenario: Range-Bound Trading
5% ProbabilityFrequently Asked Questions: WTI Analysis
What happens if WTI breaks above $100.18 resistance?
A sustained close above $100.18 on a 4-hour or daily chart would likely trigger further buying, signaling a continuation of the bullish trend. This could open the door for targets at $102.02 and potentially $103.57, supported by strong daily trend indicators.
Should I buy WTI at current levels around $99.00 given the RSI is at 71?
Buying at current levels around $99.00 with an RSI of 71 warrants caution, as it indicates overbought conditions on the daily chart. A high-probability setup would require waiting for a confirmed breakout above $100.18 or a pullback to a stronger support level like $96.79.
Is the ADX reading of 65.23 on the daily chart a sell signal for WTI?
An ADX of 65.23 on the daily chart signifies a very strong trend, not a sell signal itself. While it confirms the power of the current move, the high RSI suggests the trend might be maturing, and traders should watch for signs of weakening momentum or bearish divergence before considering selling.
How will the DXY strength around 99.35 affect WTI prices this week?
A DXY trading near 99.35, with a daily uptrend, typically puts pressure on dollar-denominated commodities like WTI. However, WTI's current strength suggests supply-side factors are overriding dollar strength. If DXY breaks above 99.75, it could add headwinds, but oil-specific drivers remain paramount.
The path forward for WTI hinges on its ability to decisively break through the $100.18 resistance. The daily trend remains robust, but the short-term indicators are showing signs of fatigue. Traders must remain vigilant, paying close attention to the $99.00 pivot point and the key levels identified. Patience and risk management will be paramount in navigating this critical juncture. The market is presenting a clear decision point; waiting for confirmation is the most prudent strategy.
Track markets in real-time
AI-powered analysis, technical indicators and real-time price data.
Join Our Telegram Channel
Breaking market news, AI analysis and trading signals instantly.
Join Channel