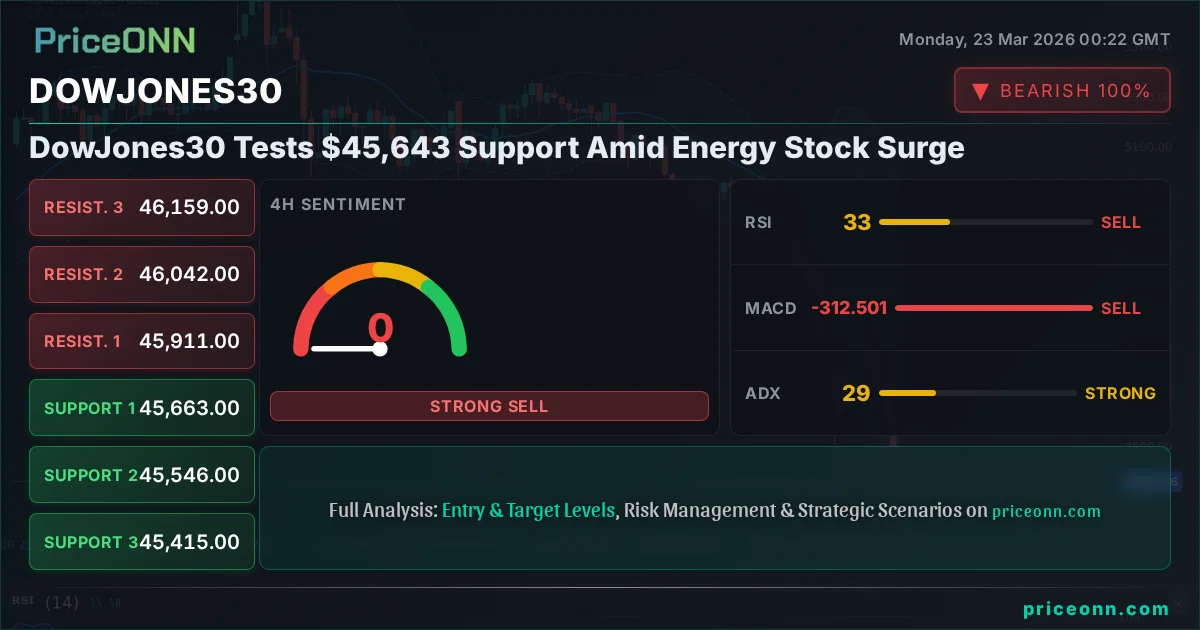
DowJones30 Tests $45,643 Support Amid Energy Stock Surge
DowJones30 is testing critical support at $45,643. Energy stocks rally as Brent crude eyes $116.63 resistance. A mixed market picture emerges.
The DowJones30 index is currently teetering precariously around the $45,643 mark, a level that traders and analysts are watching with bated breath. This critical juncture comes amidst a broader market sentiment that can only be described as bifurcated, with energy stocks experiencing a significant surge while other risk assets grapple with renewed selling pressure. The stark contrast between these sectors paints a complex picture for investors navigating today's volatile landscape. Understanding the interplay between these divergent forces is paramount for anyone looking to position themselves effectively in the coming trading sessions.
- DowJones30 is testing key support at $45,643, with a strong downtrend confirmed by ADX 28.77.
- Energy prices are soaring: Brent crude is at $112.54, targeting $116.63 resistance, while WTI eyes $99.60.
- Risk-off sentiment is evident as major indices like SP500 (-1.72%) and Nasdaq (-2.16%) fall sharply.
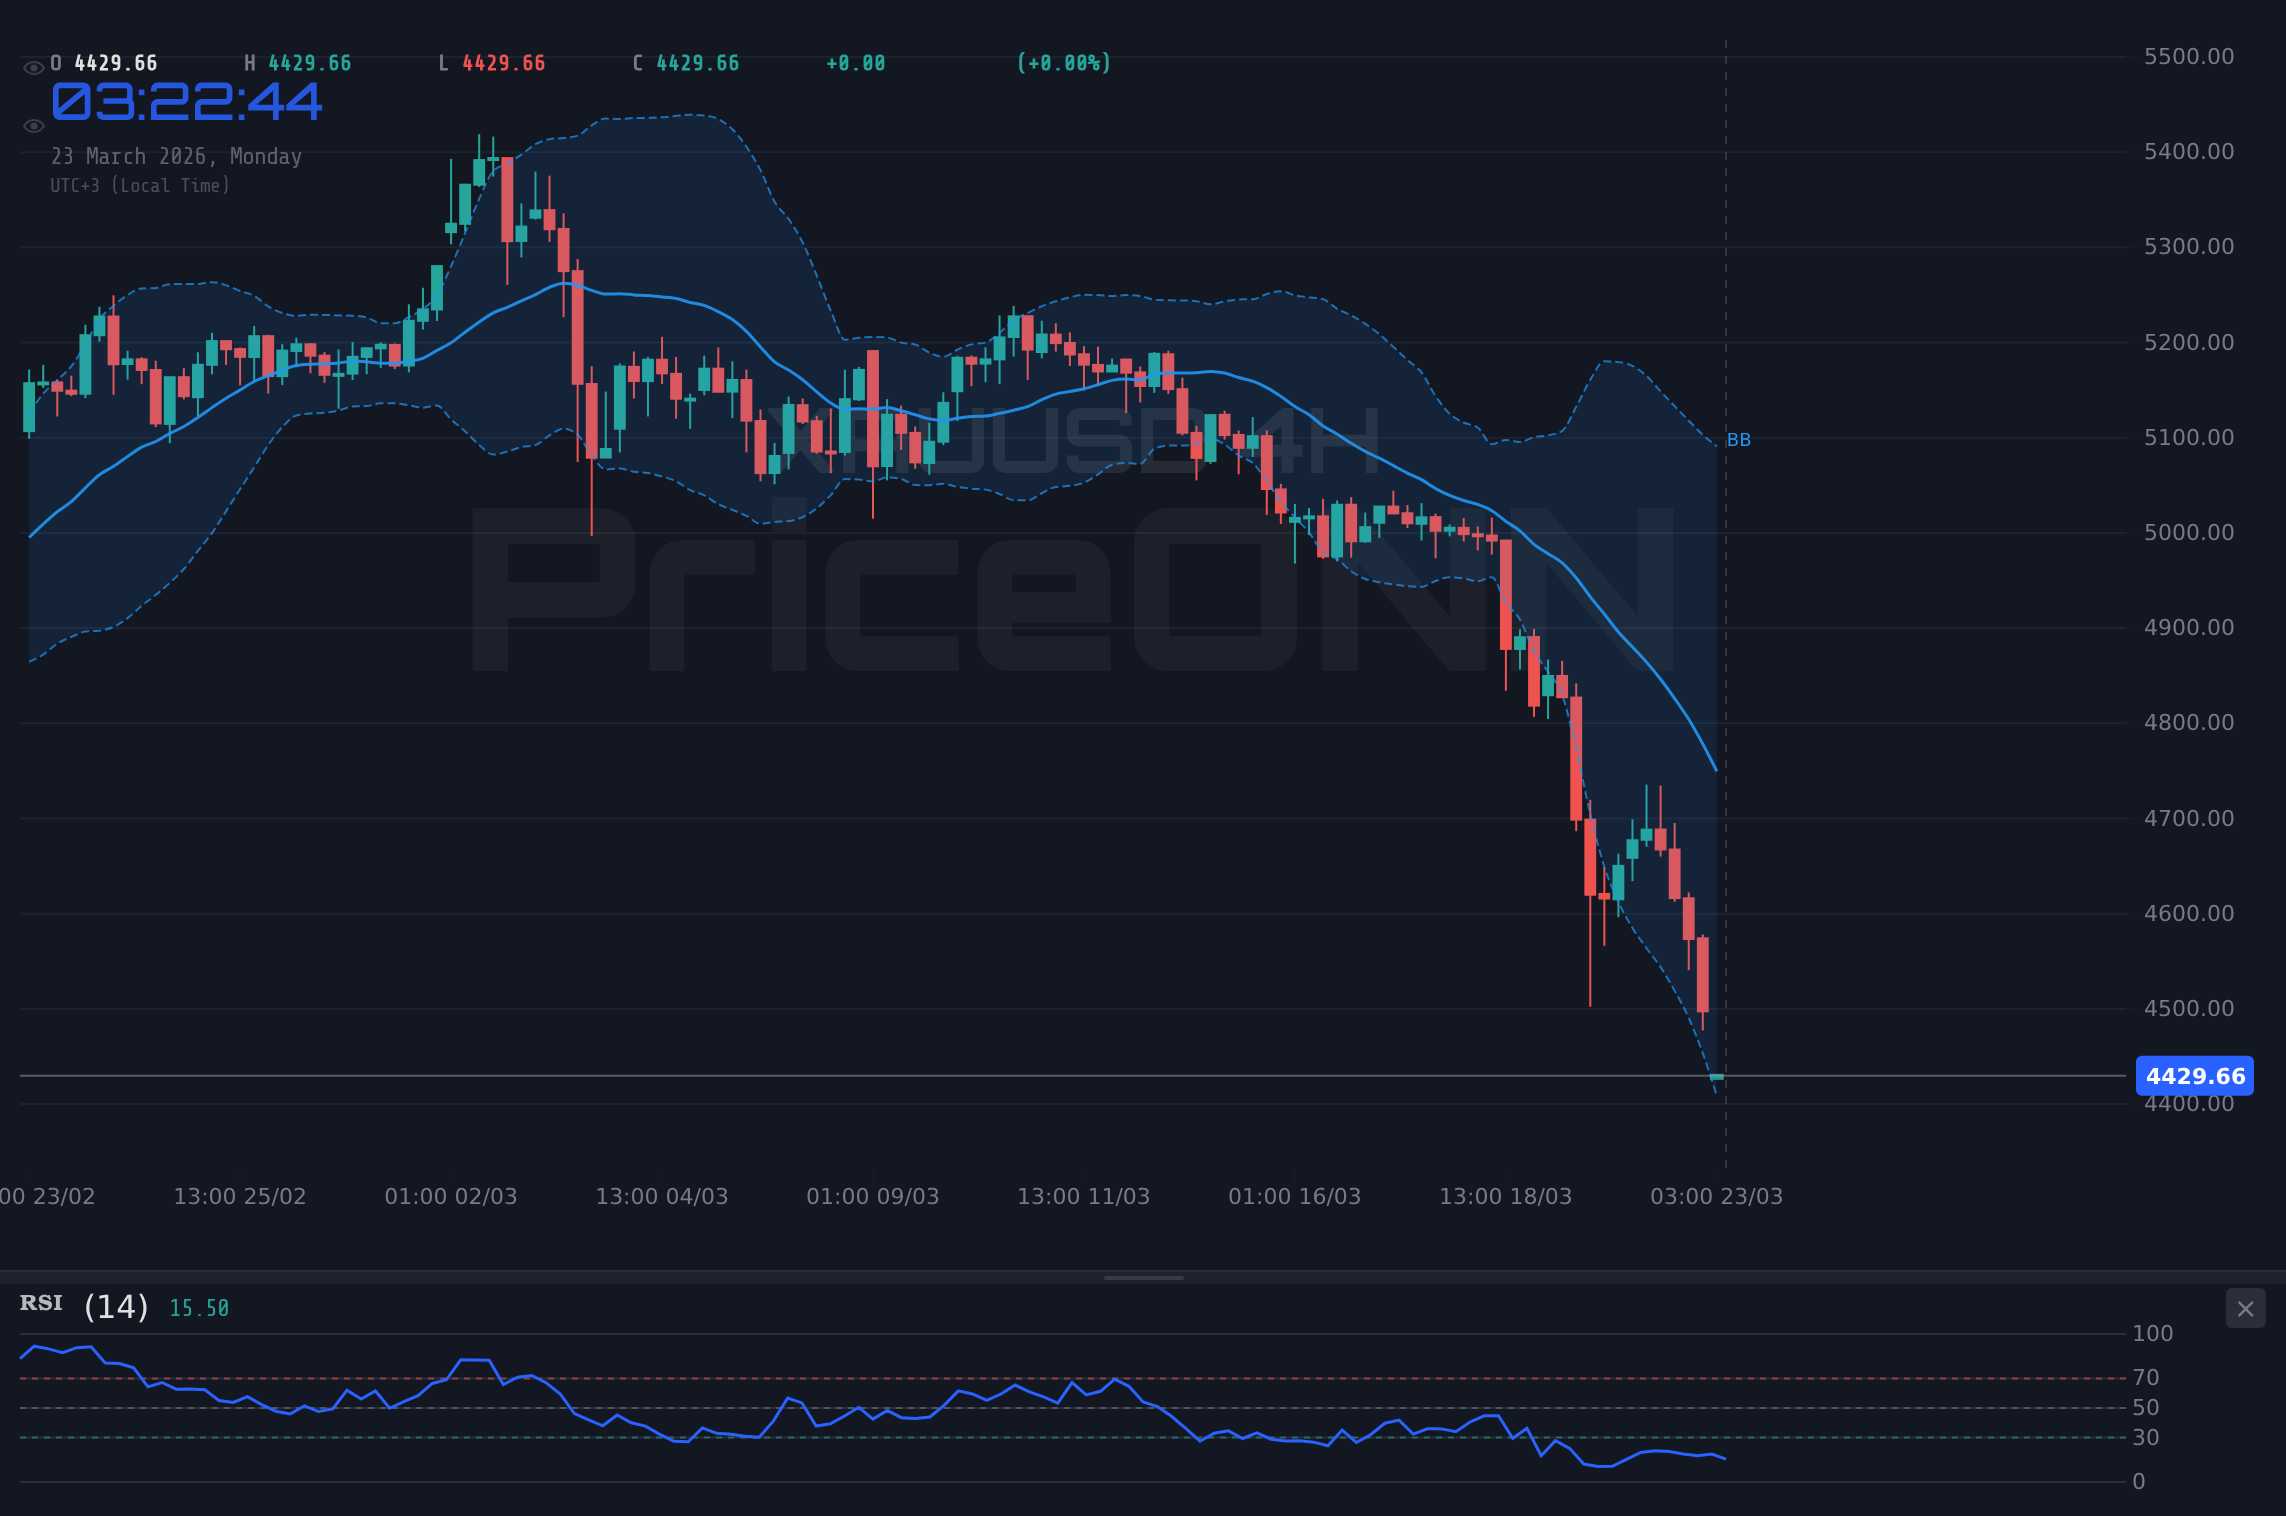
- The US Dollar Index (DXY) is climbing to 99.32, indicating safe-haven demand and putting pressure on gold, which is down 4.76% at $4,428.93.
The dramatic ascent in crude oil prices, with Brent crude reaching $112.54 and WTI at $98.81, is a dominant theme. This surge is not merely a reaction to immediate supply concerns but is underpinned by a confluence of factors including ongoing geopolitical tensions and robust demand signals, particularly from sectors heavily reliant on energy. The fact that Brent is challenging its 4H resistance at $111.40, with a daily chart showing a very strong uptrend (ADX 65.23), suggests that the upward momentum could persist. This inflationary pressure from oil is a significant macroeconomic consideration, potentially influencing central bank policies and overall market risk appetite. The question on many traders' minds is whether this energy-driven inflation will spill over, forcing a more hawkish stance from policymakers or if central banks will tolerate higher inflation in exchange for supporting economic growth. The current market data indicates a strong bullish signal for both Brent and WTI across multiple timeframes, with strong ADX readings suggesting the trend has significant power behind it.
The Dollar's Grip Tightens
As energy prices climb, the US Dollar Index (DXY) is also showing renewed strength, currently trading at 99.32. This move is not unexpected; in times of heightened global uncertainty and rising commodity prices, the dollar often benefits from its safe-haven status. The DXY's upward trajectory, supported by positive momentum on the 1H and 1D charts, puts pressure on riskier assets and major currency pairs. We see EURUSD struggling at 1.15631, with its 1D trend firmly in the bearish camp (ADX 37.37), and GBPUSD also showing weakness, trading at 1.33382 amidst a daily downtrend. Even historically low-yielding currencies like the Japanese Yen are feeling the heat, with USDJPY pushing higher towards 159.083. This strengthens the narrative of a 'risk-off' environment, where investors flock to perceived safety, boosting the dollar at the expense of other currencies. The correlation between a rising DXY and falling gold prices is particularly evident, with XAUUSD trading down 4.76% at $4,428.93.
Gold's Steep Fall: More Than Just a Correction?
The sharp decline in gold prices, down 4.76% to $4,428.93, is a major talking point. The 1-hour and 4-hour charts paint a grim picture, with strong downtrends and ADX readings well above 30, indicating powerful directional moves. The RSI is deeply in oversold territory across all timeframes (23.51 on 1H, 16.74 on 4H, 28.05 on 1D), which typically signals a potential for a bounce. However, the overwhelming 'SELL' signals across technical indicators, especially the very strong ADX on the 4H chart (63.5), suggest that this is more than just a minor pullback. It could be the start of a more significant correction or a shift in market sentiment away from safe-haven assets. The breakdown below the lower Bollinger band on multiple timeframes further emphasizes the bearish pressure. While oversold conditions present a potential buying opportunity, the prevailing trend and the strength of the dollar suggest caution. Traders should look for confirmation signals, such as a sustained move back above the $4,539.36 resistance on the 1H chart, before considering any long positions.
Equity Markets Under Pressure
The broader equity markets are reflecting the prevailing risk-off sentiment. The SP500 is down 1.72% at 6502.1, and the Nasdaq has fallen 2.16% to 23866.49. Both indices are showing strong downtrends on their hourly and daily charts, with ADX readings indicating significant bearish momentum. The RSI is in oversold territory on the 4H and 1D charts for SP500, and the 1H and 4H for Nasdaq, suggesting that while the selling has been aggressive, a short-term bounce might be on the cards. However, the dominant daily trends and the general risk aversion point towards further downside potential. The DowJones30's current position at $45,643 is particularly noteworthy. It sits near its 1H support level of $45,663, a crucial point where buyers might step in to test the prevailing bearish sentiment. A failure to hold this level could trigger further selling, potentially targeting the $45,415 support on the 4H chart. The strong downtrend signals across these indices suggest that any rallies may be short-lived, and traders should remain cautious.
The DowJones30 at a Crossroads: $45,643 in Focus
The DowJones30 index, trading at $45,643, finds itself at a pivotal point. The 1-hour chart shows a downtrend with an ADX of 32.98, indicating strong momentum. Key support lies at $45,415 (4H) and $44,984 (1H). Resistance is observed at $45,720 (1H) and $45,911 (4H). The daily chart presents a more concerning picture, with a strong downtrend (ADX 41.79) and RSI deeply oversold at 26.12. This suggests that while a bounce is technically possible, the underlying trend remains bearish. The conflict between the hourly's 'SELL' signal (7 sellers, 1 buyer) and the daily's oversold conditions creates a complex trading environment. The significant daily drop of -0.96% to $45,643 highlights the bearish pressure. The fact that the current price is testing the $45,663 1H support level is critical. A close below this level could accelerate the decline towards the $45,415 4H support. Conversely, a sustained bounce from $45,643 could see the index retest the $45,720 1H resistance. The overall market sentiment, driven by rising oil prices and a strong dollar, favors a risk-off approach, which typically weighs on indices like the DowJones30.
Energy Stocks: The Outliers in a Risk-Off World
While the broader market succumbs to risk aversion, the energy sector stands out as a conspicuous exception. Brent crude's impressive rally to $112.54, with a daily trend strength of 100% and an ADX of 65.23, is a testament to the sector's current strength. WTI is not far behind, trading at $98.81 with a very strong daily uptrend. This surge is partly fueled by geopolitical narratives, as suggested by the breaking news regarding Alaska's record oil lease sale and the ongoing debate about nuclear power filling the energy gap. The news about red states leading solar growth, while positive for renewables, doesn't negate the immediate impact of fossil fuel prices on inflation and market sentiment. The fact that oil prices are climbing while major indices are falling creates a divergence that is difficult to ignore. This suggests that the market might be pricing in persistent inflation, making energy commodities an attractive, albeit volatile, investment. The strong technical signals for oil across multiple timeframes indicate that this trend could continue in the short to medium term, providing a tailwind for energy stocks.
The implications for the DowJones30 are mixed. On one hand, a significant portion of the index comprises companies that could benefit from higher energy prices, either directly through exploration and production or indirectly through supply chain adjustments. However, the broader market sentiment driven by a strong dollar and falling tech stocks often overshadows these sector-specific tailwinds. The current price action suggests that the index is struggling to find footing, caught between the inflationary pressures from energy and the general flight to safety. The $45,643 level is thus more than just a price point; it's a battleground where the bulls attempt to establish support against the prevailing bearish tide.
Geopolitical Undercurrents and Market Correlation
Geopolitical tensions continue to be a significant driver of market behavior. The ongoing uncertainty surrounding global supply chains, the conflict in Eastern Europe, and the broader US-China dynamic all contribute to the prevailing risk-off sentiment. These factors bolster demand for safe-haven assets like the US dollar and, paradoxically, commodities like oil, which are perceived as inflation hedges. The DXY's rise to 99.32 is a clear signal of this trend. This inverse correlation between the dollar and riskier assets, including gold and major equity indices, is a key theme to watch. As the DXY strengthens, it typically exerts downward pressure on currencies like the Euro and Pound, and also on commodities like gold, which is currently experiencing a sharp sell-off. The market's reaction to these geopolitical undercurrents is a crucial element in understanding the DowJones30's potential path. A further escalation of geopolitical risks could solidify the downtrend in equities while simultaneously pushing oil prices higher and the dollar stronger, creating a challenging environment for diversified portfolios.
The Role of Central Banks and Interest Rate Expectations
While not explicitly detailed in the provided market data, the specter of central bank policy looms large. The persistent rise in oil prices suggests inflationary pressures that could complicate the policy decisions of major central banks like the Federal Reserve. If inflation remains stubbornly high, it might force policymakers to maintain a hawkish stance or even consider further tightening, which would typically weigh on equity markets and support the dollar. Conversely, if central banks signal a pause or pivot, it could provide some relief to risk assets. The current market data, with strong dollar and falling equities, suggests that traders are perhaps pricing in a more cautious or even hawkish outlook from central banks, or at least a tolerance for higher inflation in the short term. The lack of explicit Fed or ECB commentary in the provided news feed means we must infer this sentiment from price action alone. The strong performance of energy stocks, coupled with the dollar's strength, points towards an environment where inflation is a primary concern, potentially limiting the upside for indices like the DowJones30 unless a significant shift in central bank rhetoric occurs.
Navigating the Technical Landscape: DowJones30's Path
From a technical standpoint, the DowJones30 is at a critical juncture. The 1-hour chart shows a strong downtrend with an ADX of 32.98, suggesting momentum is firmly with the sellers. Support is identified at $45,415 (4H) and $44,984 (1H). Resistance levels are at $45,720 (1H) and $45,911 (4H). The daily chart is particularly bearish, with an ADX of 41.79 indicating a very strong trend, and the RSI at 26.12 signaling oversold conditions that could precede a bounce. However, the overall 'SELL' signal across multiple timeframes on the 1H chart (7 sell, 1 buy) cannot be ignored. The current price of $45,643 is testing the $45,663 1H support. A decisive break below this level could trigger a cascade towards the $45,415 4H support. Conversely, if buyers step in strongly at $45,643, we might see a retest of the $45,720 1H resistance. The stochastic indicators are giving mixed signals across timeframes, but the dominant ADX readings suggest that trend-following strategies are currently favored, albeit to the downside for the DowJones30.
Bearish Scenario: Downside Momentum Continues
65% ProbabilityNeutral Scenario: Consolidation Around Support
25% ProbabilityBullish Scenario: Bounce from Support
10% ProbabilityFrequently Asked Questions: DowJones30 Analysis
What happens if DowJones30 breaks below the $45,643 support level?
A break below $45,643, especially on the 1-hour chart, would likely trigger further selling pressure. The ADX reading of 32.98 on the 1H chart suggests strong momentum, potentially pushing the index towards the $45,415 4H support level. This scenario aligns with the prevailing risk-off sentiment and the strong dollar.
Should I consider buying DowJones30 at current levels around $45,643 given the oversold RSI?
While the daily RSI is oversold at 26.12, suggesting a potential bounce, the strong bearish trend indicated by ADX 41.79 across daily charts warrants caution. A high-probability trade would require confirmation, such as a clear rejection of $45,643 and a move back above $45,720, with bullish divergence forming.
How is the strong dollar (DXY at 99.32) impacting the DowJones30's trend analysis?
The rising DXY, currently at 99.32, typically correlates inversely with risk assets like the DowJones30. This strengthens the bearish outlook, as capital flows towards the dollar as a safe haven. The DXY's upward momentum reinforces the pressure on equities, making a sustained rally in the DowJones30 less likely without a reversal in the dollar's trend.
How will the surge in oil prices affect the DowJones30's outlook this week?
The surge in oil prices, with Brent at $112.54 and WTI at $98.81, contributes to inflationary concerns. This could lead to a more hawkish stance from central banks, potentially pressuring the DowJones30. While energy stocks might benefit, the broader market impact of sustained inflation and potential policy tightening is likely to be negative for the index.
The DowJones30 currently sits at a critical support level of $45,643, facing significant headwinds from a strengthening dollar and risk-off market sentiment. While energy stocks offer a glimmer of bullishness driven by soaring oil prices, the broader technical picture for the index remains decidedly bearish, with strong downtrend signals across multiple timeframes. Patience and a disciplined approach to risk management are key as the market digests these conflicting forces. The $45,643 support level is the immediate battleground; a failure to hold it could open the door to further declines, while a strong bounce might offer a temporary reprieve. Traders should remain vigilant, waiting for clear confirmation before committing to positions.
Track markets in real-time
AI-powered analysis, technical indicators and real-time price data.
Join Our Telegram Channel
Breaking market news, AI analysis and trading signals instantly.
Join Channel