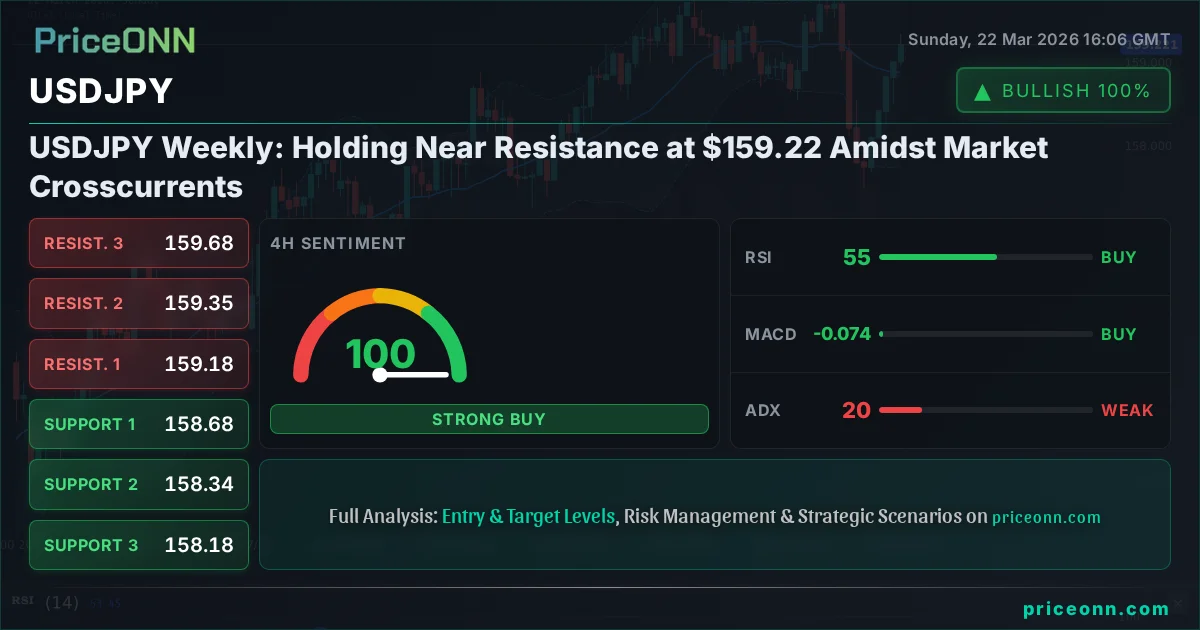
USDJPY Weekly: Holding Near Resistance at $159.22 Amidst Market Crosscurrents
USDJPY hovers near $159.22 resistance. This analysis explores the interplay of DXY, energy markets, and central bank signals shaping the pair's outlook.
The currency markets are a complex tapestry, and this past week, the USDJPY pair has been a prime example of intricate cross-currents. Hovering around the $159.22 mark, it sits precariously close to significant resistance levels, a position that demands close observation. While the Bank of Japan (BoJ) has signaled a potential shift away from its ultra-loose monetary policy, the Federal Reserve's stance continues to underpin the dollar's strength. This divergence creates a fascinating dynamic, one that we'll dissect by examining the broader market context, from energy price surges to the subtle shifts in global risk sentiment.
- USDJPY is currently trading near $159.22, testing key resistance zones.
- The Dollar Index (DXY) is showing strength around 99.25, correlating with USDJPY's upward pressure.
- Despite BoJ hawkish signals, the Fed's firm stance keeps the dollar supported, creating policy divergence.
- Strong upward momentum in Brent Crude oil at $112.54 reflects inflation concerns, potentially influencing central bank decisions.
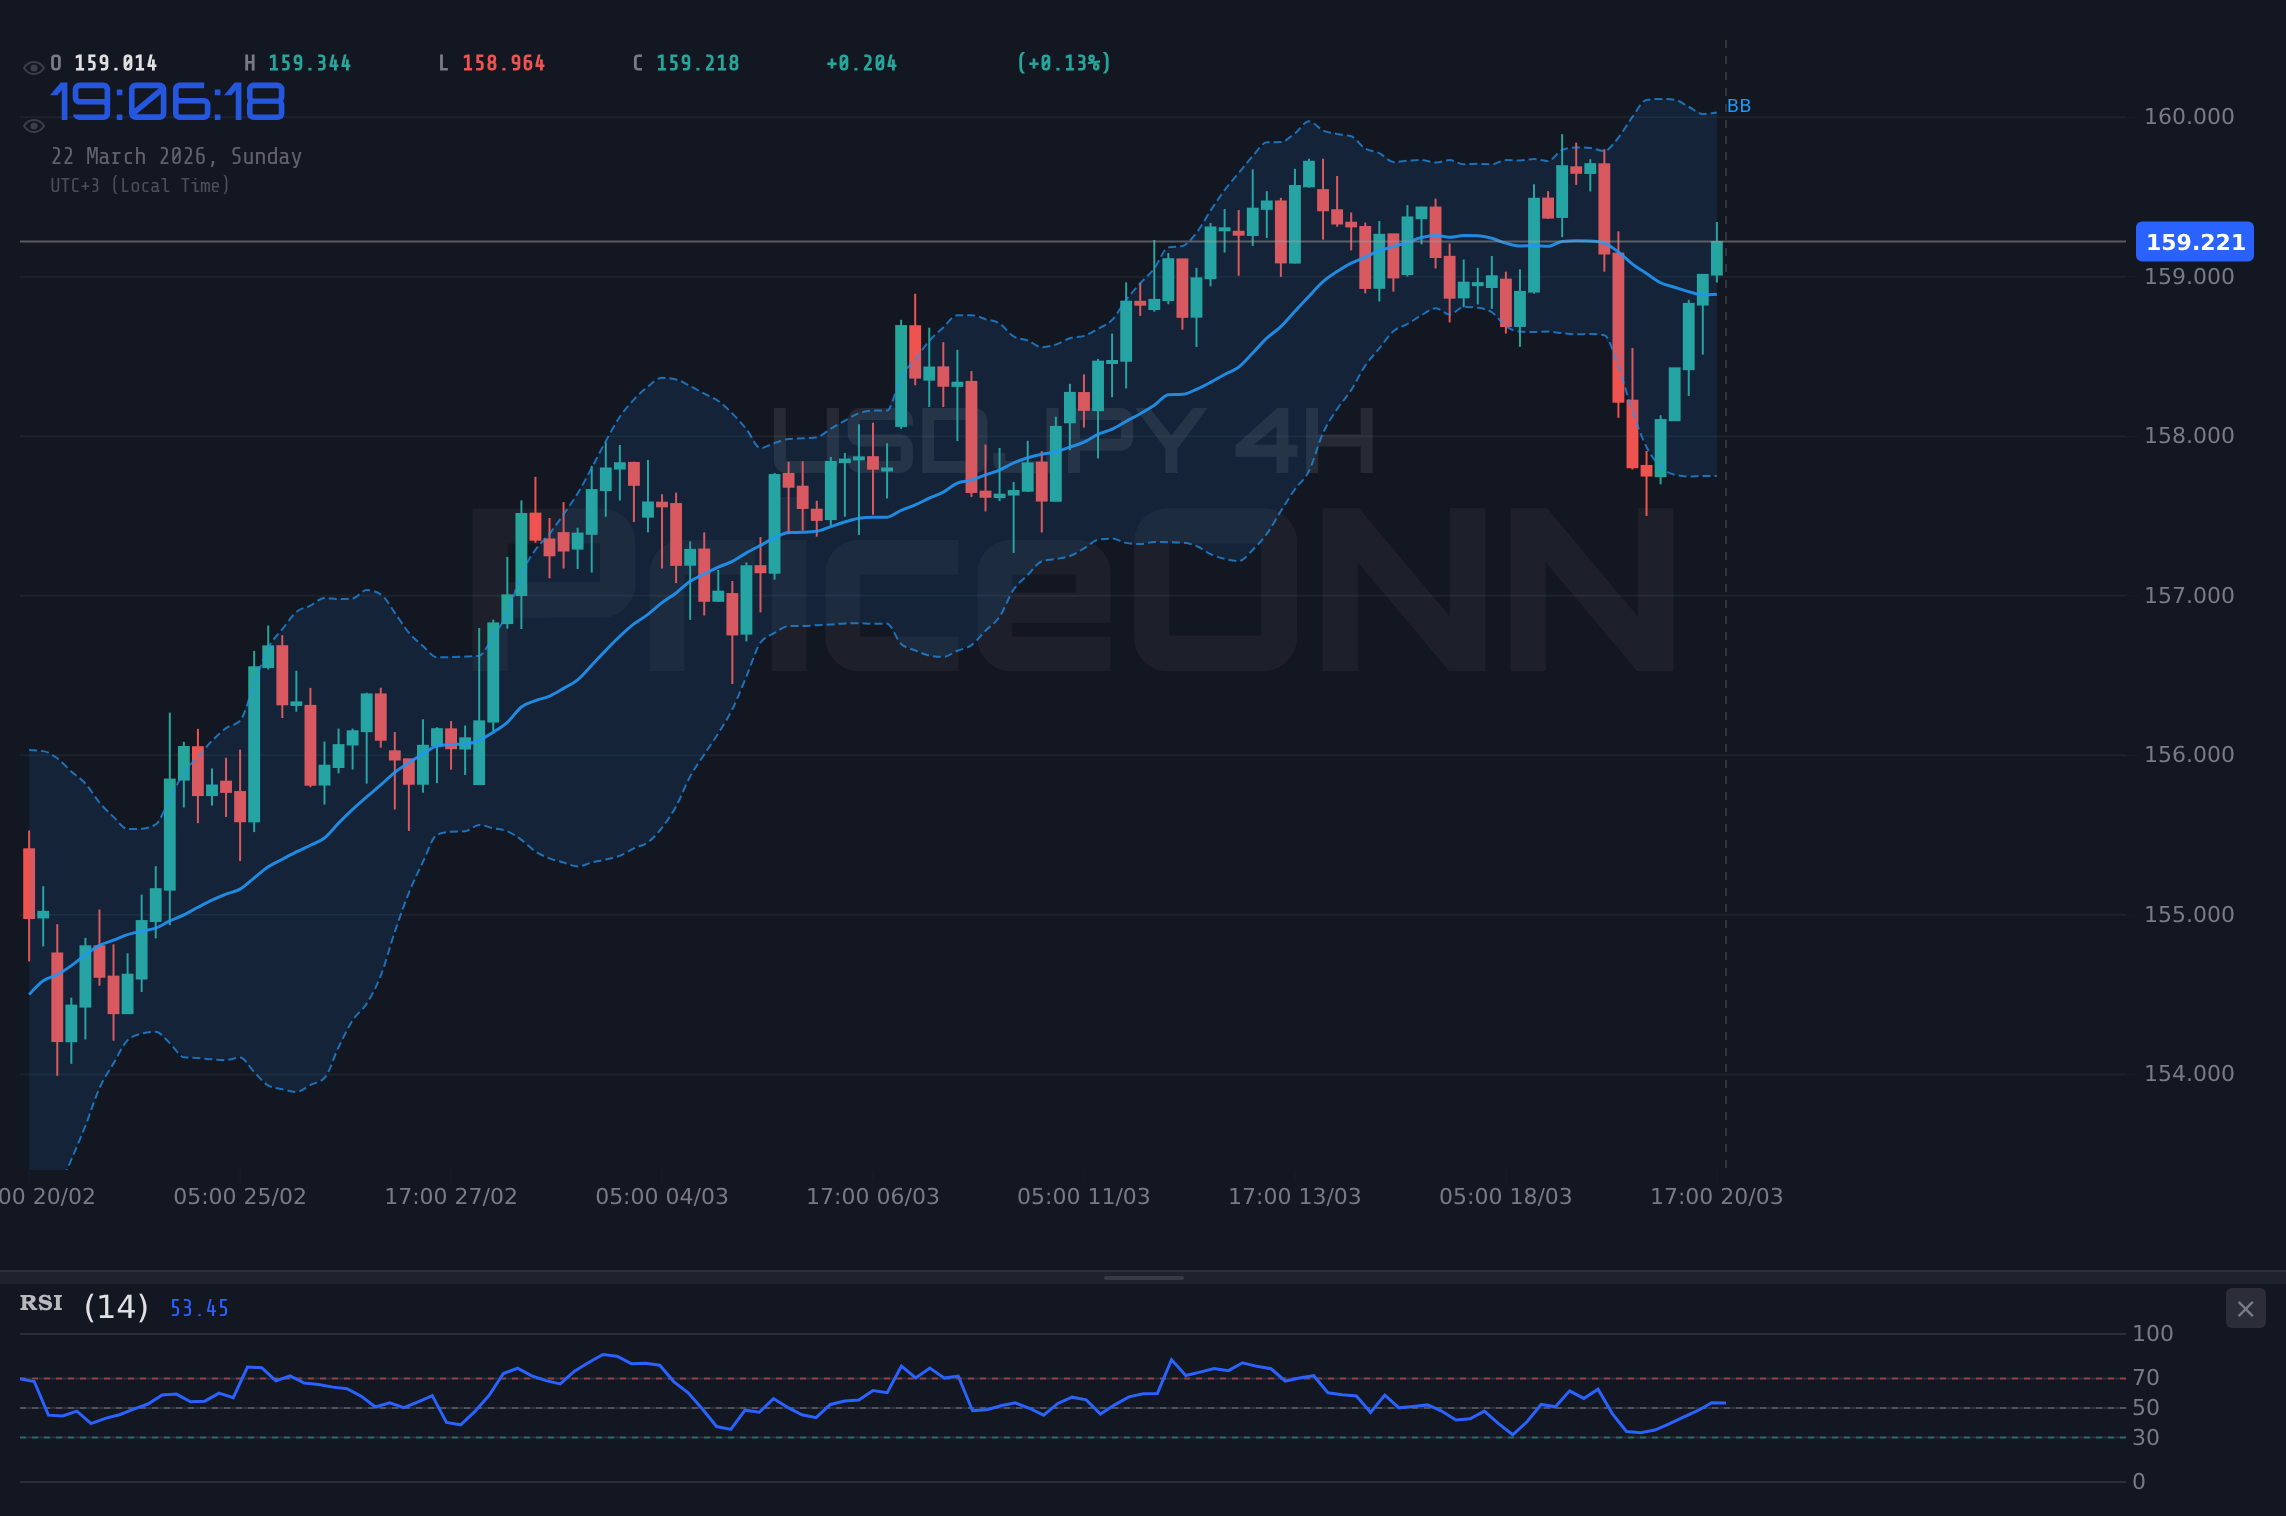
This past week has been characterized by a palpable sense of anticipation across financial markets. For USDJPY, the price action has been telling: a steady climb towards the critical $159.22 level, a zone where sellers have historically stepped in. The 1-hour chart shows a neutral trend with strong upward momentum (ADX 29.64), but the 4-hour and daily charts present a more nuanced picture, indicating a strong downtrend is still in play on the daily timeframe (ADX 37.37), despite short-term bullish signals. This suggests that while the immediate pressure is upward, the longer-term trend remains a significant headwind for further aggressive gains. The confluence of technical indicators, particularly the RSI readings hovering in the mid-50s on the daily chart (59.49), suggests room for upward movement but also warns of potential exhaustion if key resistance isn't decisively breached.
The broader market narrative is being significantly shaped by energy prices. The surge in Brent Crude to $112.54 and WTI to $98.39 highlights persistent inflationary pressures. This is not just a story about oil; it's a signal that global supply chain issues and geopolitical tensions, particularly concerning energy hubs like the Ras Laffan energy hub, continue to keep commodity prices elevated. The recent news about attacks on energy infrastructure adds another layer of complexity, potentially fueling demand for safe-haven assets or, conversely, reinforcing the narrative that central banks must remain vigilant against inflation. This backdrop is crucial for USDJPY because sustained high energy prices can complicate monetary policy decisions for both the Fed and the BoJ. If inflation remains sticky, it could force the Fed to maintain a hawkish stance for longer, supporting the dollar, while putting the BoJ in a difficult position as it considers exiting negative interest rates.
Navigating the Policy Divergence: Fed vs. BoJ
The most significant fundamental driver for USDJPY remains the stark contrast in monetary policy between the Federal Reserve and the Bank of Japan. While the Fed continues to signal a data-dependent approach, the market is pricing in fewer rate cuts for the year than initially anticipated. The CME FedWatch tool, though not explicitly provided here, reflects this sentiment with futures pricing indicating a lean towards a prolonged period of stable or slightly higher rates. This environment inherently supports the US dollar, creating upward pressure on USDJPY. On the other side of the trade, the BoJ recently signaled a potential pivot, hinting at a move away from negative interest rates. However, the pace and certainty of these policy shifts are still subject to considerable market debate. The Yen's strength has been inconsistent, often faltering when faced with strong dollar demand or renewed risk-off sentiment. This policy divergence is the bedrock upon which the current USDJPY trend is built, and any significant shift in either central bank's communication could trigger substantial volatility.
Technically, USDJPY is at a crucial juncture. The current price of $159.22 sits just below the 4-hour resistance level of $159.18 and the daily resistance of $159.23. A decisive break above these levels, particularly on significant volume, would be a strong bullish signal. The 1-hour chart shows a general buy signal, driven by strong momentum (ADX 29.64), with RSI at 63.4 and Stochastic %K at 87.93 nearing overbought territory. However, the longer-term daily chart paints a different picture. The ADX at 37.37 indicates a strong downtrend, and RSI at 44.34 suggests room for further downside before reaching oversold conditions. This conflict between short-term bullish signals and longer-term bearish trends highlights the choppiness of the market. The Stochastic oscillator on the daily chart (K=61.68, D=79.82) also presents a bearish signal, with %K below %D, suggesting potential downward pressure.
The strength of the Dollar Index (DXY) at 99.25 is a critical factor to consider. A rising DXY typically exerts downward pressure on currency pairs like EURUSD and GBPUSD, and consequently, can add to the bullish momentum for USDJPY. The DXY's current trend is mixed across timeframes: bullish on the daily (ADX 34.64) and 1-hour (ADX 22.31) charts, but showing a bearish inclination on the 4-hour chart. This mixed signal suggests that while the dollar has underlying strength, its path forward isn't entirely clear, which can translate into ranging or volatile price action for USDJPY. If the DXY breaks above its daily resistance of 99.72, it would likely provide a significant tailwind for USDJPY, pushing it towards higher levels. Conversely, a retreat in the DXY could coincide with a pullback in USDJPY.
Risk Sentiment and Safe-Haven Flows
Global risk sentiment plays a pivotal role in the dynamics of USDJPY, given the Yen's historical status as a safe-haven currency. When risk appetite is high (risk-on), investors tend to sell Yen and buy higher-yielding assets, pushing USDJPY higher. Conversely, during periods of heightened uncertainty or market stress (risk-off), the Yen often strengthens as capital flows back into perceived safety, leading to a decline in USDJPY. This past week, market sentiment has been somewhat mixed. The sharp decline in SP500 (down 1.2% to 6536.67) and Nasdaq100 (down 1.67% to 23986.8) on Friday suggests a waning risk appetite. This type of sell-off typically benefits the Yen. However, the simultaneous strength in the DXY and the upward move in oil prices complicate the picture. While equities are falling, the dollar is also showing resilience, which is an unusual combination. This suggests that the Yen's safe-haven appeal might be tempered by other factors, such as the interest rate differential and the specific geopolitical risks driving the market turmoil. The continued strength in commodities like Brent Crude, trading at $112.54, signals underlying inflationary concerns that could keep central banks cautious, potentially leading to a more risk-averse environment which historically supports the Yen.
Looking at the technicals across different timeframes offers a clearer, albeit complex, picture. On the 1-hour chart, the trend is neutral but showing upward momentum with an ADX of 29.64. RSI is at 63.4, suggesting bullish sentiment but not yet overbought. Stochastic %K at 87.93 is nearing overbought territory, hinting at a potential short-term pause or pullback. The 4-hour chart also shows a neutral trend, but with a much weaker ADX of 19.58, indicating a lack of strong directional conviction. RSI is at 54.99, and Stochastic %K (65.73) is above %D (33.7), showing a bullish signal, but the divergence here needs careful watching. The daily timeframe, however, is where the caution truly sets in. The trend is classified as neutral with 50% power, but the ADX at 37.37 indicates a strong downtrend is in place. RSI at 44.34 suggests more downside potential before hitting oversold conditions. The Stochastic oscillator on the daily chart (K=61.68, D=79.82) also presents a bearish signal, with %K below %D, reinforcing the idea that despite short-term rallies, the longer-term outlook might still favor bears if key resistance holds.
The Battle for $159.22: Support vs. Resistance
The $159.22 price point for USDJPY is more than just a number; it represents a critical battleground between buyers and sellers. On the hourly chart, resistance is seen at $159.42, $159.50, and $159.62. Support lies at $159.22, $159.10, and $159.02. For the bulls to gain sustained control, a clear break and hold above the $159.50 to $159.60 area is essential. This would negate the bearish signals from the daily chart and potentially target higher levels. Conversely, a failure to break through this resistance, coupled with a drop below the hourly support at $159.10, could signal a reversal. The 4-hour chart shows support at $158.67, $158.34, and $158.17, and resistance at $159.18, $159.34, and $159.68. The daily chart presents stronger support levels at $156.89, $156.02, and $154.55, with significant resistance overhead at $159.23, $160.70, and $161.57. The proximity of the current price to the daily resistance is a key technical observation.
The recent market news flow also adds context. While specific blog posts from PriceONN are not detailed, the market news from the past week highlights a recurring theme: USDJPY testing levels around 158.30 and 158.00, with mentions of broad Yen strength despite BoJ hawkish signals. This suggests that the market is indeed grappling with the conflicting signals from the BoJ and the Fed. The news that the BoJ left interest rates unchanged at 0.75% on March 19th, while signaling potential future hikes, created Yen weakness initially, but subsequent dollar strength and risk aversion have kept the pair volatile. The question of whether USDJPY is poised for a rebound hinges on the dollar's ability to sustain its footing against the Yen's policy divergence. The continued strength in oil prices, as reported, also plays into this, as it fuels inflation fears and could influence Fed policy, thereby indirectly impacting USDJPY.
The energy sector's performance this week provides a compelling backdrop. Brent Crude's rally to $112.54 and WTI's surge to $98.39 are not isolated events. They reflect a global energy market tightening due to geopolitical factors, such as the attacks on Qatar's Ras Laffan energy hub. This surge in energy prices has significant implications for inflation expectations worldwide. If these elevated energy costs persist, they could force central banks, including the Fed, to adopt a more hawkish stance than currently anticipated. For USDJPY, this would mean continued dollar strength and upward pressure on the pair. The debate around nuclear power's role in filling the gap left by oil and gas prices, as highlighted in recent energy news, points to long-term structural shifts in the energy landscape, but the immediate impact of high oil prices is inflationary, which tends to benefit dollar-yen.
The Technical Tightrope: Daily Divergence
When we zoom out to the daily timeframe, the technical picture for USDJPY becomes particularly interesting, and frankly, cautionary. The ADX stands at a robust 37.37, confirming a strong downtrend is in force. This is in stark contrast to the short-term hourly and even 4-hour charts, which show more neutral or bullish momentum. The RSI(14) at 44.34 on the daily chart indicates that while the pair has moved away from oversold territory, it is still well below the midpoint, suggesting more room for downside before a significant reversal could be expected. The MACD is also below its signal line, confirming negative momentum on this longer timeframe. The Stochastic oscillator, with %K at 61.68 and %D at 79.82, presents a bearish crossover signal, with %K falling below %D, further reinforcing the bearish sentiment on a daily basis. This technical divergence across timeframes - bullish signals on shorter frames versus bearish signals on the daily - is a classic sign of market indecision or a potential turning point. Traders are caught between the immediate upward push from dollar strength and the longer-term trend driven by Yen weakness against a backdrop of potential policy shifts.
The correlation with other major markets is also telling. The DXY, currently at 99.25, is showing a bullish trend on the daily chart (ADX 34.64) and a mixed picture on the 4-hour. A strong DXY typically supports USDJPY. However, the simultaneous weakness in major equity indices like the S&P 500 (down 1.2% to 6536.67) and Nasdaq 100 (down 1.67% to 23986.8) suggests a risk-off environment. In such scenarios, the Yen usually strengthens. This creates a conflict: dollar strength pushing USDJPY up, while risk aversion pulls it down. This tug-of-war is precisely why the pair is hovering near resistance. The market is trying to reconcile these opposing forces. If the equity sell-off intensifies, it could trigger significant Yen buying, overriding the dollar's strength and pushing USDJPY lower, regardless of the Fed's hawkish posture. The current ADX readings across timeframes (1H: 29.64, 4H: 19.58, 1D: 37.37) illustrate this choppiness, with strong trends appearing and disappearing across different chart intervals. The 4-hour ADX's low value is particularly indicative of a lack of clear direction over that timeframe.
Key Levels to Watch This Week
As we head into the close of the week and look towards the next, the levels identified on the charts become paramount. For USDJPY, the $159.22 current price is the immediate focal point. A sustained move above the daily resistance cluster around $159.23-$160.70 is needed to confirm a bullish breakout. Specifically, clearing the $159.50-$159.60 resistance on the hourly and 4-hour charts would be the first sign of strength. Key support levels to monitor on the downside include $159.10 (1H), $158.67 (4H), and crucially, the daily support zone beginning at $156.89. A break below $156.89 would invalidate the short-term bullish thesis and likely signal a deeper correction. The strength of the trend, as indicated by ADX, varies significantly across timeframes, underscoring the need for patience and confirmation before committing to a trade. The daily ADX of 37.37 suggests that any move, up or down, could be significant if it gains momentum.
The narrative around inflation, driven by the energy price surge, cannot be ignored. With Brent Crude at $112.54 and WTI at $98.39, the inflationary impulse is clear. This puts central banks in a difficult position. If the Fed feels compelled to maintain a hawkish bias due to persistent inflation, the dollar will likely remain firm, supporting USDJPY. However, if inflation proves transitory or if global growth concerns dominate, the Fed might be forced to pivot sooner, which could weaken the dollar and pressure USDJPY downwards. The BoJ's policy path remains a significant wildcard. Any concrete steps towards normalization would strengthen the Yen, potentially causing a sharp reversal in USDJPY, especially if it occurs near current resistance levels. The market is essentially waiting for clearer signals from both central banks, and until then, expect continued volatility around the $159.22 mark.
The interplay between the DXY and USDJPY is also critical. At 99.25, the DXY is showing signs of life, particularly on the daily chart. If the DXY can push towards its daily resistance of 99.72, it would provide a strong tailwind for USDJPY. However, the mixed signals from the 4-hour chart (ADX 19.43, weak trend) suggest this upward move might not be straightforward. The correlation between equity markets and USDJPY is also key. The recent sell-off in SP500 and Nasdaq100 indicates a shift towards risk aversion. If this trend continues, the Yen could benefit from safe-haven flows, putting downward pressure on USDJPY, even if the dollar remains broadly strong. Traders will be watching to see if the safe-haven narrative overrides the interest rate differential narrative in the coming days.
Bearish Scenario: Yen Strength Returns
40% ProbabilityNeutral Scenario: Range-Bound Consolidation
50% ProbabilityBullish Scenario: Dollar Dominance
10% ProbabilityFrequently Asked Questions: USDJPY Analysis
What happens if USDJPY fails to break above $159.60 resistance?
If USDJPY fails to break above the $159.50-$159.60 resistance zone, a bearish scenario becomes more probable. This could lead to a pullback towards the $158.67 support level, especially if risk aversion increases and Yen safe-haven flows re-emerge.
Should I consider buying USDJPY at current levels near $159.22 given the mixed signals?
Buying USDJPY at current levels carries risk due to strong daily downtrend signals and proximity to resistance. A confirmation of a bullish breakout above $159.60, supported by a rising DXY and positive risk sentiment, would be a more prudent entry condition. Otherwise, waiting for a pullback to stronger support levels like $156.89 might offer better risk-reward.
Is the RSI at 44.34 on the daily chart a sell signal for USDJPY?
An RSI of 44.34 on the daily chart is not an extreme sell signal but indicates a bearish leaning, suggesting more downside potential before hitting oversold territory. It aligns with the overall strong downtrend indicated by the daily ADX of 37.37, reinforcing caution against aggressive bullish positions at current resistance.
How will the ongoing strength in oil prices affect USDJPY this week?
The continued surge in oil prices, with Brent at $112.54, fuels inflation concerns globally. This could prompt the Federal Reserve to maintain a hawkish stance, supporting the US dollar and consequently USDJPY. However, if oil-driven inflation leads to global growth fears, it might trigger safe-haven flows into the Yen, potentially pressuring USDJPY lower despite dollar strength.
Track markets in real-time
AI-powered analysis, technical indicators and real-time price data.
Join Our Telegram Channel
Breaking market news, AI analysis and trading signals instantly.
Join Channel