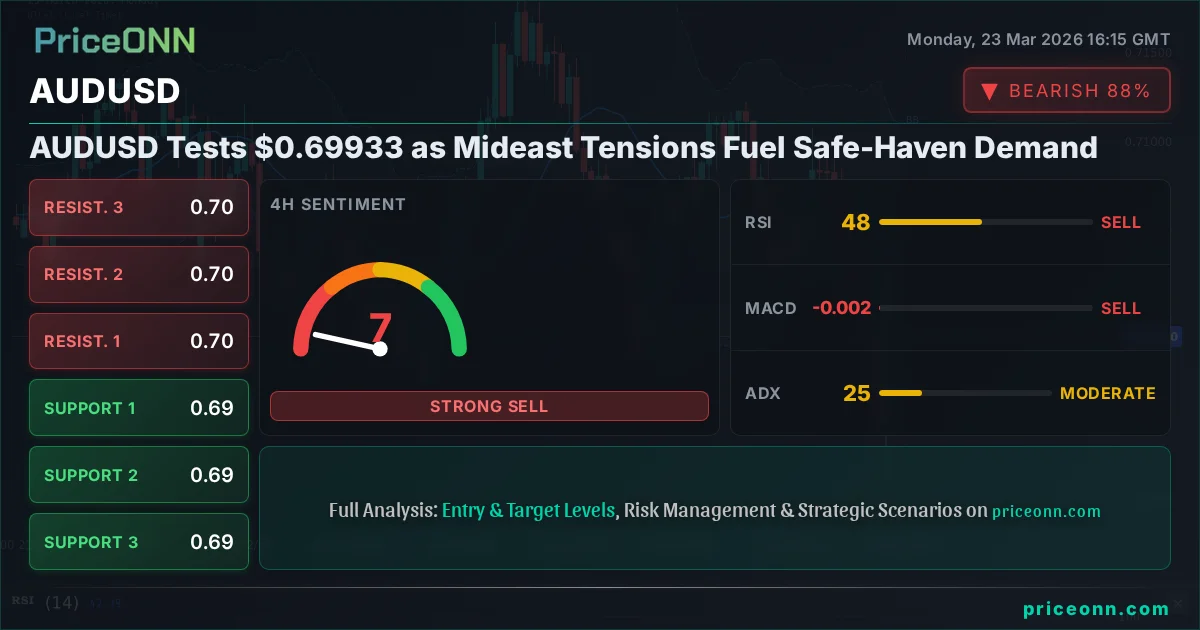
AUDUSD Tests $0.69933 as Mideast Tensions Fuel Safe-Haven Demand
AUDUSD hovers around $0.69933, pressured by escalating geopolitical risks and a strengthening US Dollar. Technicals show a mixed picture with key levels to watch.
The Australian Dollar is facing headwinds, with the AUDUSD pair currently testing the critical psychological level of $0.69933. This pressure stems from a potent cocktail of escalating geopolitical tensions in the Middle East, which are bolstering demand for safe-haven assets like the US Dollar, and a technically mixed picture for the Aussie itself. As traders navigate these choppy waters, understanding the interplay between global risk sentiment, currency correlations, and AUDUSD's own chart patterns becomes paramount for discerning potential future price action.
- AUDUSD is trading at $0.69933, testing key support amid rising geopolitical risks.
- The US Dollar Index (DXY) is showing strength, currently at 99.1, adding pressure to risk-sensitive currencies like the AUD.
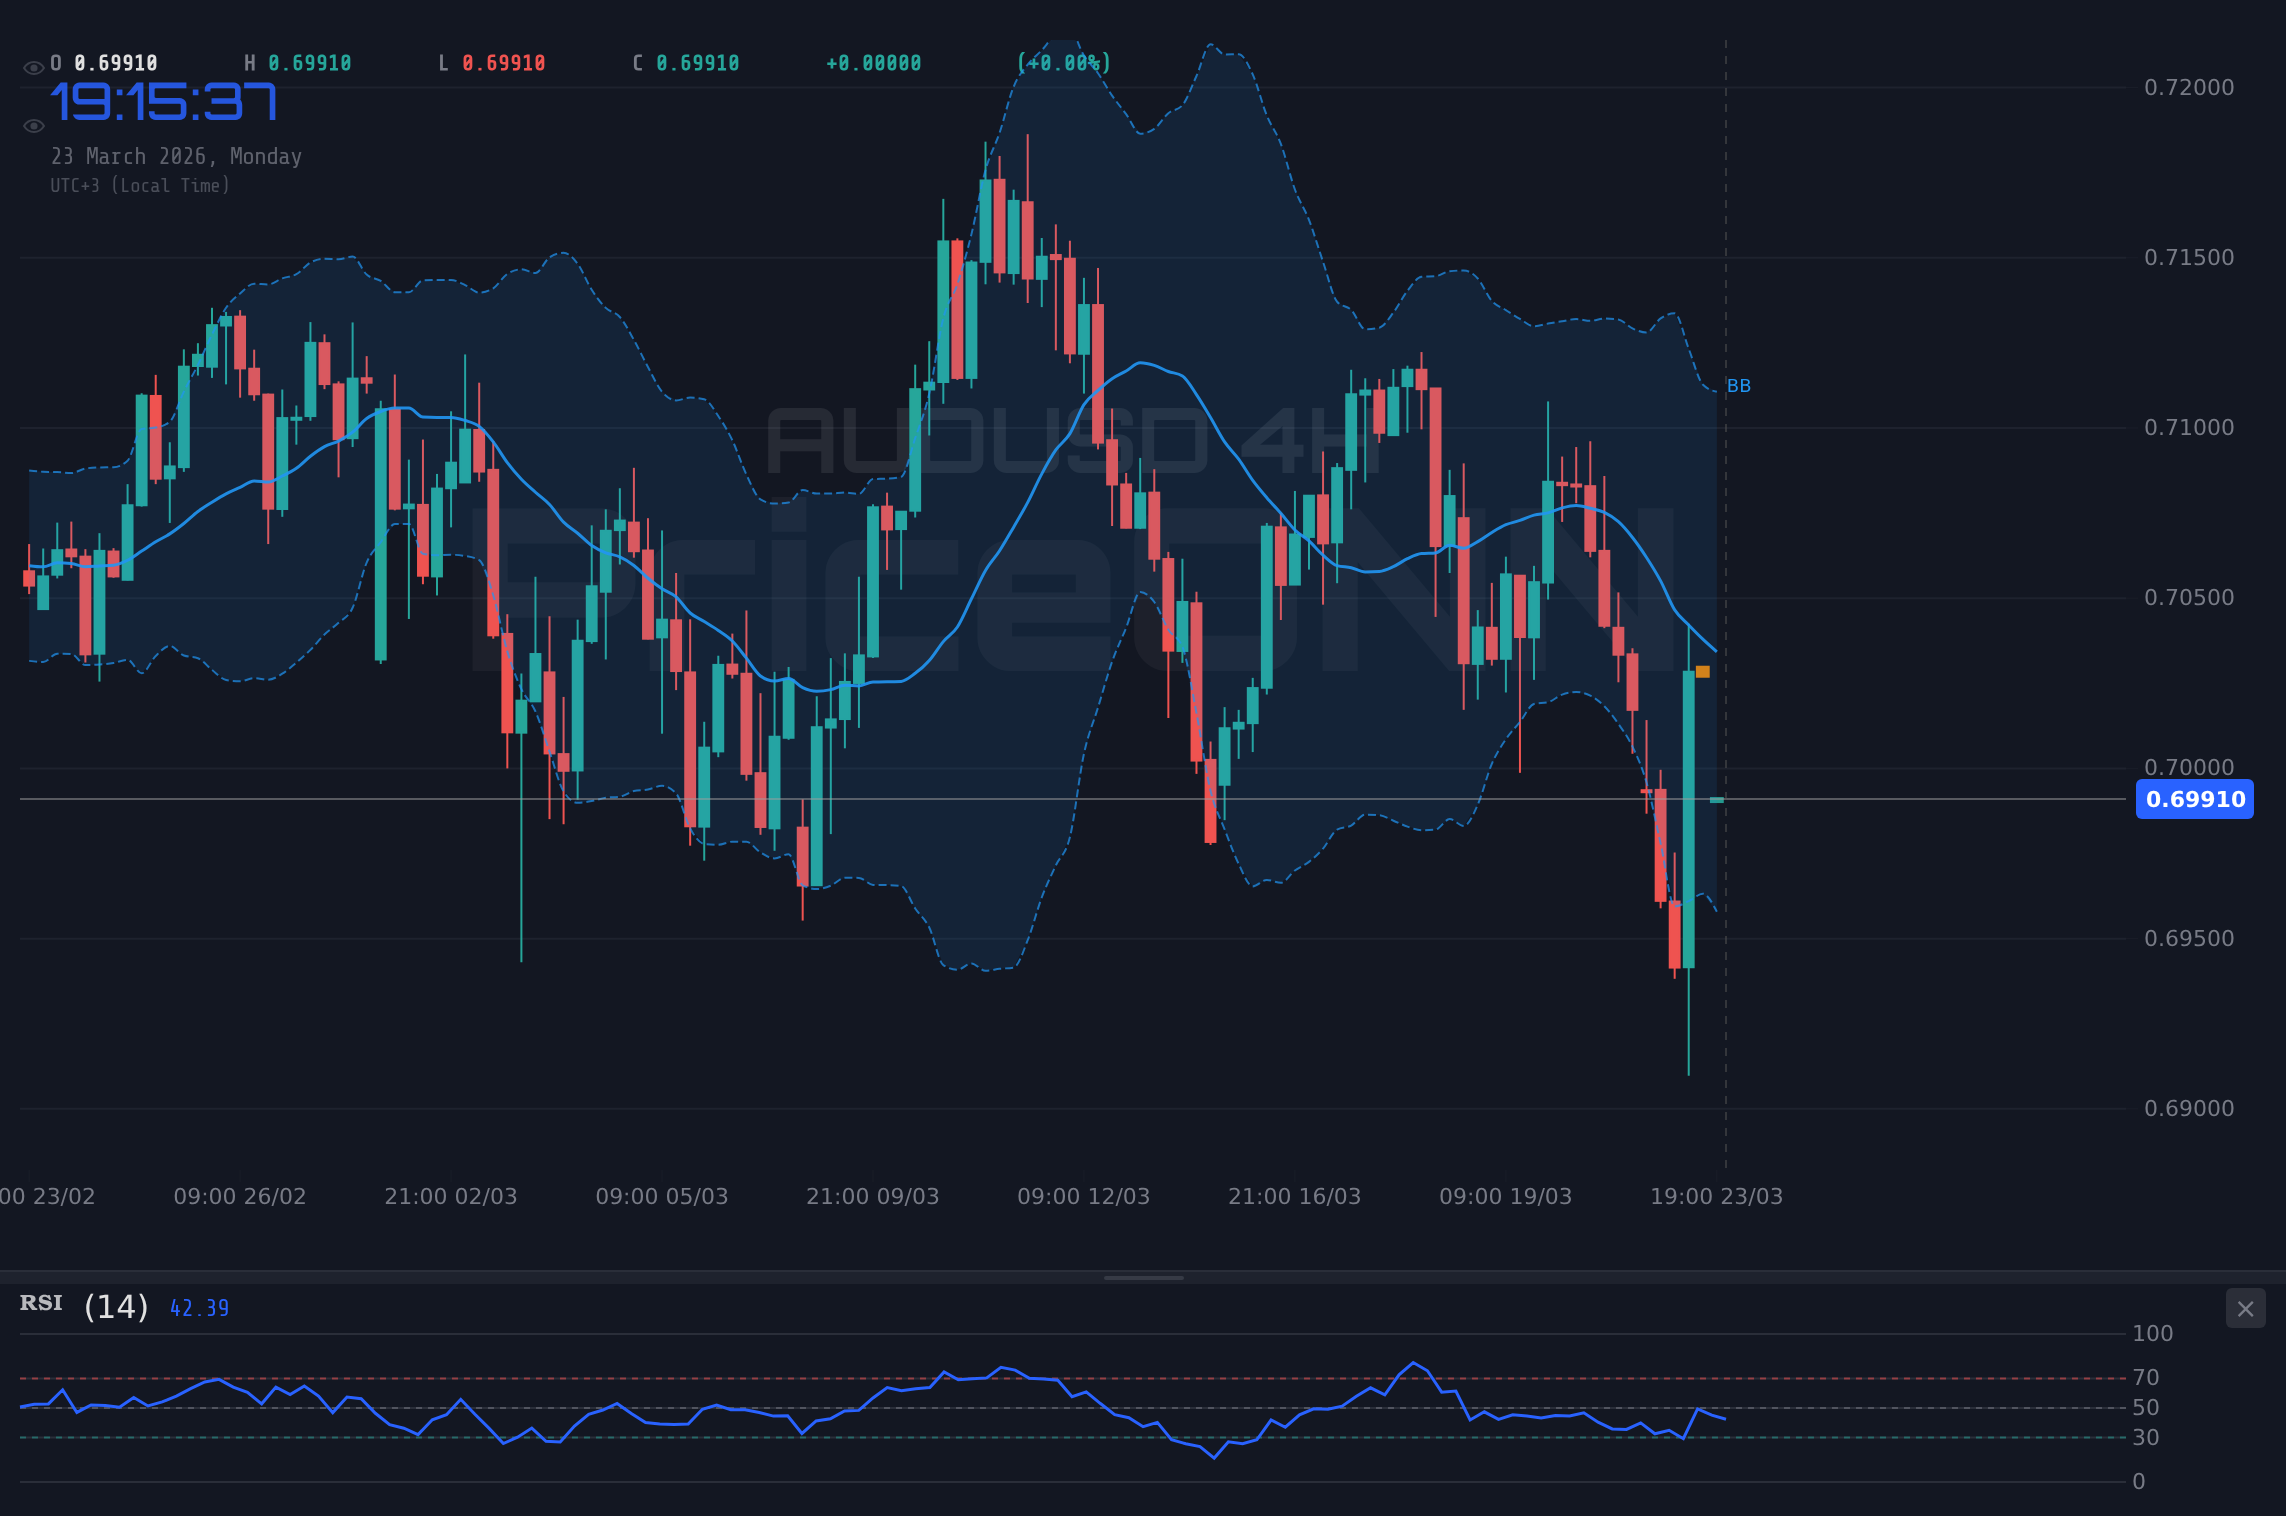
- On the 1-hour chart, RSI at 45.7 signals a bearish lean, while the 4-hour chart shows a strong downtrend with ADX at 65.39.
- Key support levels for AUDUSD are identified at 0.69871 and 0.6909, with resistance seen at 0.70816 and 0.7170.
- Geopolitical fears are driving safe-haven demand, impacting AUDUSD's correlation with broader market risk appetite.
Global Risk Sentiment Shifts Dramatically
The global financial landscape is currently dominated by a palpable shift towards risk aversion. Escalating tensions in the Middle East have sent shockwaves through markets, prompting a knee-jerk reaction towards safety. This geopolitical instability is not just a regional concern; it has direct implications for global supply chains, particularly in the energy sector. As fears of supply disruptions mount, oil prices are experiencing significant volatility, adding another layer of uncertainty to the economic outlook. This heightened risk environment invariably strengthens the appeal of traditional safe-haven currencies, with the US Dollar at the forefront.
The US Dollar Index (DXY), a key barometer of the dollar's strength against a basket of major currencies, is currently trading around 99.1. While the intraday change shows a slight dip of -0.17%, the underlying demand for the greenback remains robust due to its safe-haven status. This strengthening dollar creates a challenging environment for riskier assets and commodity-linked currencies like the Australian Dollar. The AUDUSD pair's struggle to hold above the $0.69933 mark is a direct reflection of this risk-off sentiment and the dollar's resurgence. Traders are closely monitoring headlines from the Middle East, as any further escalation could intensify selling pressure on AUDUSD.
The correlation between the DXY and AUDUSD is a critical factor to watch. Historically, a rising DXY often spells trouble for AUDUSD, as the dollar's strength makes the Australian Dollar relatively more expensive for holders of USD. This inverse relationship is currently playing out, with the dollar's safe-haven appeal overshadowing any fundamental positives that might otherwise support the Aussie. The market's focus has clearly shifted from growth prospects to geopolitical stability, and until this narrative changes, the AUDUSD pair is likely to remain under pressure.
AUDUSD: A Technical Tightrope Walk
Delving into the technicals for AUDUSD reveals a complex picture, painting a narrative of caution and potential for further downside if key levels fail. On the 1-hour chart, the trend is described as neutral with a power of 50%, but the Relative Strength Index (RSI) at 45.7 suggests a bearish bias within this neutrality, indicating that sellers are currently holding a slight edge. The MACD indicator, while showing positive momentum, is dancing around the signal line, offering no clear directional conviction on this shorter timeframe. However, the Bollinger Bands are hugging the middle band, hinting at consolidation rather than a strong directional move in the immediate term.
The picture becomes significantly more bearish when we shift to the 4-hour timeframe. Here, the trend is decidedly bearish with a power of 100%. The RSI at 28.43 is deep in oversold territory, suggesting that while the selling pressure has been intense, a potential bounce could be on the cards. However, the Average Directional Index (ADX) at a formidable 65.39 confirms a very strong existing downtrend. This indicates that any short-term rallies are likely to be met with renewed selling pressure as the dominant trend asserts itself. The Stochastic oscillator, despite showing a crossover with %K above %D, is still in oversold territory, offering a weak bullish signal against a very strong bearish backdrop.
The daily chart presents a similar story of bearish dominance, albeit with slightly less conviction than the 4-hour. The trend is classified as bearish with 94% power. The RSI at 27.02 is again deep in oversold conditions, presenting a potential contrarian buying opportunity for longer-term investors, but a clear warning for short-term traders. The MACD remains below its signal line, reinforcing the bearish momentum. The ADX at 22.26 indicates a moderately strong trend, less intense than the 4-hour but still significant. The Stochastic on the daily chart is also in oversold territory, flashing a potential buy signal, but this must be viewed with extreme caution given the prevailing downtrend and the broader market's risk-off sentiment.
Navigating Key Price Levels
With AUDUSD hovering precariously around the $0.69933 mark, the immediate price action will be dictated by how these key support and resistance levels are handled. On the 1-hour chart, the first level of support is located at $0.69871. A decisive break below this level would likely trigger further selling, potentially targeting the subsequent support at $0.6909. Conversely, if the bulls manage to regain control, resistance will be encountered first at $0.70816, followed by $0.7170. The inability of the price to decisively break through these levels suggests a market in consolidation, waiting for a stronger catalyst.
The longer-term support levels on the 4-hour and daily charts are significantly lower, highlighting the extent of the bearish pressure seen recently. Support on the 4-hour chart is identified at $0.6928, $0.69146, and $0.68909. These levels represent significant price floors that, if breached, could signal a deeper retracement. Resistance on these longer timeframes looms at $0.70022 on the 4-hour chart and $0.70741 on the daily chart. The proximity of the current price to these levels underscores the importance of the $0.69933 area as a battleground between buyers and sellers. A close above $0.70022 on the 4-hour chart could signal a short-term reprieve, but sustained strength above $0.70741 would be needed to challenge the broader bearish narrative.
The current market sentiment, heavily influenced by geopolitical events, suggests that downside risks may be more prevalent in the short term. Any negative news from the Middle East could easily push AUDUSD below the immediate support levels. Traders are therefore advised to watch for confirmation before initiating trades. A break below $0.69871 on the 1-hour chart could be a signal for short positions, targeting $0.6909. Conversely, a sustained move above $0.70816 might indicate a potential short-covering rally, but this would need to be confirmed by a shift in broader market sentiment and a weakening of the US Dollar.
The Interplay of Global Markets
The AUDUSD's performance cannot be viewed in isolation. Its fate is intrinsically linked to the broader macroeconomic and geopolitical environment. The current surge in oil prices, with Brent crude hovering around $103 and WTI near $90.98, is a significant factor. While these elevated levels might typically support commodity-linked currencies, the overriding concern is their inflationary impact and the potential for central banks to respond with more aggressive tightening. This dynamic complicates the outlook for AUDUSD, as higher oil prices simultaneously signal potential inflation but also economic headwinds if demand destruction occurs.
The performance of major indices like the S&P 500 and Nasdaq also provides crucial context. With the S&P 500 currently trading at 6597.55 and Nasdaq at 24229.22, both showing intraday gains, there's a slight disconnect from the prevailing risk-off narrative driven by geopolitical fears. This divergence suggests that while caution is warranted, the equity markets are not yet fully pricing in a severe global downturn. However, any significant negative news from the Middle East could quickly reverse this sentiment, leading to a sell-off in equities and a further strengthening of the US Dollar, which would undoubtedly weigh on AUDUSD.
Furthermore, the performance of other major currency pairs offers insights. The EURUSD is trading at 1.15863, showing some resilience, while USDJPY is at 158.695, reflecting ongoing yen weakness perhaps due to the Bank of Japan's accommodative stance. The GBPUSD, at 1.33858, is showing strength, suggesting a degree of UK-specific positive sentiment. However, the overarching influence of the DXY's safe-haven bid is likely to cap the upside for most risk-sensitive pairs, including AUDUSD, regardless of individual currency dynamics. The market is currently in a 'US Dollar first' mode, where the greenback's direction dictates the sentiment for many other currency pairs.
Trade Scenarios and Outlook
Given the confluence of bearish technical signals on AUDUSD, the persistent geopolitical risks, and the strengthening US Dollar, the immediate outlook leans towards caution, with a bias towards further downside potential. The ADX on the 4-hour chart at 65.39 is particularly concerning, indicating a very strong established downtrend that is difficult to fight in the short term. While the RSI and Stochastic on multiple timeframes are flashing oversold signals, suggesting a potential for a bounce, the broader market sentiment and the strength of the DXY make such bounces susceptible to quick reversals.
Bearish Scenario: Downside Pressure Mounts
65% ProbabilityNeutral Scenario: Consolidation Around $0.69933
25% ProbabilityBullish Scenario: Short-Covering Rally
10% ProbabilityThe prevailing sentiment and technical setup strongly favor the bearish scenario in the near term. The key trigger for a further downside move would be a decisive break below the 1-hour support at $0.69871. This could open the door to targets at $0.6909 and potentially down to the 4-hour support at $0.68909. Invalidation of this bearish thesis would occur if AUDUSD manages to break and hold above the 1-hour resistance at $0.70816, suggesting a potential short-covering rally. However, given the current risk-off environment, such a move would likely require a significant shift in global sentiment or a notable weakening of the US Dollar.
The neutral scenario hinges on the pair consolidating around the current $0.69933 level, perhaps oscillating between the immediate 1-hour support and resistance. This could occur if market participants await clearer signals from the geopolitical front or upcoming economic data. Without a strong directional catalyst, AUDUSD might remain range-bound for a period, offering limited trading opportunities. The bullish scenario, while currently having a low probability (10%), would require a strong catalyst, such as de-escalation in the Middle East or a significant dovish shift in Fed policy expectations, to push AUDUSD decisively above key resistance levels.
What Lies Ahead for AUDUSD?
Looking forward, the trajectory of AUDUSD will largely be dictated by developments in the Middle East and the subsequent impact on global risk appetite and the US Dollar's strength. Any further escalation of tensions could lead to increased demand for the greenback, pushing AUDUSD lower towards its established support levels. Conversely, a de-escalation or diplomatic resolution would likely trigger a relief rally, potentially boosting AUDUSD as risk sentiment improves.
Economic data releases will also play a crucial role. While specific upcoming events were not detailed in the provided context, traders will be keenly watching any inflation or employment data from Australia and the United States. Stronger-than-expected US data could further bolster the dollar, while weaker data might offer some respite to AUDUSD. Similarly, any indication from the Reserve Bank of Australia (RBA) regarding its monetary policy stance, especially in light of global inflationary pressures, will be closely scrutinized. The keywords 'aud usd 0.7200 target' and 'audusd fundamentals' are gaining traction, suggesting that while the current focus is on risk aversion, longer-term fundamental drivers and potential upside targets are still on the radar for some market participants.
Frequently Asked Questions: AUDUSD Analysis
What happens if AUDUSD breaks below the $0.69871 support level?
A break below $0.69871 on the 1-hour chart would likely trigger further selling pressure. The next key targets would be $0.6909 on the 1-hour timeframe, and potentially down to the more significant 4-hour support at $0.68909, especially if broader market risk aversion intensifies.
Should I consider buying AUDUSD at current levels around $0.69933 given the oversold RSI?
While the RSI is oversold on multiple timeframes (45.7 on 1H, 28.43 on 4H, 27.02 on 1D), initiating long positions at current levels is risky due to the strong bearish trend (ADX 65.39 on 4H) and ongoing geopolitical uncertainty. A confirmed break above 1-hour resistance at $0.70816 would be a more prudent entry trigger for a potential bounce.
Is the ADX at 65.39 on the 4-hour chart a definitive sell signal for AUDUSD?
An ADX reading of 65.39 signifies a very strong trend, which in this case is bearish. While it confirms the strength of the current downtrend, it doesn't necessarily signal an immediate entry point itself. It indicates that any attempts to trade against this strong trend are likely to be met with significant resistance.
How will escalating Middle East tensions affect AUDUSD in the coming week?
Escalating tensions typically increase demand for the US Dollar as a safe-haven asset, which would likely put further downward pressure on AUDUSD. If tensions de-escalate, we could see a risk-on rally, potentially lifting AUDUSD towards resistance levels like $0.70816, but this is contingent on geopolitical developments.
| Indicator | Value | Signal | Interpretation |
|---|---|---|---|
| RSI (14) | 45.7 | Bearish Lean | Nearing oversold on 1H, but still in neutral zone. |
| MACD Histogram | 0.0000 | Neutral | Momentum is flat near the signal line on 1H. |
| Stochastic | 82.47 | Bullish Crossover | %K > %D, but nearing overbought on 1H. |
| ADX | 38.39 | Strong Trend | Confirms a strong trend on 1H, currently downwards bias. |
| Bollinger Bands | Mid Band | Watch | Price is trading around the middle band on 1H. |
Track markets in real-time
AI-powered analysis, technical indicators and real-time price data.
Join Our Telegram Channel
Breaking market news, AI analysis and trading signals instantly.
Join Channel