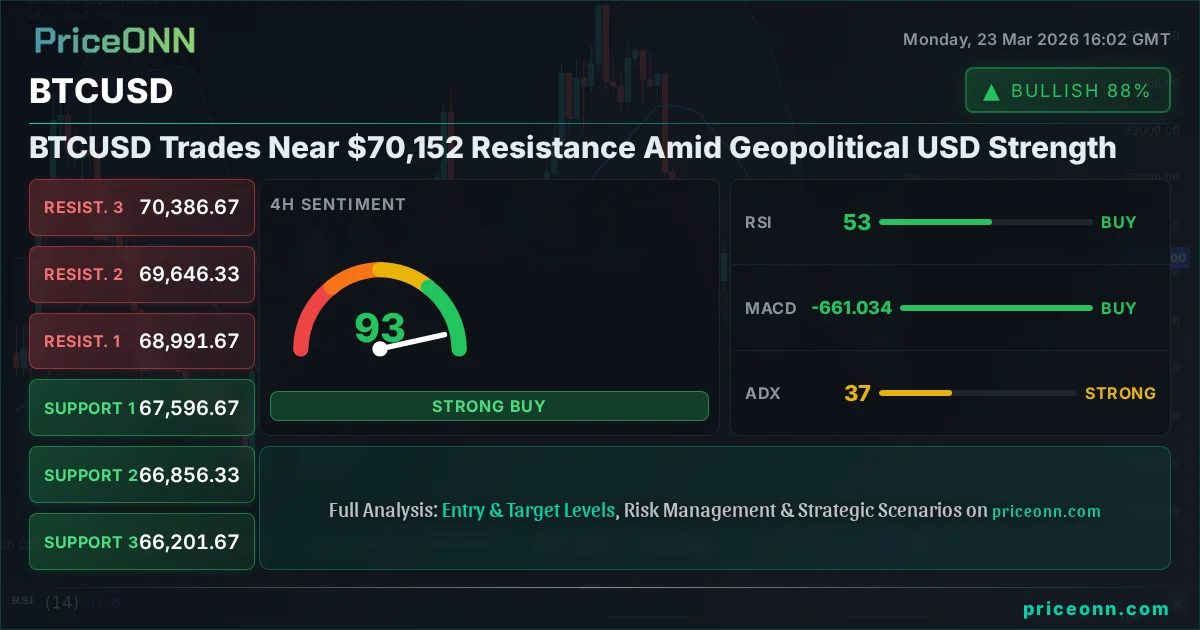
BTCUSD Trades Near $70,152 Resistance Amid Geopolitical USD Strength
BTCUSD hovers near $70,152 as escalating Middle East tensions boost the US Dollar, creating a complex trading environment. Key levels to watch.
The digital asset landscape is currently dominated by a fascinating tug-of-war, with Bitcoin (BTCUSD) finding itself at a critical juncture near the $70,152 mark. As geopolitical tensions flare in the Middle East, the US Dollar (DXY) is exhibiting strength, a dynamic that historically casts a long shadow over risk assets like Bitcoin. This interplay between safe-haven demand for the dollar and the risk appetite for cryptocurrencies creates a delicate balance, and understanding these cross-market correlations is paramount for navigating the current choppy waters. With the DXY hovering around 99.13, its recent movements suggest a potential headwind for assets typically sensitive to dollar strength, including gold and major forex pairs, and by extension, digital assets.
- RSI at 44.35 on BTCUSD's 1-hour chart signals neutral momentum, leaning towards a bearish tilt as it hovers below the 50 mark.
- Critical support for BTCUSD sits at $67,596.67 on the 4H chart, a level tested multiple times this week.
- The ADX at 37.14 on the 4H chart indicates a strong trend, but its alignment with RSI and MACD needs careful watching for confirmation.
- The correlation with a strengthening DXY (currently at 99.13) presents a potential headwind for BTCUSD, as seen in the inverse relationship with gold's fall to $4,369.69.
The Bull's Roadmap: Breaking Through $70,152
Navigating the Resistance Zone
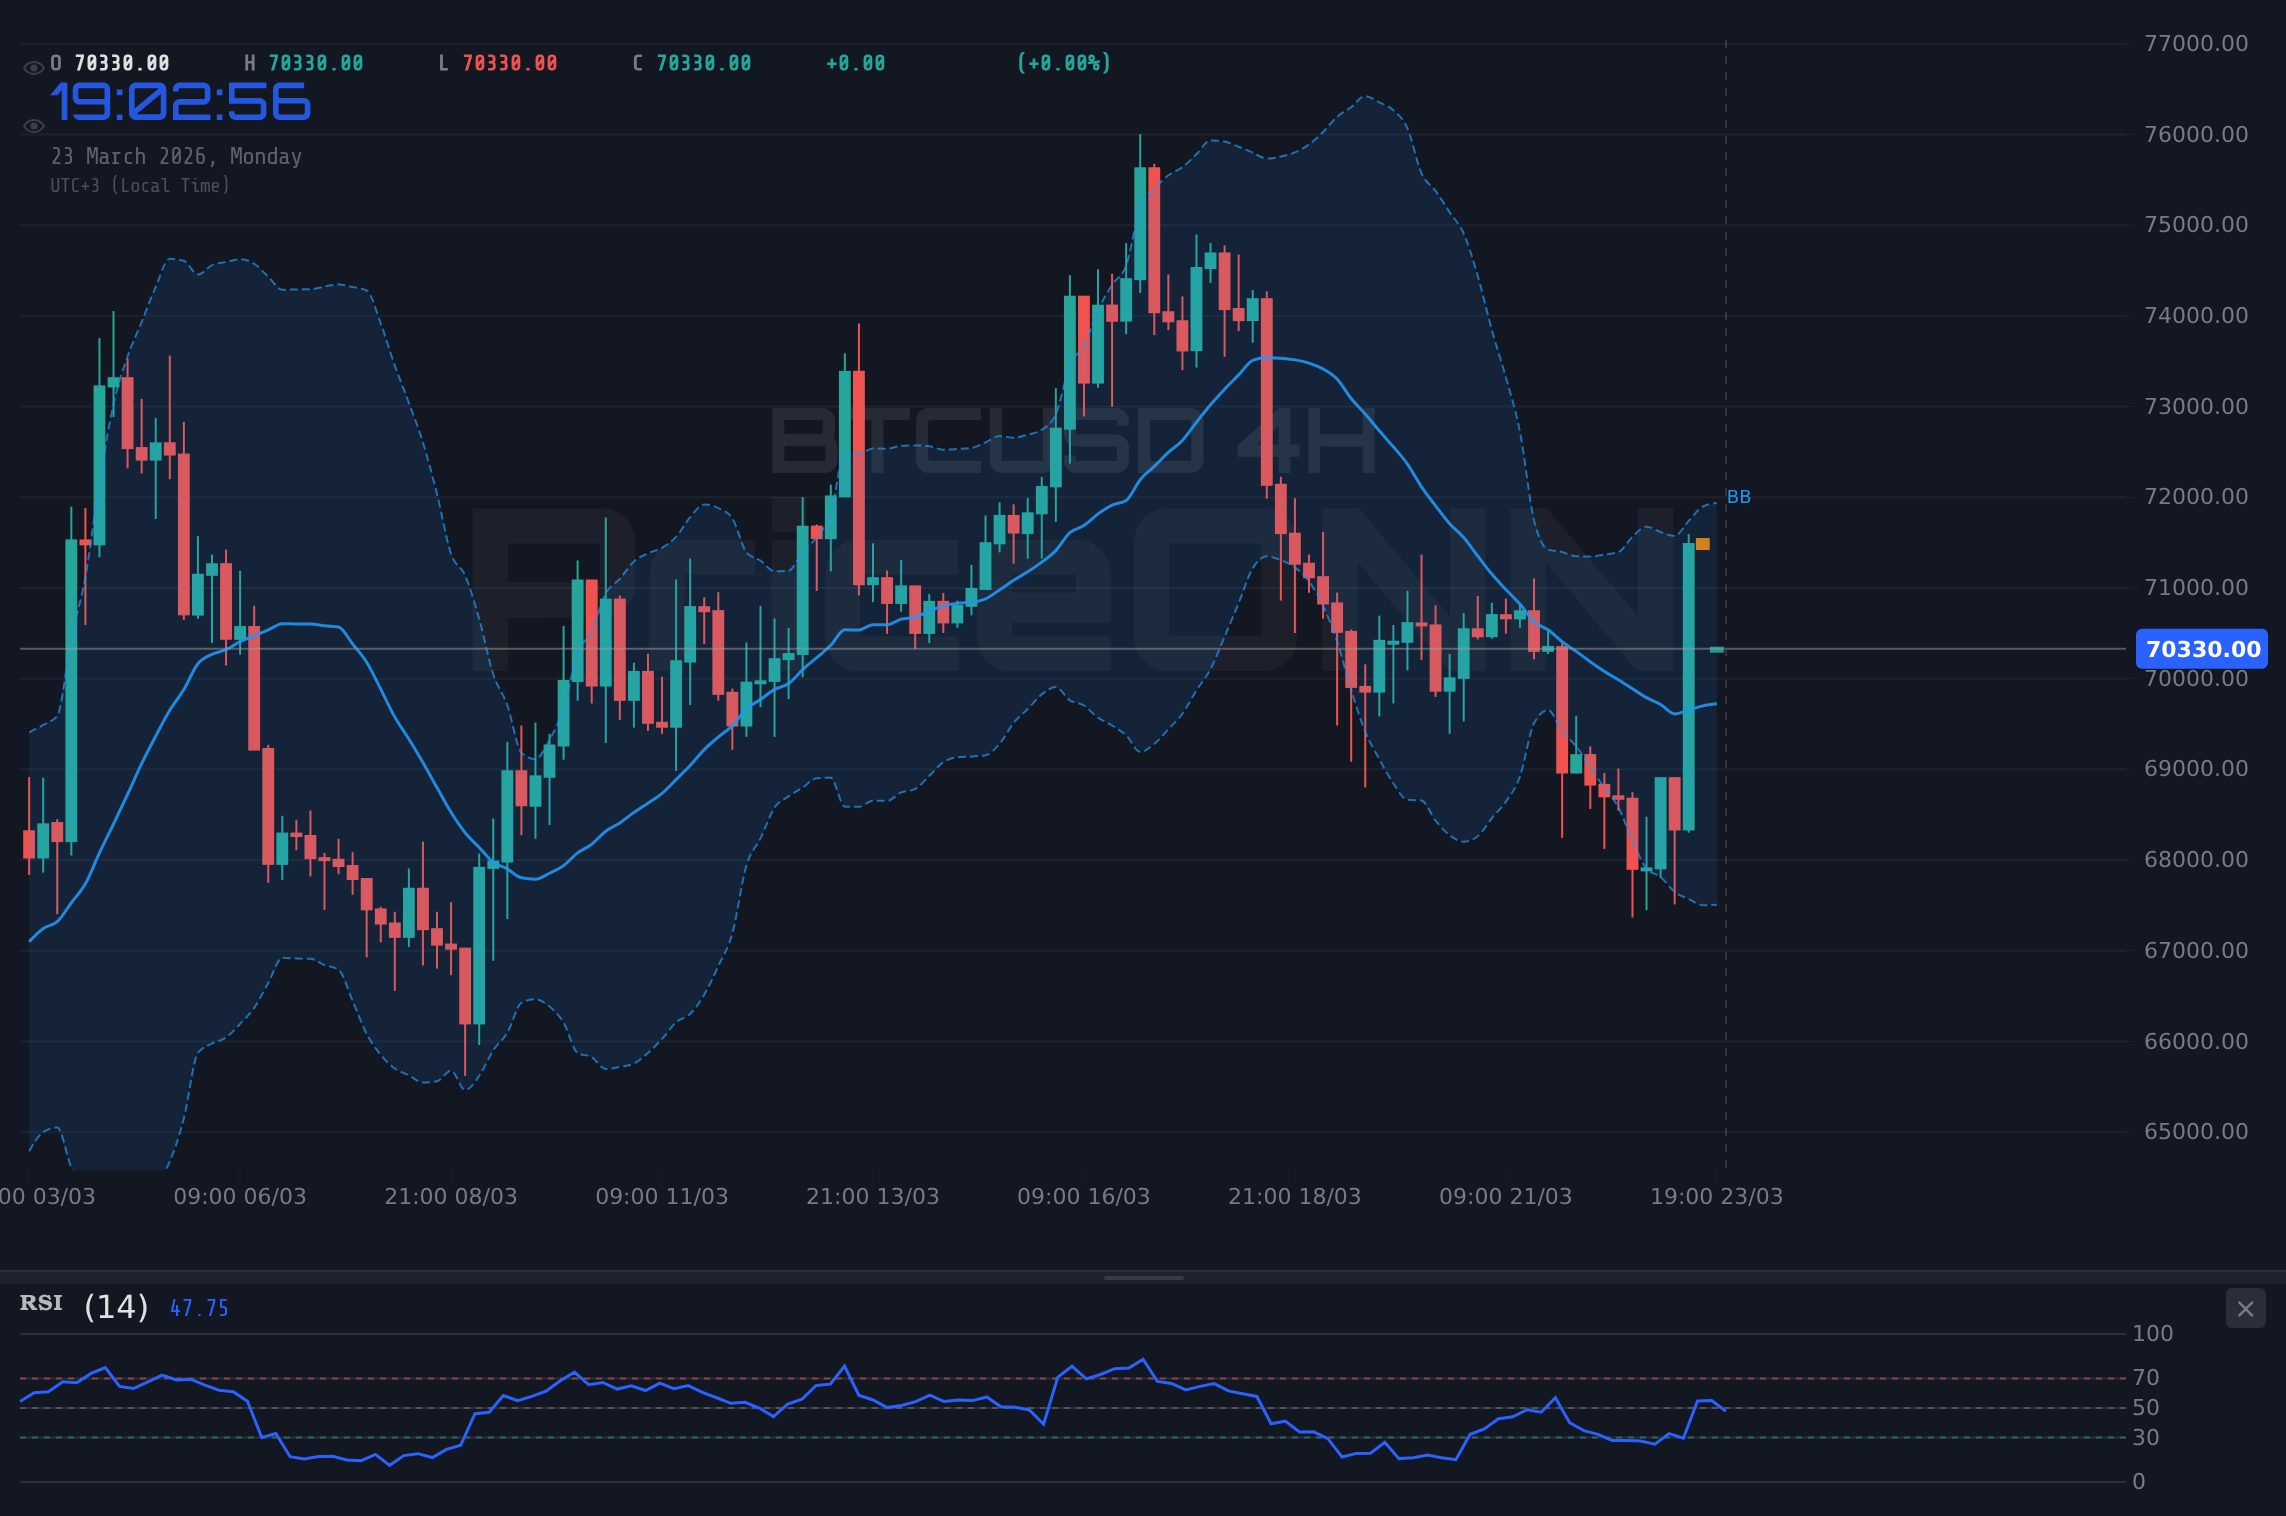
Bitcoin (BTCUSD) is currently consolidating around the significant $70,152 level, a price point that has become a focal area for traders and analysts alike. The 1-hour chart paints a picture of cautious optimism, with the Relative Strength Index (RSI) at 57.67, suggesting upward momentum is present but not yet overpowering. The Moving Average Convergence Divergence (MACD) is also showing positive momentum, trading above its signal line, which traditionally indicates buying pressure. However, the Stochastic Oscillator, with its K line at 83.44 and D line at 77.15, is entering overbought territory on this timeframe. This suggests that while buyers are active, the immediate upside might be capped, and a period of consolidation or a minor pullback could precede a decisive move. The Average Directional Index (ADX) at 37.26 confirms a strong trend is in play, but without clearer conviction from other indicators, breaking decisively above $70,152 requires sustained buying pressure.
For bulls to truly take control and push beyond the immediate resistance, several conditions need to be met. Firstly, sustained buying volume is crucial. We need to see a clear break and hold above the $71,798 resistance level identified on the 1-hour chart. If BTCUSD can achieve this, the next logical target would be the $72,147 resistance. This scenario is further supported by the 4-hour chart's technicals, where the MACD is also showing positive momentum, and the Stochastic Oscillator, while rising, is not yet in extreme territory. However, the daily chart presents a more mixed picture; the RSI at 49.24 is neutral, and the MACD is below its signal line, indicating potential underlying weakness or a lack of broader market conviction at these elevated prices. The ADX on the daily timeframe at 20.13 suggests a weaker trend, making a strong upward surge less likely without external catalysts.
The Role of Risk Appetite
The broader market sentiment plays an indispensable role in Bitcoin's trajectory. Currently, the S&P 500 (SP500) is trading around 6585.9, showing a slight upward trend on the 1-hour chart with RSI at 56.95 and MACD positive. However, the 4-hour and daily charts for the SP500 present a more cautious outlook, with bearish signals and a strong downtrend indicated by ADX values of 31.44 and 46.22 respectively. This divergence suggests that while the immediate market might be showing some resilience, the longer-term trend for equities could be under pressure. Similarly, the Nasdaq 100 (Nasdaq) shows a similar pattern, with a strong uptrend on the 1-hour chart but bearish signals on the daily timeframe (ADX at 37.63). A sustained risk-off environment, driven by geopolitical fears or concerns about stagflation as suggested by market commentary, could easily spill over into the cryptocurrency market, dampening any bullish aspirations for BTCUSD.
The US Dollar Index (DXY) currently at 99.13, is exhibiting a mixed signal across timeframes, but its daily chart shows a strong uptrend (ADX 34.7) with a positive RSI of 55.78. This strength in the dollar, fueled by escalating Middle East tensions, acts as a significant counter-current to Bitcoin's potential rise. Historically, a stronger dollar tends to put pressure on risk assets and gold. Indeed, gold (XAUUSD) has seen a sharp decline, currently trading at $4,369.69, down 2.84% on the day, with its 4-hour ADX at a very strong 65.39 indicating a powerful downtrend. This sharp move in gold, often seen as a safe-haven asset, highlights the prevailing risk-aversion sentiment, which is not conducive for Bitcoin's ascent. For BTCUSD to break higher, it would likely require a significant shift in market sentiment, perhaps a de-escalation of geopolitical tensions or dovish signals from the Federal Reserve that would weaken the dollar and boost risk appetite.
Where Bears Take Control: The $67,596.67 Line in the Sand
The Case for a Downturn
On the flip side, the bearish scenario for BTCUSD is supported by several technical indicators and broader market conditions. The 4-hour chart presents a particularly concerning picture for bulls. The trend is clearly defined as bearish with a strength of 100%, and the ADX at a formidable 65.39 underscores the power of this downward move. The RSI is deep in oversold territory at 26.73, suggesting significant selling pressure, although this can also be a precursor to a bounce. The MACD is firmly negative, below its signal line, reinforcing the bearish momentum. The Stochastic Oscillator, however, shows K at 22.86 and D at 18.85, with %K > %D, hinting at a potential short-term reversal upwards, but this is occurring within a strong downtrend.
The daily chart for BTCUSD also lends credence to the bearish outlook. While the trend is technically neutral with 50% strength, the ADX at 22.26 indicates a moderately trending market, and the overall signal is SAT (Sell). The RSI at 26.67 is again in oversold territory, and the MACD remains negative. The Bollinger Bands are trading below the lower band, indicating extreme bearish pressure, often seen during significant sell-offs or before a potential bounce. The key support level to watch on this timeframe is $66,716.67, followed by $65,530.33. A decisive break below these levels would confirm a deeper correction, potentially targeting the next significant support at $63,694.67. The prevailing risk-off sentiment, driven by geopolitical instability and concerns about inflation potentially leading to further interest rate hikes, provides a macro-economic backdrop that favors a move away from risk assets.
USDJPY and GBPUSD Dynamics
The forex market offers further clues about the prevailing risk sentiment. USDJPY, currently trading at 158.715, shows a daily uptrend (ADX 21.69) despite some bearish signals on shorter timeframes. This pair often acts as a barometer for risk appetite, and its relatively stable, albeit trending, behavior suggests that while there's caution, it's not a full-blown panic. More telling might be the performance of GBPUSD, trading at 1.33844. On the daily chart, it shows a bearish trend (ADX 29.09), with RSI at 44.13. This weakness in the British Pound, often sensitive to global economic outlooks, could indicate underlying stress in the global financial system. The fact that the US Dollar is showing resilience against these major currencies, driven by safe-haven flows, reinforces the challenge BTCUSD faces in mounting a sustained rally.
Furthermore, the commodity markets are sending mixed signals that indirectly impact Bitcoin. Brent crude oil (BRENT) is trading at $102.47, having experienced a significant drop of 9.02% today. This sharp decline, despite ongoing geopolitical tensions in the Middle East, is puzzling and could indicate a potential shift in supply/demand dynamics or a market reassessment of the immediate supply disruption risk. The 1D chart shows a strong uptrend (ADX 66.1), but the sharp intraday fall suggests volatility. WTI crude (WTI) at $90.96 has also seen a substantial daily drop of 7.5%. This volatility in oil prices adds another layer of uncertainty to the market, potentially impacting inflation expectations and, consequently, central bank policy, which in turn affects risk assets like Bitcoin.
The Waiting Game: Consolidation Around $70,000
Conditions for Sideways Action
A neutral scenario, where BTCUSD trades within a defined range without a clear directional bias, is also plausible, especially given the conflicting signals across different timeframes and indicators. On the 1-hour chart, the ADX at 37.26 suggests a strong trend, but the Stochastic Oscillator approaching overbought levels and the RSI hovering around 57.67 indicate that immediate upside momentum might stall. The 4-hour chart shows a strong bearish trend (ADX 65.39), yet the Stochastic is showing a potential buy signal, creating a conflict. The daily chart, with a neutral trend strength (ADX 20.13) and RSI around 49.24, suggests a market that is neither strongly bullish nor bearish, but rather waiting for a clearer catalyst.
This consolidation could be characterized by price action oscillating between the key support level around $66,716.67 (daily support) and the immediate resistance near $70,152, or potentially pushing slightly higher towards the 1-hour resistance at $71,798 if intraday momentum persists. Such a range-bound environment often occurs when market participants are awaiting significant economic data releases or geopolitical developments. For instance, upcoming central bank commentary or key inflation figures could introduce enough uncertainty to keep traders on the sidelines, preventing a decisive move in either direction. In such a scenario, volatility might decrease, and price action could become choppy, characterized by smaller price swings within the established range. This would be a period where scalpers might find opportunities, but swing and long-term traders would likely adopt a wait-and-see approach.
Intermarket Confluence and Divergence
The interplay between BTCUSD and other markets during a consolidation phase is crucial. If the DXY continues its upward trend, it would likely cap any upward moves in BTCUSD, keeping it pinned near the lower end of its potential range. Conversely, if geopolitical tensions ease and the DXY retreats, it could provide the necessary catalyst for BTCUSD to test higher resistance levels. The performance of equity indices like the SP500 and Nasdaq is also key. If these indices show signs of stabilization or a recovery, it would suggest a broader improvement in risk appetite, potentially benefiting Bitcoin. However, if they continue to show weakness, particularly on the daily charts, it would reinforce the bearish undertones and increase the likelihood of BTCUSD remaining range-bound or even breaking lower.
The commodity markets, particularly oil, add another layer of complexity. The sharp drop in Brent and WTI prices, despite ongoing Middle East tensions, is a significant anomaly. If oil prices stabilize or rebound, it could reignite inflation concerns, potentially leading to more hawkish central bank rhetoric, which would be bearish for risk assets. If oil prices continue to fall, it might signal a weakening global economic outlook, which is also generally not supportive of risk assets. This uncertainty surrounding oil prices and their impact on inflation and central bank policy makes it difficult to establish a clear direction for BTCUSD, thereby increasing the probability of a consolidation phase until these macro factors become clearer.
The Verdict: Which Scenario Holds the Most Weight?
Assessing Probabilities
Considering the current technical indicators and the prevailing market conditions, the bearish scenario currently holds the most weight, albeit with a significant caveat for a potential short-term bounce. The strong bearish trend on the 4-hour chart (ADX 65.39) and the bearish signals on the daily charts for BTCUSD, SP500, and Nasdaq cannot be ignored. The persistent strength of the US Dollar, driven by geopolitical fears, further solidifies this outlook. The RSI values on the daily charts for BTCUSD (26.67) and XAUUSD (26.73) are deeply oversold, suggesting that a short-term bounce is possible, even within a larger downtrend. However, the overall confluence of bearish indicators, coupled with a risk-off global sentiment, makes a sustained rally from current levels unlikely without a significant shift in macro-economic or geopolitical factors.
Therefore, the most probable scenario is a continuation of the downtrend or a prolonged period of consolidation with a bearish bias. The probability of the bearish scenario playing out is estimated at 60%. This is followed by a neutral, range-bound scenario with a 30% probability, primarily driven by the conflicting signals on shorter timeframes and the potential for a short-term bounce from oversold conditions. The bullish scenario, which requires a decisive break above key resistance levels and a significant shift in market sentiment, appears least likely in the immediate term, carrying an estimated probability of 10%. This assessment is heavily dependent on the US Dollar's trajectory and the de-escalation of Middle East tensions.
Bearish Scenario: Downward Pressure Mounts
60% ProbabilityNeutral Scenario: Range-Bound Volatility
30% ProbabilityBullish Scenario: A Surprising Reversal
10% ProbabilityWhat I'm Watching This Week
Key Triggers for BTCUSD
This week, the market will be closely watching several key factors that could dictate BTCUSD's direction. Firstly, the performance of the US Dollar Index (DXY) will be paramount. Any signs of de-escalation in the Middle East could lead to a pullback in the dollar, potentially creating an environment for risk assets to recover. Conversely, further escalation would likely strengthen the dollar and weigh on Bitcoin. Secondly, the upcoming economic data releases, particularly any inflation figures or central bank meeting minutes, will be crucial. Hawkish signals from central banks could dampen risk appetite, while dovish undertones might provide a reprieve. Finally, the price action around the $66,716.67 support level on BTCUSD will be critical. A failure to hold this level on the daily chart would likely trigger the bearish scenario, while a strong bounce from here could set the stage for a test of higher resistances, especially if accompanied by a shift in global risk sentiment.
Frequently Asked Questions: BTCUSD Analysis
What happens if BTCUSD breaks below the $66,716.67 support level?
A break below the $66,716.67 daily support level would likely trigger the bearish scenario, confirming the strong downtrend indicated by the 4-hour ADX at 65.39. This could lead to further declines, with the next key targets being $65,530.33 and potentially $63,694.67.
Should I buy BTCUSD at current levels around $70,152 given the mixed signals?
Buying at current levels requires caution due to conflicting signals and strong dollar headwinds. A more prudent approach might be to wait for a confirmed break above $71,798 with strong volume, or a clear bounce from the $66,716.67 support level, coupled with a shift in market sentiment. The probability of a sustained rally from here is currently estimated at only 10%.
Is the RSI at 49.24 on the daily chart a sell signal for BTCUSD?
An RSI of 49.24 on the daily chart is considered neutral, indicating neither strong buying nor selling pressure. While the 1-hour RSI at 57.67 shows some bullish inclination, the overall picture suggests indecision. This neutral reading contributes to the possibility of a range-bound market until clearer directional signals emerge.
How will the ongoing Middle East tensions affect BTCUSD this week?
Escalating Middle East tensions are currently bolstering demand for the US Dollar (DXY at 99.13), which acts as a headwind for risk assets like BTCUSD. Continued geopolitical uncertainty is likely to maintain a risk-off sentiment, increasing the probability of the bearish or neutral scenarios playing out for Bitcoin, rather than a significant bullish move.
| Indicator | Value | Signal | Interpretation |
|---|---|---|---|
| RSI (14) | 49.24 | Neutral | Daily chart shows indecision; 1H at 57.67 leans bullish |
| MACD Histogram | -1000s (est.) | Bearish | Daily MACD negative; 1H positive momentum needs daily confirmation |
| Stochastic | K=19.99, D=35.16 | Bearish | Daily chart shows bearish crossover in oversold territory |
| ADX | 20.13 | Neutral Trend | Daily chart shows moderate trend strength, favoring consolidation |
| Bollinger | Mid Band Break | Bearish | Price trading below middle band on daily chart |
Track markets in real-time
AI-powered analysis, technical indicators and real-time price data.
Join Our Telegram Channel
Breaking market news, AI analysis and trading signals instantly.
Join Channel