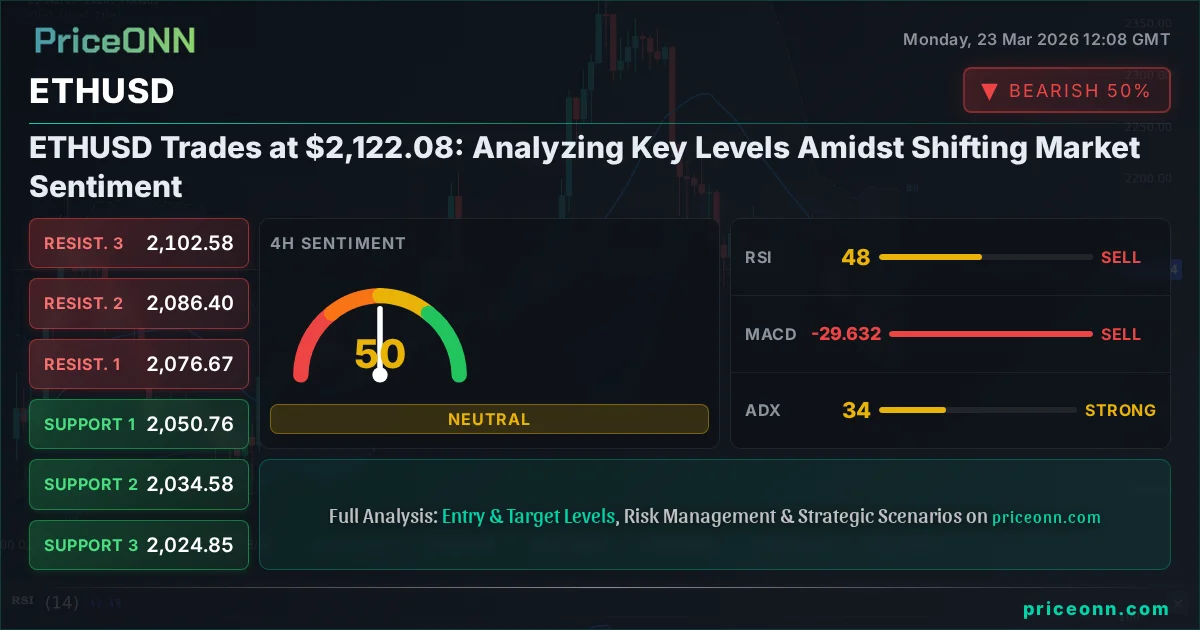
ETHUSD Trades at $2,122.08: Analyzing Key Levels Amidst Shifting Market Sentiment
ETHUSD is trading at $2,122.08 after a 3.85% surge. With RSI at 65.25 on the 1H chart, momentum is building, but the 4H trend remains cautious.
The cryptocurrency market is always a whirlwind, and ETHUSD is no exception, currently changing hands at a critical juncture of $2,122.08. After a notable 3.85% surge on the daily chart, the question on every trader's mind is whether this upward momentum is sustainable or if it's merely a temporary reprieve before further consolidation. My analysis suggests that while short-term indicators flash bullish signals, the broader market context and multi-timeframe technicals paint a more nuanced picture, demanding a strategic approach rather than a blind bet.
This recent price action for ETHUSD, currently at $2,122.08, comes amidst a complex global economic backdrop. The US Dollar Index (DXY) is showing strength, trading around 99.42, which typically exerts downward pressure on risk assets like cryptocurrencies. This inverse correlation is a well-trodden path; a stronger dollar makes dollar-denominated assets more expensive for holders of other currencies, potentially dampening demand. However, the crypto market, especially Ethereum, has shown a growing tendency to decouple from traditional risk-on/risk-off correlations at times, driven by its own ecosystem developments and global liquidity flows.
- ETHUSD is trading at $2,122.08, with RSI at 65.25 on the 1H chart indicating rising bullish momentum.
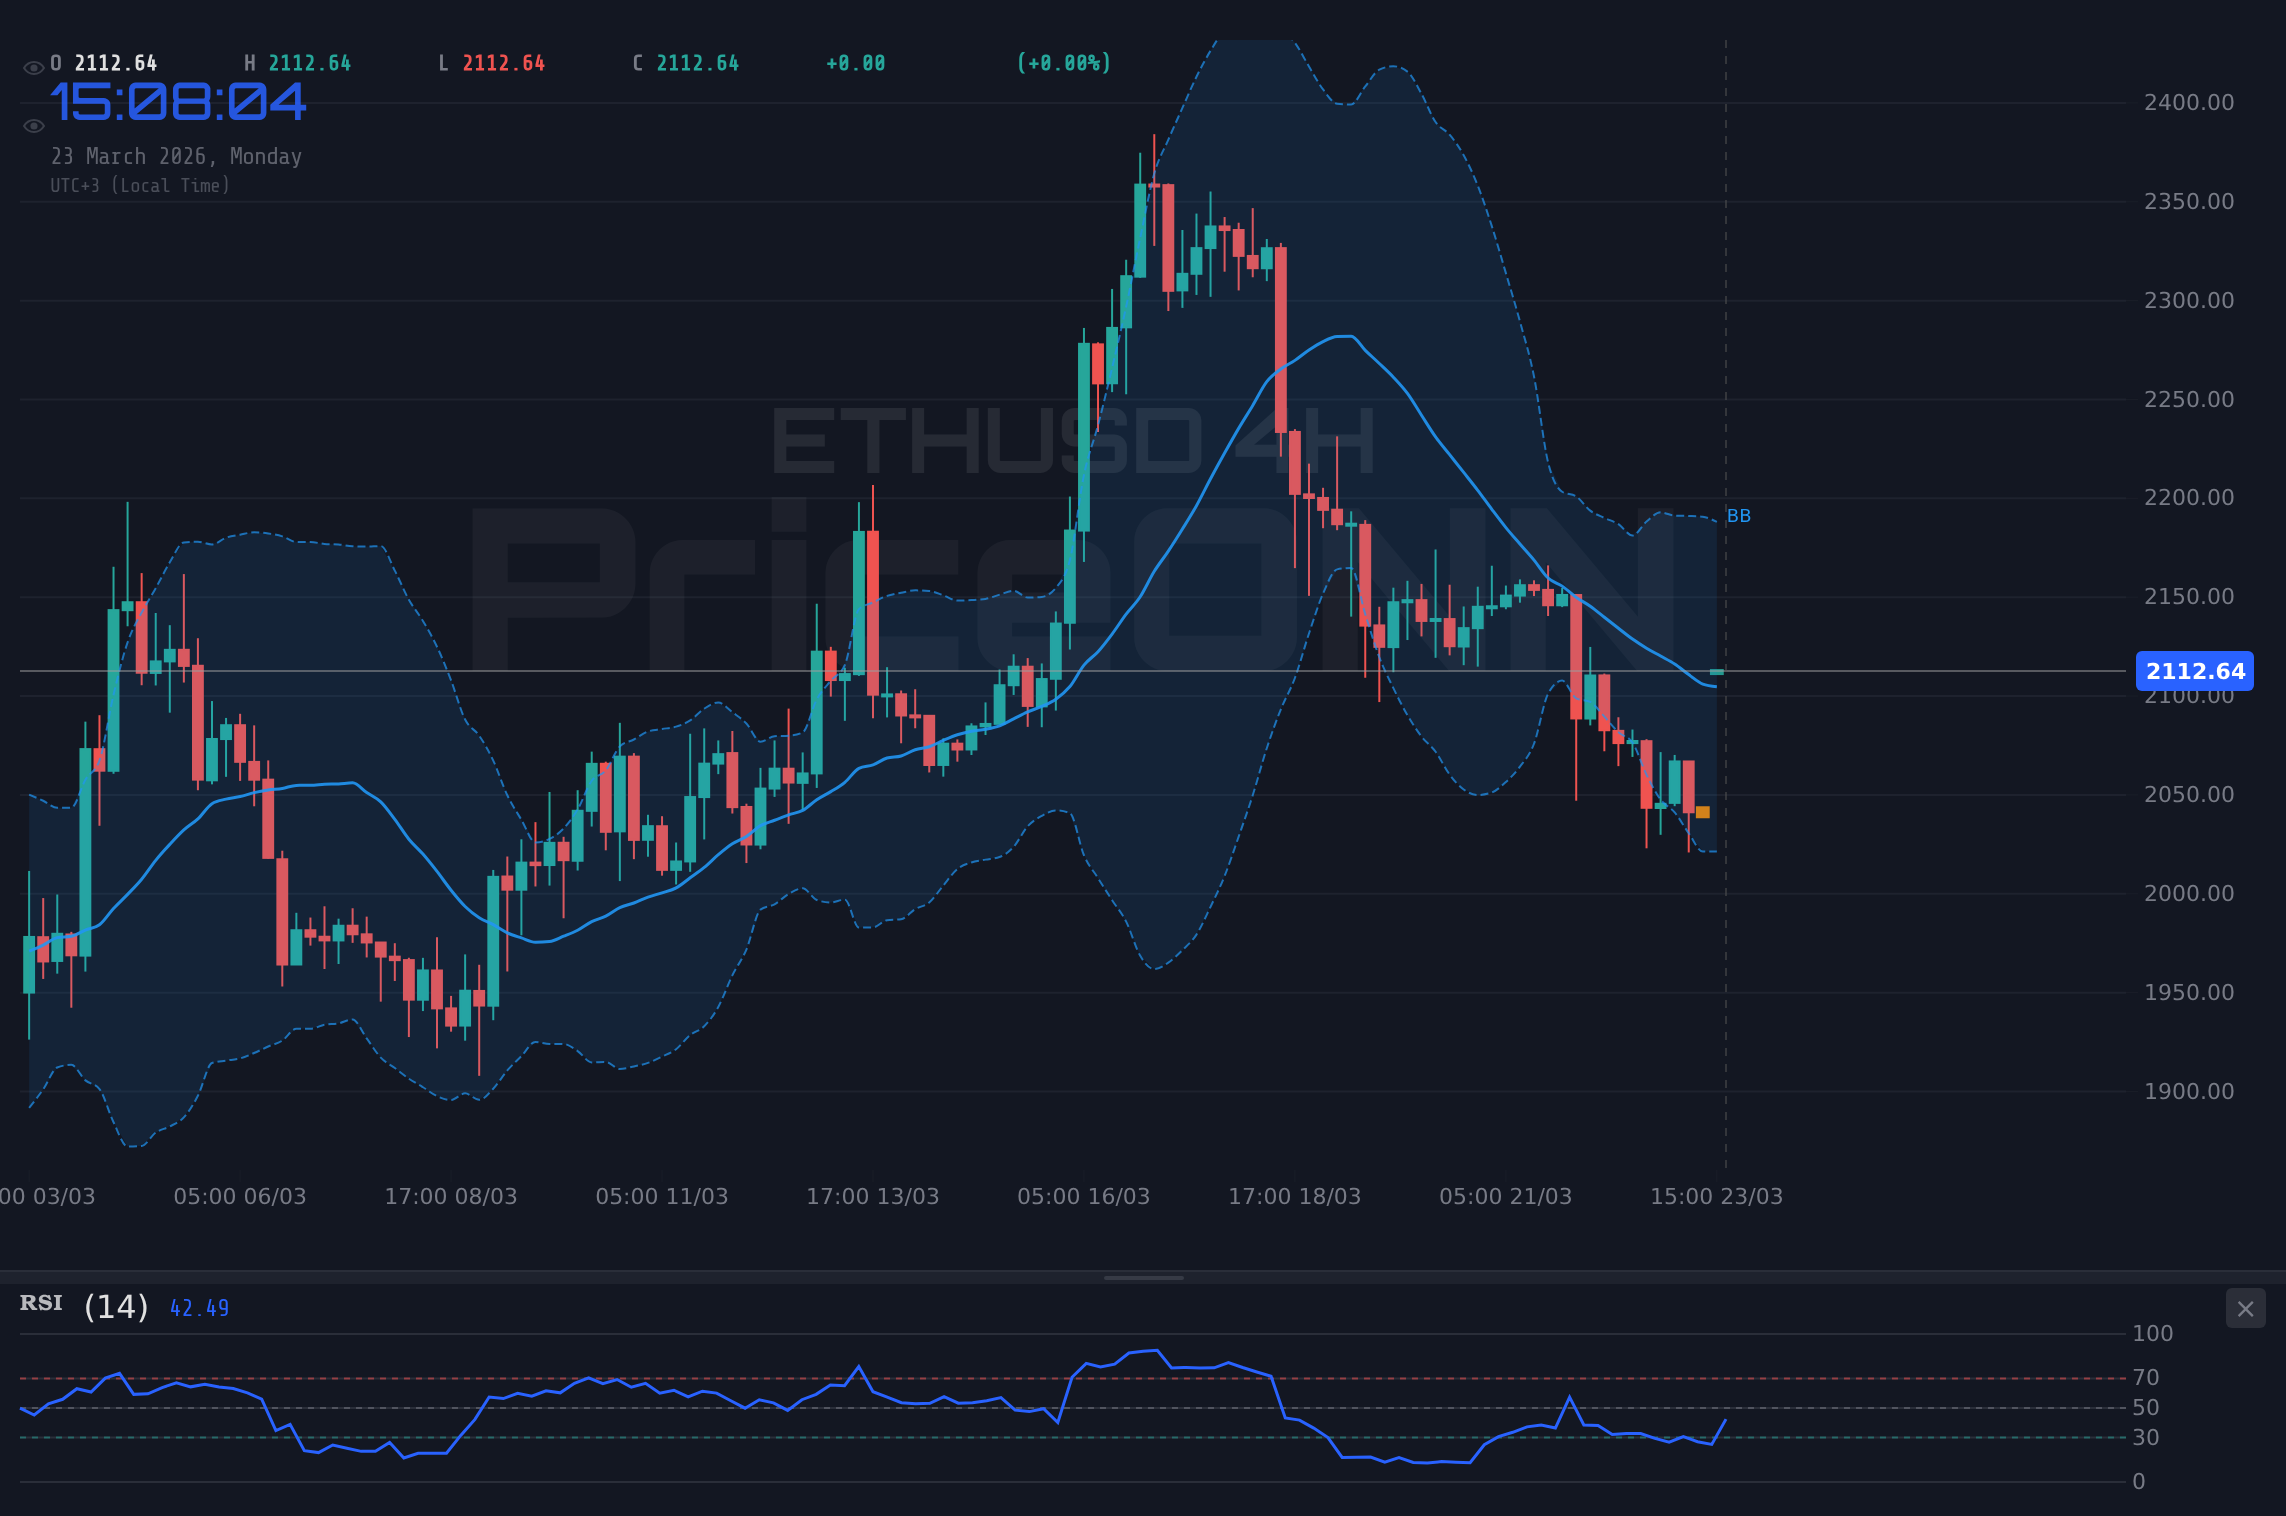
- Critical support for ETHUSD is identified at $2,024.89, while resistance looms around $2,102.58 on the 4H timeframe.
- The DXY at 99.42 presents a counter-trend pressure, yet ETHUSD's recent surge suggests internal strength or specific crypto market drivers.
- With the ADX at 44.25 on the 1H chart, a strong uptrend is forming, but confirmation from longer timeframes is crucial.
Looking at the 1-hour timeframe for ETHUSD, the signals are predominantly bullish. The Relative Strength Index (RSI) stands at 65.25, comfortably in neutral territory but trending upwards, suggesting room for further gains before entering overbought conditions. The MACD is also showing positive momentum, with the MACD line above its signal line, reinforcing the bullish sentiment. Furthermore, the Stochastic Oscillator's %K line is above its %D line, a classic buy signal. The ADX at 44.25 indicates a strong trend is developing, reinforcing the conviction behind this upward move. This confluence of positive short-term indicators suggests that intraday traders might find opportunities on the long side, provided key levels hold.
However, a trader's edge comes from looking beyond the immediate 1-hour chart. The 4-hour timeframe for ETHUSD presents a more cautious outlook. While the RSI is at 49.19, it's trending downwards, hinting at potential cooling of momentum. The MACD is negative, with the MACD line below its signal line, indicating bearish pressure on this timeframe. The Stochastic also shows a bearish signal (%K < %D), and while ADX at 34.15 still suggests a strong trend, its directionality is less clear than on the 1H chart. This divergence between the 1-hour and 4-hour charts is precisely where the market's true battleground lies. It signals that the current upward push might face significant headwinds as we move into higher timeframes.
The daily chart for ETHUSD offers an even broader perspective, revealing a neutral trend with potential for either direction. The RSI at 50.34 is right at the midpoint, providing no clear directional bias. The MACD is positive, suggesting underlying strength, but the Stochastic is showing a bearish signal (%K < %D), and the ADX at 20.98 indicates only a moderately strong trend. This neutral stance on the daily chart implies that the recent 1-hour bullishness needs to be strong enough to overcome a lack of conviction on longer timeframes. It means that while we might see short-term gains, the larger market structure isn't yet screaming 'buy the dip' with full confidence.
The broader market context, particularly concerning gold and oil, also provides valuable insights. Gold prices have tumbled to $4,341.49, down 3.47% on the day, as inflation fears are now triggering rate hike prospects. This is a significant shift; typically, rising inflation might support gold as an inflation hedge, but the market's current interpretation is that persistent inflation will force central banks into more aggressive tightening, which is bearish for risk assets. The DXY at 99.42 is also contributing to this pressure on commodities and riskier assets. Silver, trading at $66.92, is also under pressure, falling 1.36%.
This dynamic between inflation, central bank policy, and risk assets is crucial for understanding ETHUSD's potential path. If the market believes that inflation will necessitate higher interest rates for longer, it generally leads to a 'risk-off' environment. In such a scenario, assets like ETHUSD could face significant selling pressure, despite positive short-term technicals. The fact that gold has fallen so sharply, even as inflation remains a concern, suggests that the dominant narrative might be shifting towards the impact of monetary tightening rather than the inflation hedge narrative.
The correlation with major indices like the S&P 500 (currently at 6,591.35, up 0.85%) and Nasdaq 100 (at 24,202.14, up 0.88%) is also worth noting. While these indices are showing some upward movement, their 4-hour and daily charts suggest a bearish trend, indicating that the broader risk appetite might be fragile. A sustained downturn in these major indices could easily spill over into the cryptocurrency market, pulling ETHUSD down with it, regardless of its own internal bullish signals.
For traders specifically looking at ETHUSD, the key levels provided in the market data are paramount. On the 1-hour chart, resistance is seen at $4,326.01 and support at $4,286.23. However, these are very short-term levels. More importantly, the 4-hour chart presents key support at $4,267.43 and resistance at $4,387.17. On the daily chart, these levels extend further, with support at $4,404.60 and resistance at $4,662.90. The current price of $2,122.08 is well within these broader ranges, but the approach to these levels will be critical.
The recent news regarding geopolitical tensions in the Middle East also adds another layer of complexity. While these events often drive demand for safe-haven assets like gold, the market's reaction has been mixed, with gold tumbling despite the escalation. This suggests that the immediate focus might be on the economic implications - potential supply chain disruptions and inflationary pressures - rather than the traditional safe-haven narrative. For ETHUSD, such geopolitical uncertainty can increase overall market volatility, making it harder to predict price movements based solely on technicals.
Considering the conflicting signals across different timeframes, a conservative approach is warranted. The 1-hour chart shows bullish momentum, but the 4-hour and daily charts suggest caution and potential for a reversal. The broader macroeconomic environment, with a strengthening DXY and concerns about central bank tightening, adds further headwinds. Therefore, while a short-term bounce is possible, a sustained rally for ETHUSD would likely require a clear break above the 4-hour resistance at $4,387.17, coupled with a shift in sentiment across major indices and a less hawkish stance from central banks.
The ADX indicator provides a powerful lens through which to view the trend strength. On the 1-hour chart, ADX at 44.25 signals a strong uptrend, supporting the bullish short-term outlook. However, on the 4-hour chart, ADX is 34.15, still indicating a strong trend, but the lack of clear directionality suggests the trend might be weakening or consolidating. The daily ADX at 20.98 points to a moderate trend, further underscoring the lack of strong conviction on longer timeframes. This means that while momentum traders might jump on the 1-hour trend, swing and position traders should wait for clearer signals from the higher timeframes.
The Stochastic Oscillator on the 1-hour chart shows a bullish signal (%K > %D), but on the 4-hour chart, it's bearish. This is another example of conflicting signals that highlight the need for patience. A true confirmation of an uptrend would involve the Stochastic on the 4-hour chart turning bullish and crossing above the %D line, ideally after a period of consolidation or from oversold levels. Currently, it's in a somewhat ambiguous zone, making it difficult to rely on solely.
The recent news about the IEA discussing potential oil stockpile releases due to Middle East tensions also feeds into the inflation narrative. If oil prices stabilize or fall due to these interventions, it could ease some inflationary pressures, potentially leading to a less hawkish central bank stance. This would be a positive development for risk assets like ETHUSD. Conversely, if tensions escalate and oil prices surge further, the market's focus on rate hikes will likely intensify, creating a challenging environment for cryptocurrencies.
The current price of $2,122.08 for ETHUSD presents a complex trading scenario. The short-term technicals are bullish, but they are contradicted by signals on longer timeframes and challenged by the broader macroeconomic and geopolitical landscape. A prudent approach involves waiting for clearer confirmation, particularly a sustained break above key resistance levels on the 4-hour and daily charts, or a significant shift in global risk sentiment. The market is giving mixed signals, and only by respecting the data across all timeframes can a trader position themselves for success.
Bearish Scenario: ETHUSD Faces Headwinds
65% ProbabilityNeutral Scenario: Consolidation Around $2,122
25% ProbabilityBullish Scenario: ETHUSD Breaks Higher
10% ProbabilityFrequently Asked Questions: ETHUSD Analysis
What happens if ETHUSD breaks below the $2,024.89 support level?
If ETHUSD closes below $2,024.89, the bearish scenario becomes more probable, targeting previous lows around $1,993.83 and potentially $1,944.16. This would be invalidated if price quickly recovers and closes above $2,102.58.
Should I buy ETHUSD at current levels of $2,122.08 given the mixed signals?
Buying at $2,122.08 is a high-risk proposition given the conflicting signals across timeframes. A more prudent approach would be to wait for a clear break above $2,102.58 resistance for a bullish confirmation, or a dip towards $2,024.89 support for a potential higher-probability entry if it holds.
Is the RSI at 65.25 a sell signal for ETHUSD right now?
An RSI of 65.25 on the 1-hour chart is not necessarily a sell signal; it indicates rising momentum but is not yet in extreme overbought territory. However, it does warrant caution, especially when considering the bearish divergence seen on the 4-hour chart's RSI at 49.19 trending down.
How will the DXY strength at 99.42 affect ETHUSD this week?
The strengthening DXY typically puts pressure on risk assets like ETHUSD. If the dollar continues to climb, it could cap any upside potential for Ethereum, making it harder to break key resistance levels and increasing the probability of a move towards support.
Track markets in real-time
AI-powered analysis, technical indicators and real-time price data.
Join Our Telegram Channel
Breaking market news, AI analysis and trading signals instantly.
Join Channel