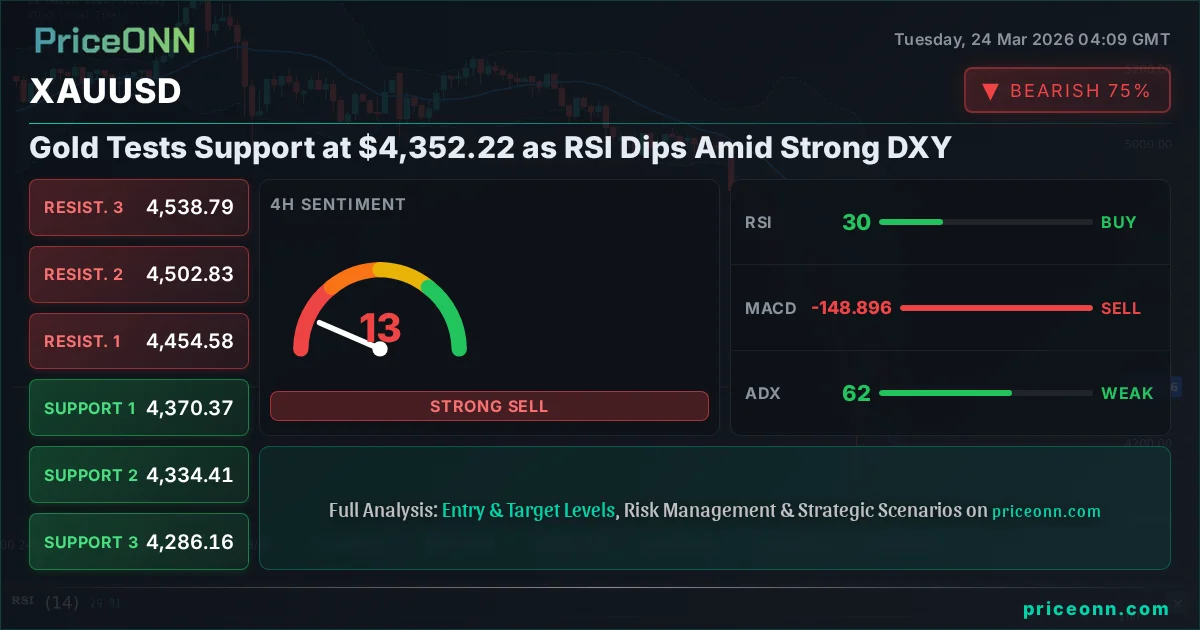
Gold Tests Support at $4,352.22 as RSI Dips Amid Strong DXY
Gold faces pressure, trading at $4,352.22 as the US Dollar Index strengthens and RSI signals caution. Key support levels are being tested, with traders watching for a potential trend reversal.
Gold, the perennial safe haven, is currently navigating choppy waters, trading at precisely $4,352.22 as of the latest market data. This price point finds the precious metal testing critical support levels, a move influenced by a strengthening US Dollar Index (DXY) and a neutral-to-bearish technical outlook across multiple timeframes. While the immediate picture suggests downward pressure, the longer-term narrative for gold remains complex, intertwining geopolitical risks with shifting central bank policies and inflation expectations. Understanding the interplay between these forces is paramount for any investor looking to navigate the current gold market.
- Gold is currently trading at $4,352.22, testing key support levels.
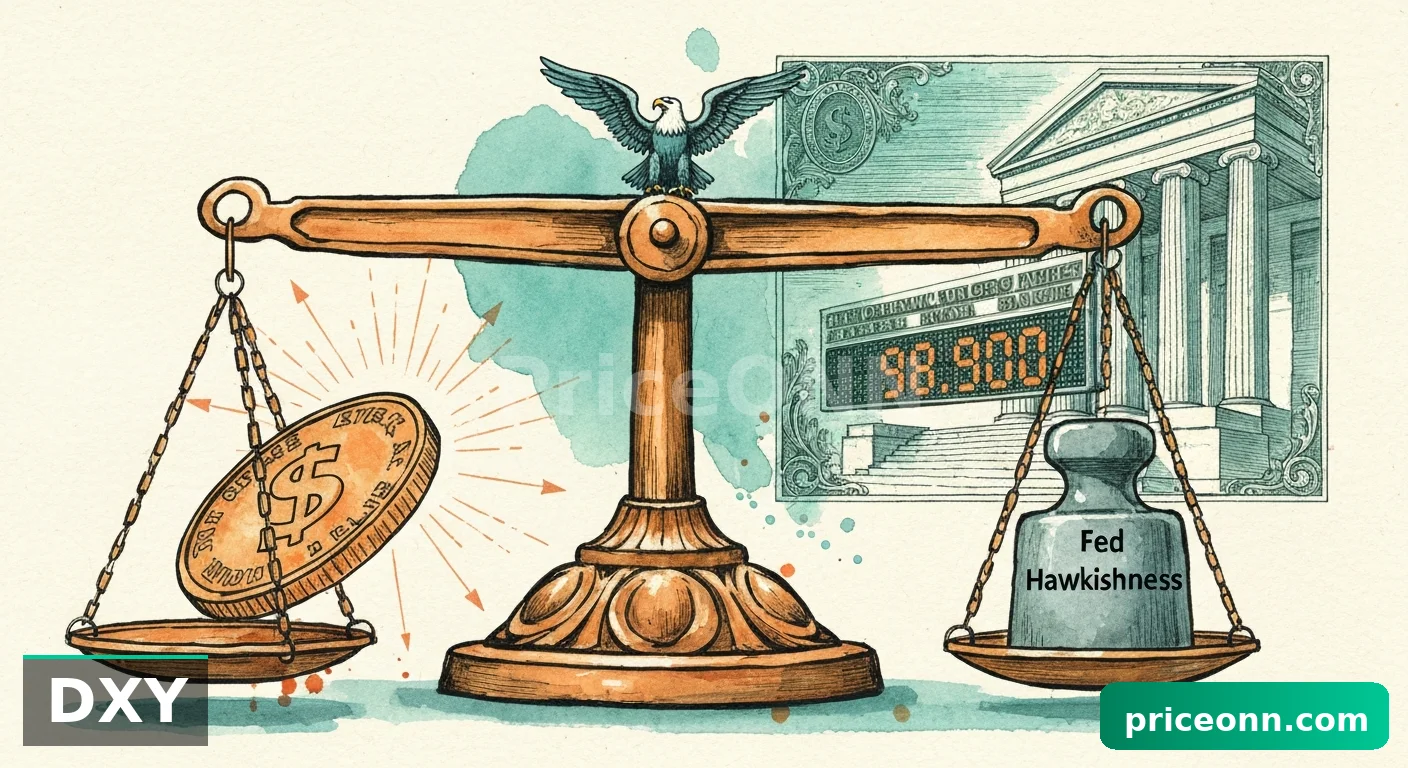
- The US Dollar Index (DXY) is rising to 99.19, exerting downward pressure on gold.
- On the 1-hour chart, the RSI is at 44.33, indicating a neutral stance with a downward bias.
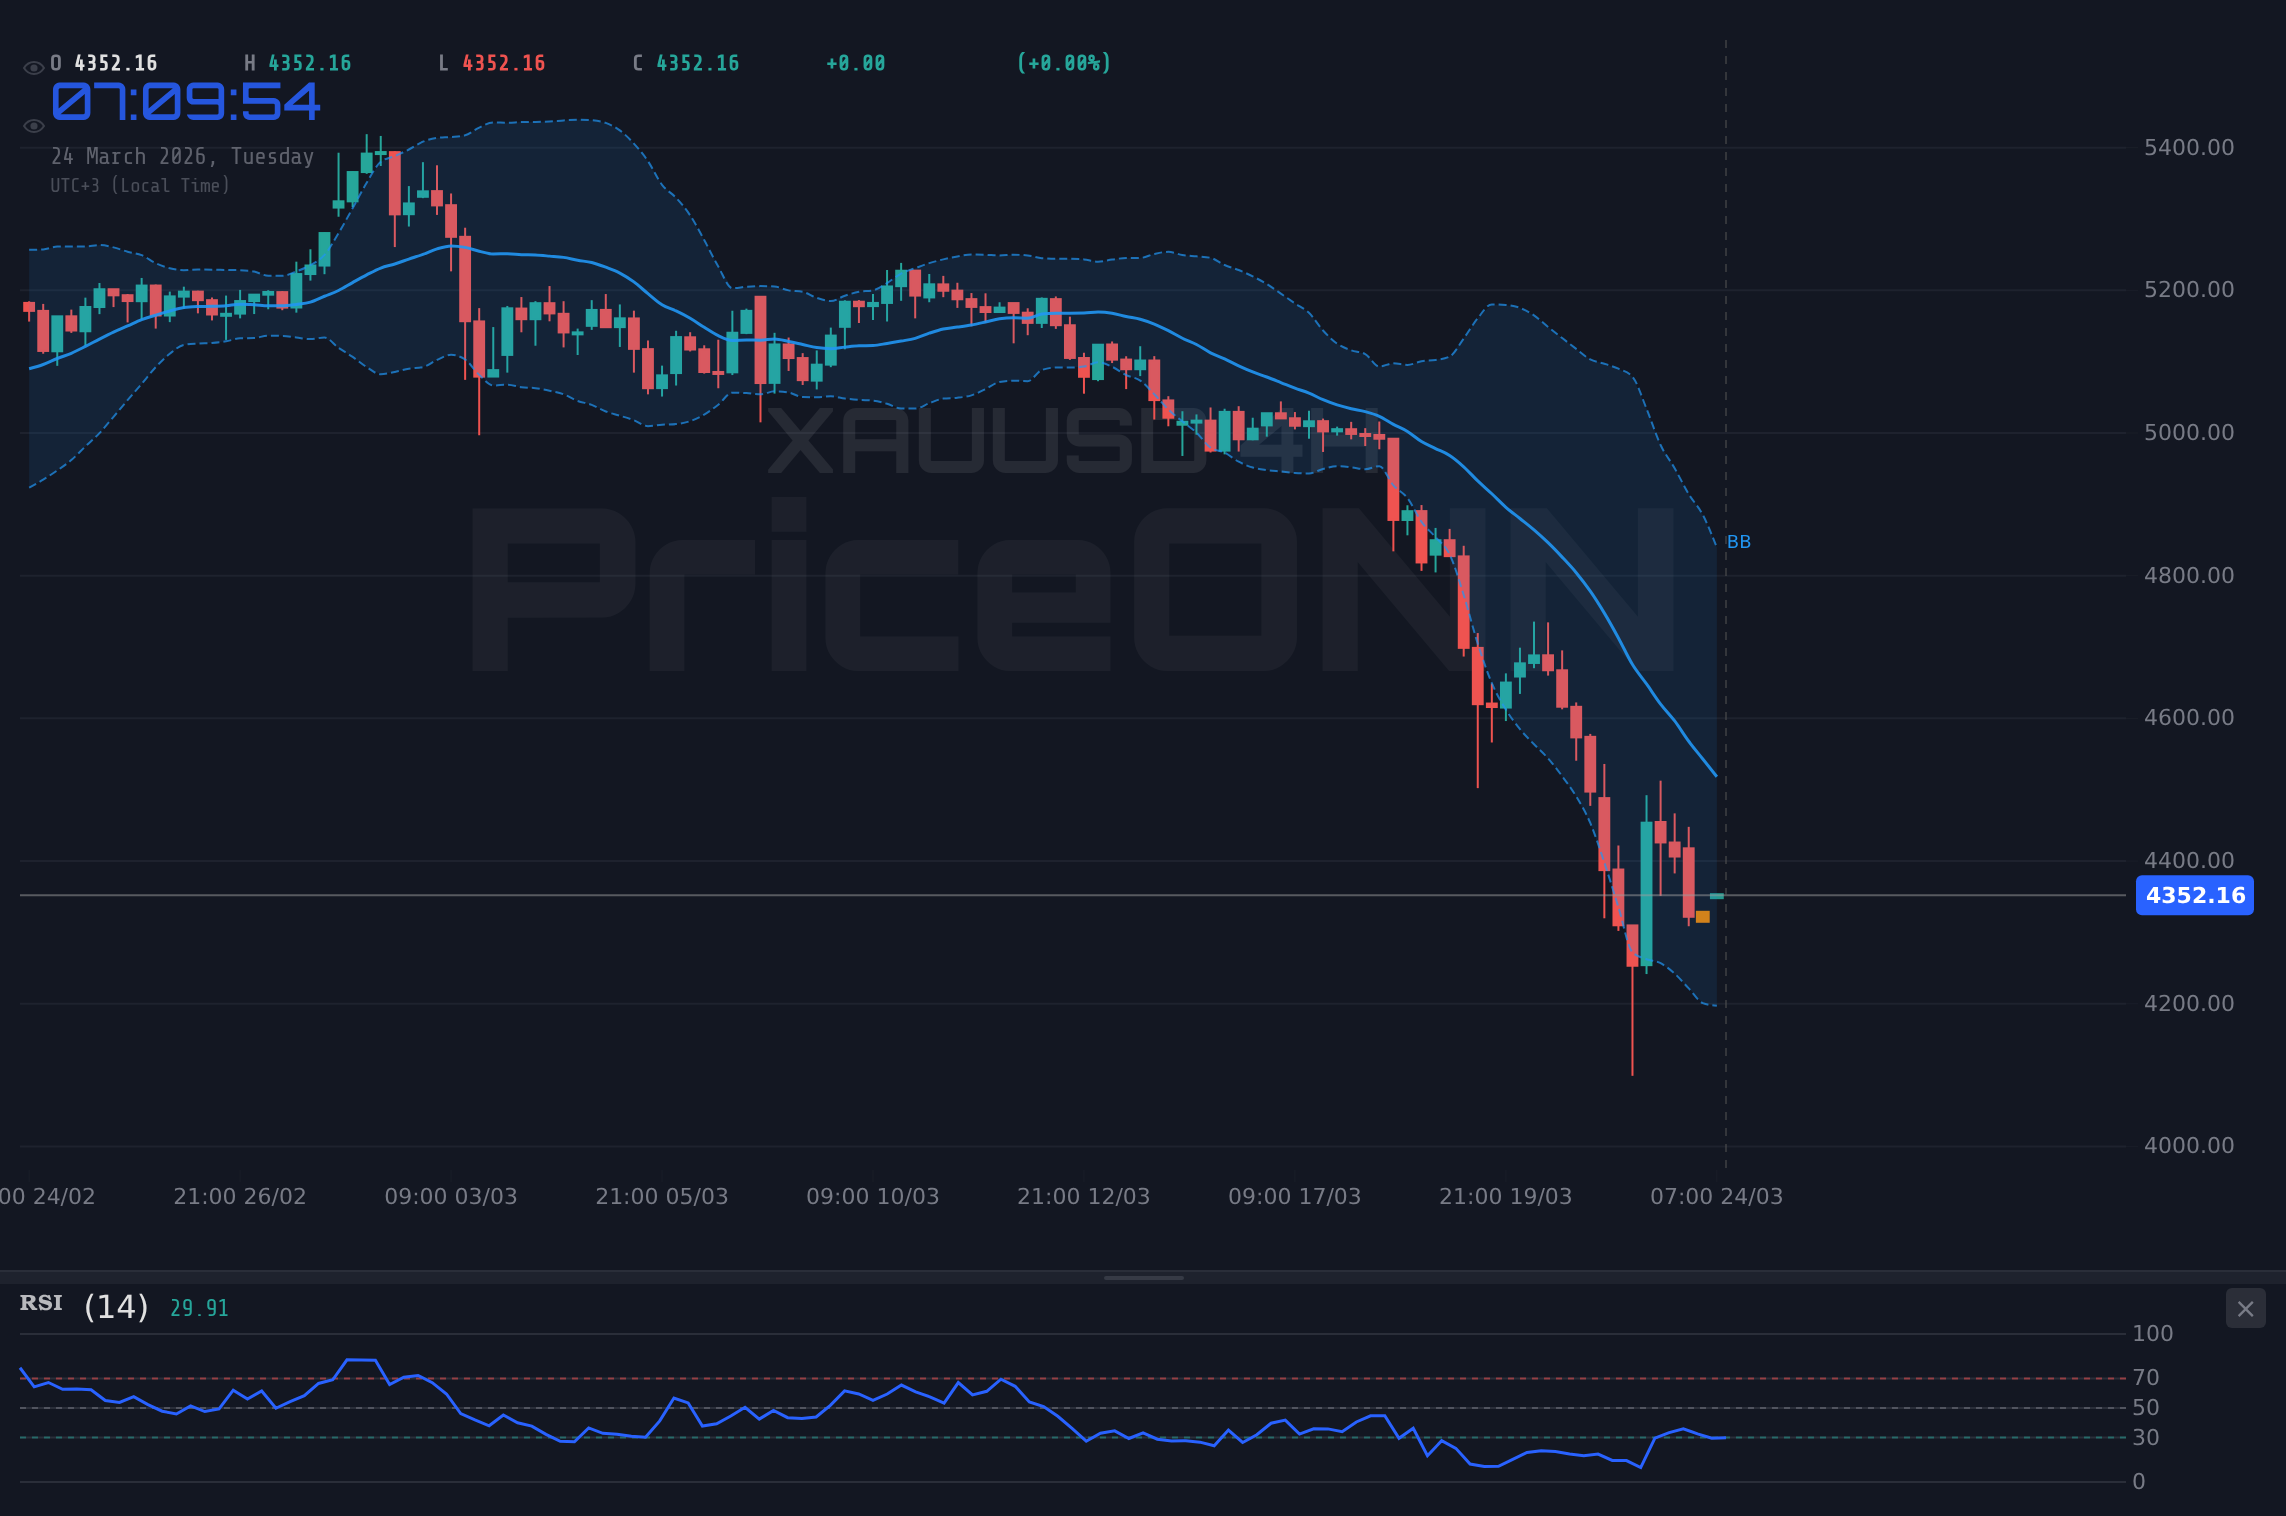
- The 4-hour chart shows a very strong downtrend (ADX: 61.54), with RSI at 29.96 suggesting oversold conditions.
- Geopolitical tensions could offer underlying support, but current technicals favor caution.
The prevailing sentiment around gold appears to be shifting, at least in the short term. On the 1-hour timeframe, the trend is decidedly bearish with a strength of 92%, and the RSI at 44.33, while neutral, leans towards further declines. The MACD shows positive momentum, but this is within the context of a broader downward move, and the Stochastic oscillator is signaling a sell. This picture is further reinforced by the 4-hour chart, which paints an even stronger bearish trend with an ADX of 61.54. Here, the RSI has fallen into oversold territory at 29.96, yet the MACD remains negative. This divergence - oversold conditions coupled with strong bearish trend strength - often signals a market in distress, where bounces might be short-lived. The immediate support levels to watch are $4,321.58, followed by $4,277.23 and $4,248.48. A decisive break below these levels could trigger further declines.
Navigating the Cross-Market Currents: DXY's Dominance and Risk Appetite
The narrative for gold cannot be told without acknowledging the significant influence of the US Dollar Index (DXY). Currently standing at 99.19 and showing a clear upward trajectory on the daily chart (strength 91%), the DXY is acting as a potent headwind for gold. Historically, a stronger dollar makes dollar-denominated assets like gold more expensive for holders of other currencies, thus dampening demand. The DXY's rise is partly fueled by a perceived shift in risk sentiment; the SP500 is down 0.39% today at 6554.75, and the Nasdaq 100 has slipped 0.44% to 24076.26. This decline in major equity indices suggests that risk appetite is waning, prompting a flight to safety. Traditionally, gold benefits from such risk-off environments, but the simultaneous strength in the dollar complicates this. The SP500's 4-hour chart shows a bearish trend with a strength of 88%, and the daily chart is firmly in a downtrend, indicating broader market weakness that could, in theory, boost gold. However, the dollar's concurrent strength is overshadowing this safe-haven bid, creating a tug-of-war effect.
The energy markets also add layers to this complex picture. Brent crude is up a significant 4.4% to $104.44, while WTI has surged 3.49% to $92.34. This sharp rise in oil prices, potentially driven by geopolitical concerns in the Middle East as suggested by news of escalating tensions, typically fuels inflation expectations. Higher inflation often boosts gold's appeal as an inflation hedge. However, the current market dynamics show gold trading lower despite the spike in oil. This decoupling is unusual and suggests that the dollar's strength and broader risk aversion are currently the dominant themes, overriding the inflationary implications of rising energy costs. It's a crucial point: while rising oil prices historically correlate positively with gold, the immediate price action indicates other factors are currently in the driver's seat. The ADX on the daily Brent chart shows a very strong uptrend (63.98), while WTI also shows a strong uptrend (57.93), confirming the energy market's bullish momentum.
The current correlation between a rising DXY, falling equities, and falling gold is unusual. Historically, falling equities and rising geopolitical risk (often signaled by oil spikes) would support gold. The dominant dollar strength is currently negating this effect, creating a complex trading environment where traditional safe-haven flows are being challenged.
Looking at the forex majors, EUR/USD is trading at 1.15808, showing a daily downtrend (strength 93%) despite some positive signals on the 4-hour chart. GBP/USD is at 1.33954, also in a daily downtrend (strength 90%). USD/JPY, conversely, is rising at 158.744, indicating a strong upward trend on the 1-hour chart (strength 50% but with a strong ADX at 33.38, though the 4H chart shows a bearish trend). This general weakness in major currencies against the dollar further bolsters the DXY and adds to the pressure on gold. The confluence of a strong dollar, risk aversion in equities, and a weakening major currency complex presents a challenging technical backdrop for gold, pushing its price towards key support levels.
The Technical Tightrope: Analyzing Gold's Oscillators and Trends
Delving deeper into the technicals, the picture for XAUUSD remains mixed across different timeframes, but the dominant signal leans bearish. On the 1-hour chart, the ADX is at 24.81, indicating a moderately strong downtrend. The RSI at 44.33 is in neutral territory but trending down, and the Stochastic is giving a sell signal (%K < %D). The Bollinger Bands are also showing a downward bias, with the price trading below the middle band. This suggests short-term weakness, but the momentum is not extreme.
The 4-hour timeframe, however, paints a much more concerning picture for the bulls. The trend strength is at a perfect 100%, with the ADX soaring to 61.54 - a clear indication of a very strong downtrend. While the RSI has dipped into oversold territory at 29.96, which could signal a potential bounce, the MACD is negative, and the Stochastic is showing a buy signal (%K > %D) in conjunction with the oversold RSI. This is a classic case of oversold conditions persisting within a powerful trend. The price is also trading below the middle Bollinger Band, reinforcing the bearish sentiment. The general signal across this timeframe is a strong 'SELL'.
The daily chart presents a slightly different nuance. The trend is classified as 'Neutral' with 50% strength, yet the ADX is still elevated at 25.72, suggesting a lingering downtrend. The RSI is deeply oversold at 26.23, offering a potential glimmer of hope for a reversal. Similarly, the Stochastic is in the oversold region, with %K above %D, which historically can precede a bounce. However, the MACD is negative, and the price is trading below the lower Bollinger Band, indicating significant selling pressure. The overall signal on the daily chart is 'SAT' (Sell), but the oversold indicators suggest that further downside might be limited in the very near term, or at least that a corrective bounce could be on the cards. This conflicting signal between the strong bearish trend on the 4-hour and the oversold conditions on the daily is where much of the current trading tension lies.
The divergence between the strong 4-hour downtrend (ADX 61.54) and the deeply oversold daily RSI (26.23) is the critical technical battleground. A bounce from daily oversold levels is possible, but it will need to overcome the entrenched bearish momentum seen on shorter timeframes. Confirmation of a bottom would likely require a break back above the 4-hour middle Bollinger Band and a bullish MACD crossover.
The general signal across all analyzed timeframes leans towards selling, with the 1-hour and 4-hour charts showing strong bearish conviction. The daily chart, while oversold, still carries a 'SELL' signal overall, highlighting the dominant downward pressure. The key levels derived from the data are crucial: Support at $4,321.58, $4,277.23, and $4,248.48. Resistance is seen at $4,394.68, $4,423.43, and $4,467.78. A break decisively below the immediate support zone could accelerate the decline, while a sustained move above the $4,394.68 resistance would be the first sign of a potential trend shift.
The Geopolitical Undercurrent: Gold's Safe-Haven Status Tested
While technical indicators currently point towards caution for gold, the geopolitical landscape remains a significant, albeit somewhat muted, supporting factor. Recent news indicates lingering geopolitical tensions, particularly concerning the Middle East, which historically provides a baseline demand for gold as a safe-haven asset. The spike in Brent and WTI crude prices, as mentioned, is a direct reflection of these heightened risks, and any further escalation could quickly shift market sentiment back towards gold.
However, the market appears to be prioritizing the dollar's strength and the prospect of interest rate differentials over immediate geopolitical fears. This is partly due to the Federal Reserve's stance. While specific Fed commentary isn't detailed in the provided data, market participants are constantly pricing in future monetary policy. If the Fed maintains a hawkish tone or if inflation proves more persistent than expected, higher real interest rates could emerge, making non-yielding gold less attractive. Conversely, any hint of a Fed pivot or concerns about economic slowdown could reignite safe-haven demand for gold. The current data doesn't provide explicit forward guidance from the Fed, but the market's reaction to the DXY suggests that dollar strength, potentially driven by a 'higher for longer' interest rate narrative, is the immediate focus.
Central bank buying has been a significant driver for gold in recent years, with Russia and China being notable accumulators. This structural demand provides a solid floor for gold prices in the long run. While this data doesn't include specific central bank purchase figures for the current period, the knowledge that these large-scale buyers are active in the market adds a layer of fundamental support that often prevents deep, prolonged bear markets. However, these institutional flows tend to be longer-term plays and may not counteract short-term technical selling pressure driven by macro factors like dollar strength.
The interplay between these fundamental drivers - geopolitical risk, central bank policy, inflation, and structural demand - creates a dynamic environment. Currently, the macro headwinds from a strong dollar and potentially higher-for-longer interest rates appear to be outweighing the safe-haven bid from geopolitical uncertainty and rising oil prices. This is why gold is testing support despite events that would typically send it higher. The market is complex, and traders must weigh all these factors, not just the headlines about global conflicts.
Trade Scenarios and Strategic Outlook
Given the current technical setup and market correlations, several scenarios are plausible for XAUUSD. The prevailing bearish momentum on shorter timeframes, coupled with dollar strength, suggests that further downside remains a primary risk. However, the oversold conditions on the daily chart cannot be ignored and hint at the possibility of a corrective bounce or a stabilization.
Bearish Scenario: Downside Continuation
65% ProbabilityConsolidation Scenario: Range-Bound Volatility
25% ProbabilityBullish Scenario: Oversold Bounce
10% ProbabilityThe trade plan hinges on risk management and confirmation. For bearish traders, a break below $4,321.58 offers a clear entry point, targeting $4,277.23 and potentially $4,248.48. The invalidation level would be a close back above $4,394.68. For those anticipating a short-term bounce from oversold daily conditions, waiting for confirmation is key. This could involve a break above $4,394.68, targeting $4,423.43 and then $4,467.78, with invalidation below $4,321.58. The neutral scenario involves range-bound trading, likely between the immediate support and resistance levels, which could persist until a clearer macro signal emerges.
Given the strong 4-hour downtrend (ADX 61.54) and the daily oversold RSI (26.23), the most prudent approach for short-term traders is to remain cautious. Look for confirmation of either a breakdown below immediate support or a decisive bounce from current levels, ideally with increased volume and a shift in momentum indicators. Long-term investors might view current levels as an attractive entry point for dollar-cost averaging, anticipating eventual recovery driven by safe-haven demand and structural central bank buying.
The current market environment for gold is a battle between short-term technical weakness, amplified by dollar strength, and longer-term fundamental support from geopolitical risks and structural demand. While the price is testing support at $4,352.22, the prevailing trend on shorter timeframes suggests further downside is possible. However, the deeply oversold daily indicators hint that any further declines might be met with buying interest. Patience and strict risk management will be crucial for navigating this uncertain period. The key will be observing whether the dollar continues its ascent or if geopolitical fears begin to reassert gold's traditional safe-haven appeal.
| Indicator | Value | Signal | Interpretation |
|---|---|---|---|
| RSI (14) | 44.33 | Neutral | Slight downward bias, approaching oversold on 1H |
| MACD Histogram | -15.20 | Positive Momentum | Momentum still positive but fading on 1H; negative on 4H/1D |
| Stochastic | K=24.8, D=35.08 | Sell Signal | %K < %D, indicating further downside potential on 1H |
| ADX | 24.81 | Moderate Trend | Indicates a moderate trend strength on 1H, but 4H shows very strong trend (61.54) |
| Bollinger Bands | Middle Band | Below Middle Band | Price trading below the middle band on 1H, suggesting bearish pressure |
Frequently Asked Questions: XAUUSD Analysis
What happens if XAUUSD breaks below the $4,321.58 support level?
A break below $4,321.58 would confirm the bearish scenario, with potential targets at $4,277.23 and $4,248.48. This would indicate continued downside pressure driven by dollar strength and risk aversion.
Should I buy XAUUSD at current levels of $4,352.22 given the daily oversold RSI at 26.23?
While the daily RSI is oversold, the strong bearish trend on shorter timeframes (ADX 61.54) suggests caution. A potential bounce is possible, but confirmation above $4,394.68 resistance is needed for a high-probability bullish setup.
Is the RSI at 44.33 on the 1-hour chart a sell signal for XAUUSD?
An RSI of 44.33 indicates a neutral stance but with a downward bias on the 1-hour chart. Combined with the Stochastic sell signal and price below the middle Bollinger Band, it reinforces the bearish short-term outlook, suggesting potential for further declines.
How will the rising DXY at 99.19 affect XAUUSD this week?
A rising DXY typically pressures gold by making it more expensive for foreign buyers. With the DXY showing strong upward momentum, it is likely to continue weighing on XAUUSD unless geopolitical risks or shifting Fed expectations provide a counter-narrative.
Track markets in real-time
AI-powered analysis, technical indicators and real-time price data.
Join Our Telegram Channel
Breaking market news, AI analysis and trading signals instantly.
Join Channel