GBPUSD Tests Resistance at $1.34; What's Next for the Pair?
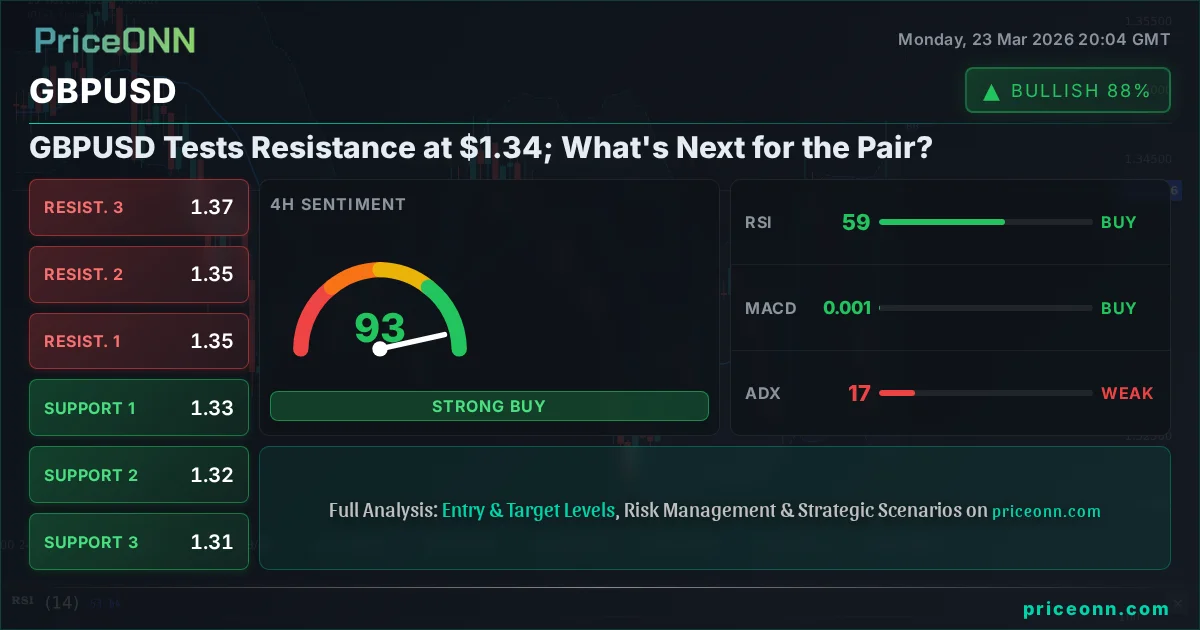
GBPUSD hovers near $1.34 as markets digest mixed signals. With key resistance overhead and support at $1.3279, traders eye crucial price action.
Is the recent strength in GBPUSD sustainable, or are we just seeing a temporary pause before a deeper dive? The pair is currently trading just shy of the $1.34 mark, a level that has proven to be a significant pivot point in recent trading sessions. As traders digest a complex mix of global economic data, central bank rhetoric, and ongoing geopolitical undercurrents, the path forward for Sterling against the Greenback remains decidedly murky. Understanding the interplay between the Bank of England's monetary policy stance, the US Federal Reserve's hawkish leanings, and broader market sentiment is crucial for navigating this currency pair.
- GBPUSD is trading at $1.34, facing resistance with key support identified at $1.3279.
- The 1H RSI at 59.43 indicates upward momentum but remains in neutral territory, suggesting caution.
- The 4H ADX at 17.18 points to a weak trend, signaling choppy or range-bound conditions.
- Geopolitical tensions and diverging central bank policies are key drivers influencing GBPUSD's correlation with the DXY.
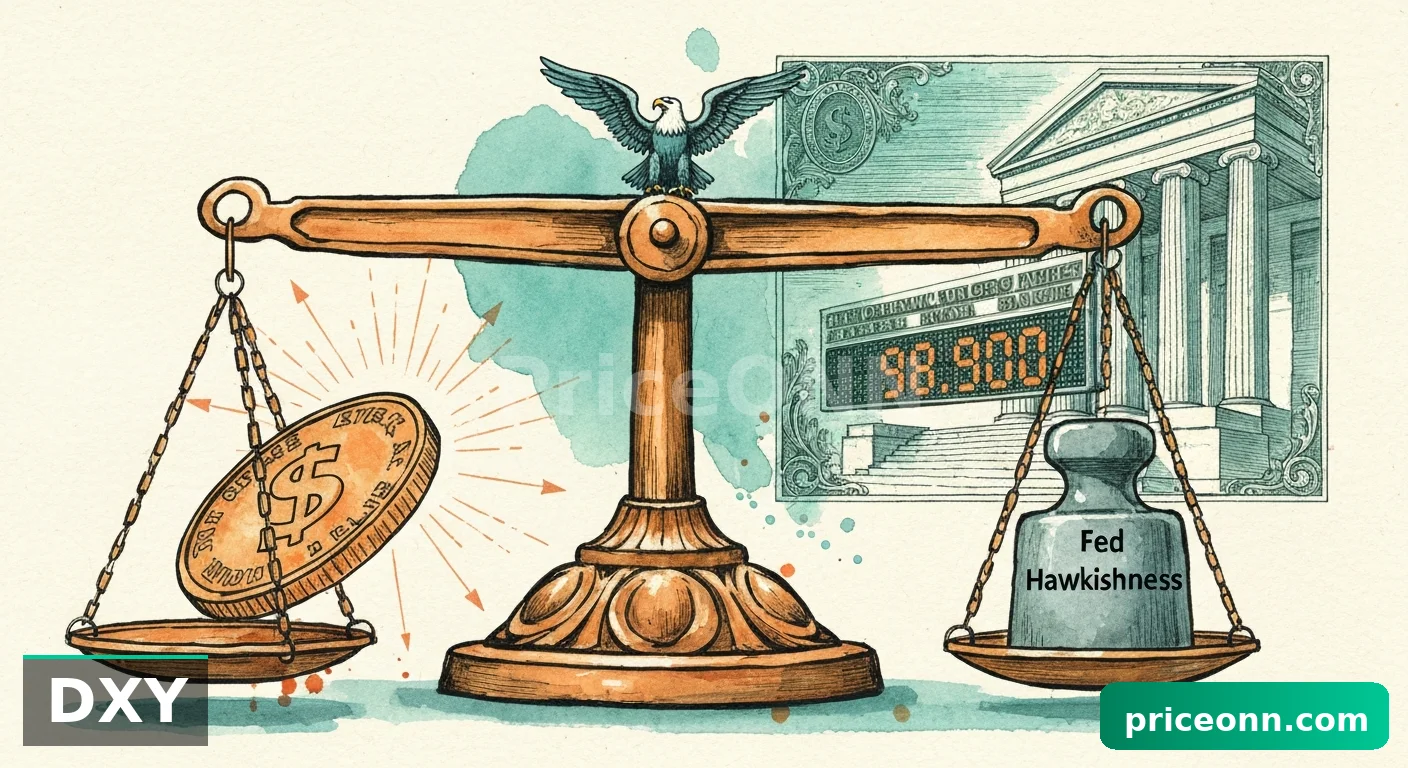
The current market environment for GBPUSD is characterized by a delicate balance of opposing forces. On one hand, the US Dollar Index (DXY) has been experiencing some pullbacks, trading at 98.92, which typically offers a tailwind to major currency pairs like GBPUSD. However, this has not translated into a decisive breakout for Sterling. The 1H chart shows GBPUSD hovering near $1.34, with the RSI at 59.43. While this suggests positive momentum, it's still comfortably within the neutral zone, not yet signaling an overbought condition that might prompt immediate profit-taking. The MACD on the 1H timeframe is positive, with its signal line above, reinforcing the idea of current upward pressure, but the overall strength of the trend, as indicated by the ADX at 31.64, suggests a strong, albeit potentially choppy, uptrend is in play.
Navigating the Technical Landscape
Delving deeper into the technicals, the 4-hour chart paints a slightly different picture, highlighting the nuances traders must consider. While the 1-hour momentum might appear encouraging, the 4-hour ADX reading of 17.18 signals a weaker trend, indicating that the market might be consolidating or entering a range-bound phase. This is a crucial observation; a strong trend is needed for sustained moves, and a low ADX value suggests caution against chasing breakouts that might fail. The Stochastic Oscillator on the 4H chart, with K at 55.31 and D at 31.35, is in bullish territory, suggesting further upside potential, but the divergence between the shorter-term bullish signals and the weaker 4H trend indicator underscores the current indecision.
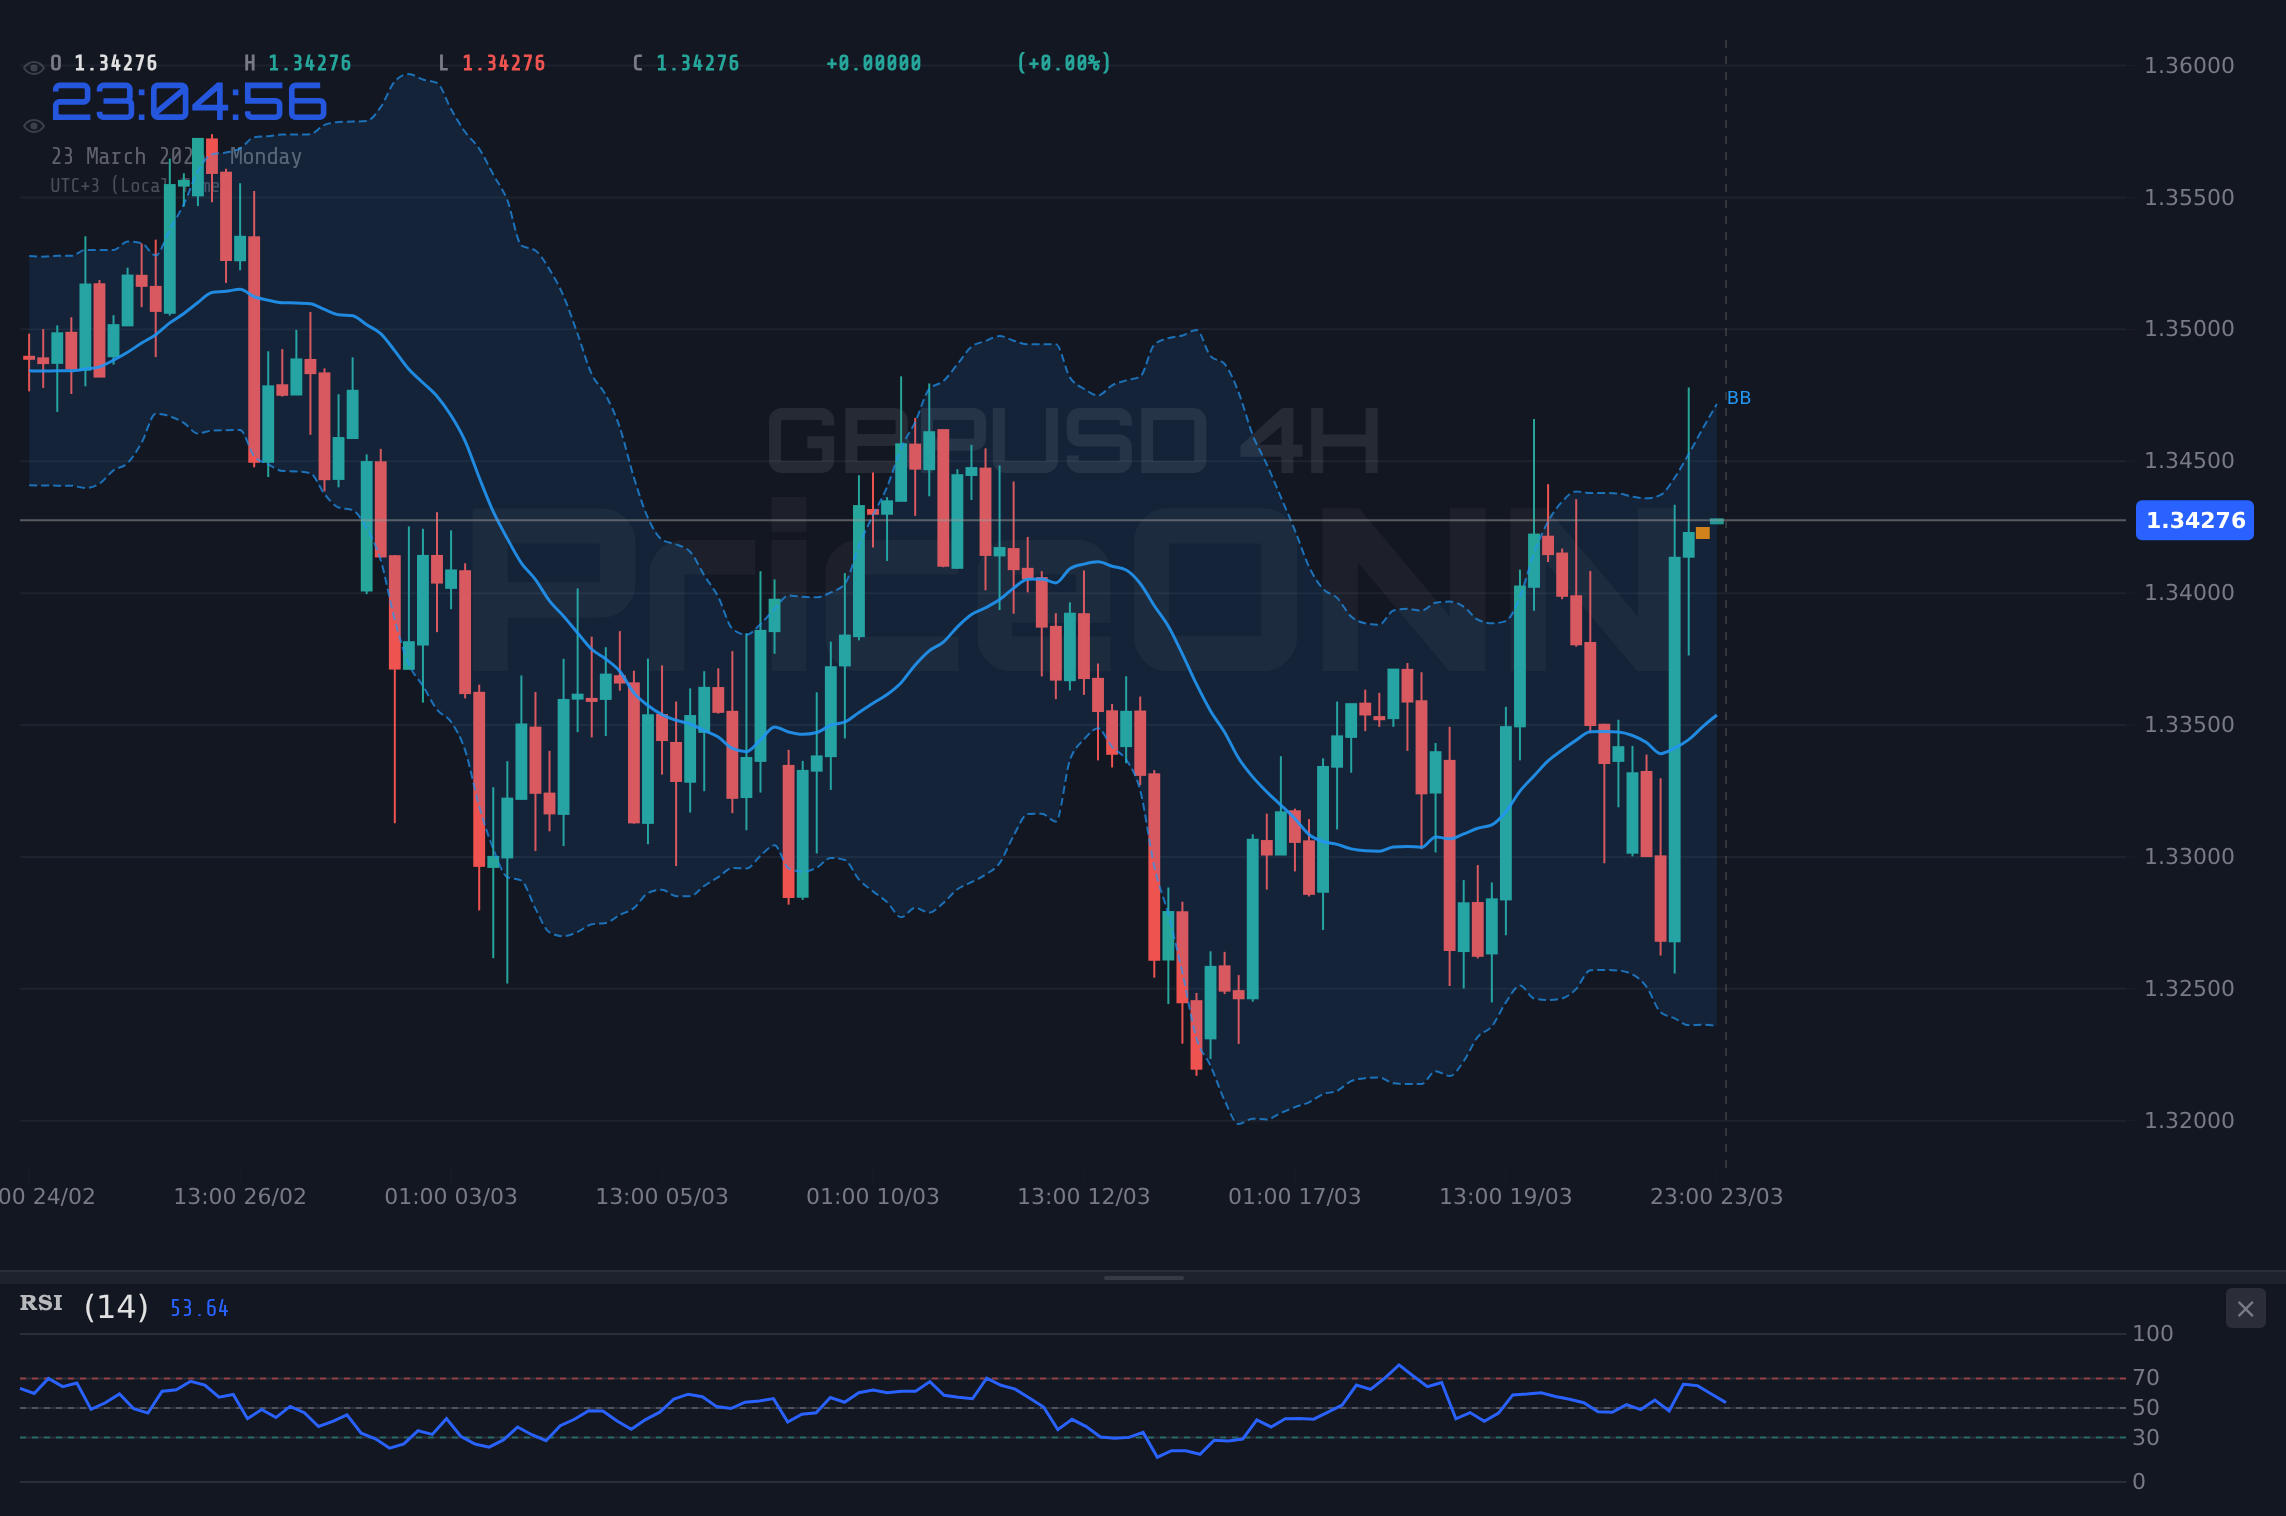
On the daily timeframe, GBPUSD's position becomes even more critical. The pair is trading just above the 1.34 level, but the daily ADX at 29.09 still indicates a strong trend, albeit a predominantly downward one recently. The RSI(14) at 50.74 is sitting right at the midpoint, offering no clear directional bias from this indicator alone. However, the MACD is positive, and the Bollinger Bands are showing the price above the middle band, which historically tends to act as a support level. This confluence of indicators on the daily chart suggests that while the longer-term trend might still hold bearish undertones from previous weeks, the current price action is attempting to build a base. The key will be whether buyers can sustain momentum above $1.34 and challenge higher resistance levels.
The Dollar's Shadow: DXY and Cross-Market Dynamics
The performance of the US Dollar Index (DXY) is inextricably linked to GBPUSD's trajectory. Currently at 98.92, the DXY's recent dip from its highs has provided some breathing room for Sterling. However, the daily chart for DXY shows a strong upward trend (ADX 34.7), suggesting that the dollar's underlying strength remains intact. This presents a significant headwind for GBPUSD. A rising DXY typically puts pressure on Sterling due to the inverse relationship. If the DXY finds renewed buying interest and pushes higher, it would likely cap any rallies in GBPUSD and potentially lead to a retest of lower support levels, such as the critical $1.3279 mark.
The correlation between GBPUSD and risk appetite, often gauged by the S&P 500 and Nasdaq, is also worth noting. The S&P 500 is currently showing a daily upward trend (ADX 46.22), trading at 6573.65, which implies a generally positive risk sentiment. However, the 4-hour chart shows a bearish trend, and the daily RSI is below 40, indicating underlying weakness. This mixed signal from the equity markets adds another layer of complexity. A shift towards risk aversion could see investors flocking to safe-haven assets, potentially boosting the dollar and weighing on GBPUSD, even if the broader trend on the S&P 500 suggests otherwise in the short term. This 'risk-on, risk-off' dynamic is a constant battleground for currency traders.
Central Banks and the Sterling Tightrope Walk
The monetary policy divergence between the Bank of England (BoE) and the US Federal Reserve remains a central theme. While the Fed has signaled a more hawkish stance, potentially delaying rate cuts amid persistent inflation, the BoE faces a more delicate balancing act. Inflation in the UK, while easing, remains a concern, but the specter of a potential recession looms large. This has led to a more cautious approach from the BoE, with market participants pricing in a greater likelihood of rate cuts sooner rather than later compared to the Fed. This interest rate differential is a significant factor supporting the dollar against Sterling and caps rallies in GBPUSD. Any hint of dovishness from the BoE, or conversely, continued hawkishness from the Fed, could exert considerable downward pressure on GBPUSD.
The recent economic data releases provide further context. While the latest unemployment figures and inflation data from the UK have been mixed, they haven't provided a clear catalyst for a strong directional move. Similarly, US data, while showing some resilience, hasn't dramatically shifted Fed expectations. This data dependency means that upcoming economic releases will be critical. For instance, any surprises in US Non-Farm Payrolls or UK CPI figures could easily shift the market's focus and trigger significant volatility in GBPUSD. Traders are constantly scanning the economic calendar for these potential inflection points, understanding that a single data surprise can unravel months of price action.
Geopolitical developments also continue to cast a long shadow. The escalating tensions in the Middle East, as highlighted by reports of surging oil prices and increased demand for the US dollar as a safe-haven asset, add another layer of uncertainty. While gold prices have seen some recovery, the underlying risk aversion driven by these geopolitical events can indirectly impact GBPUSD by strengthening the dollar. This 'flight to safety' dynamic means that even if the fundamental economic outlook for the UK were to improve, external geopolitical shocks could still push GBPUSD lower simply by boosting demand for the greenback.
The $1.3279 Support Level is Critical: A decisive break below this level on the daily chart would signal a significant shift in sentiment and could open the door for further downside towards $1.31353. Traders should monitor volume and momentum on any such move.
The Path Ahead: Scenarios for GBPUSD
Considering the technicals and the broader market context, several scenarios are plausible for GBPUSD. The immediate battleground is around the $1.34 level. If buyers can consolidate above this psychological mark and push towards the R1 resistance at $1.34702, the bullish case gains traction. This would likely require continued dollar weakness or positive UK-specific news. However, the presence of strong resistance just above, and the mixed signals from longer-term trend indicators, suggest that such a move might face significant headwinds. The market's ability to hold above the S1 support at $1.34225 will be a key determinant in the short term.
Conversely, a failure to hold above $1.34 could see GBPUSD retreating towards the $1.3279 support level. This bearish scenario would be amplified if the DXY strengthens significantly or if the BoE signals a more dovish policy path than previously anticipated. On the 4-hour chart, the ADX at 17.18 suggests that any downward move might initially be choppy, but a clear break below $1.3279, confirmed by increased volume and negative momentum on the MACD, could lead to a more sustained decline. The daily RSI at 42.83 offers some room for further downside before reaching oversold territory, making this a credible risk.
A neutral or range-bound scenario is also highly possible, especially given the conflicting signals between different timeframes and indicators. The weak ADX on the 4-hour chart supports this. In such a scenario, GBPUSD might oscillate between the $1.3279 support and the $1.34702 resistance. This choppy price action would be frustrating for trend followers but could present opportunities for range traders who can capitalize on short-term bounces off support and pullbacks from resistance. Patience and strict risk management would be paramount in navigating such a market. The key is to wait for a clear breakout or breakdown with confirmation from volume and momentum indicators before committing to a directional trade.
Bearish Scenario: Sterling Under Pressure
60% ProbabilityBullish Scenario: Sterling's Recovery Attempt
30% ProbabilityNeutral Scenario: Range-Bound Consolidation
10% ProbabilityFrequently Asked Questions: GBPUSD Analysis
What happens if GBPUSD breaks below the $1.3279 support level?
A decisive break below $1.3279 would invalidate the current bullish attempts and signal a continuation of the broader downtrend. This could lead to further declines towards the $1.31353 level, especially if accompanied by dollar strength or dovish BoE commentary.
Should I buy GBPUSD at current levels near $1.34 given the mixed technical signals?
Caution is advised. While 1H indicators show some bullish momentum, the weaker 4H trend (ADX 17.18) and daily RSI at 50.74 suggest a lack of conviction. A confirmation of strength above $1.34702 or a clear bounce from $1.3279 would be needed for a higher probability long entry.
Is the RSI at 59.43 a buy signal for GBPUSD right now?
An RSI of 59.43 on the 1H chart indicates positive momentum but is not yet in overbought territory. It suggests buyers are active but doesn't confirm a strong bullish trend on its own. Confirmation from other indicators and price action, especially on higher timeframes, is crucial.
How will the upcoming Fed meeting impact GBPUSD this week?
The Federal Reserve's stance on interest rates is a major driver for GBPUSD. A more hawkish tone, suggesting delayed rate cuts, would likely strengthen the USD and push GBPUSD lower, potentially towards the $1.3279 support. Conversely, any hint of a dovish pivot could support Sterling.
| Indicator | Value | Signal | Interpretation |
|---|---|---|---|
| RSI (14) | 50.74 | Neutral | Mid-range, no clear bias |
| MACD Histogram | 0.003 | Bullish | Positive momentum building |
| Stochastic | K:62.49, D:39.23 | Bullish | Bullish crossover in progress |
| ADX | 29.09 | Strong Trend | Indicates trend strength (downward bias) |
| Bollinger | Middle Band | Watch | Price above middle band, potential support |
Track markets in real-time
AI-powered analysis, technical indicators and real-time price data.
Join Our Telegram Channel
Breaking market news, AI analysis and trading signals instantly.
Join Channel