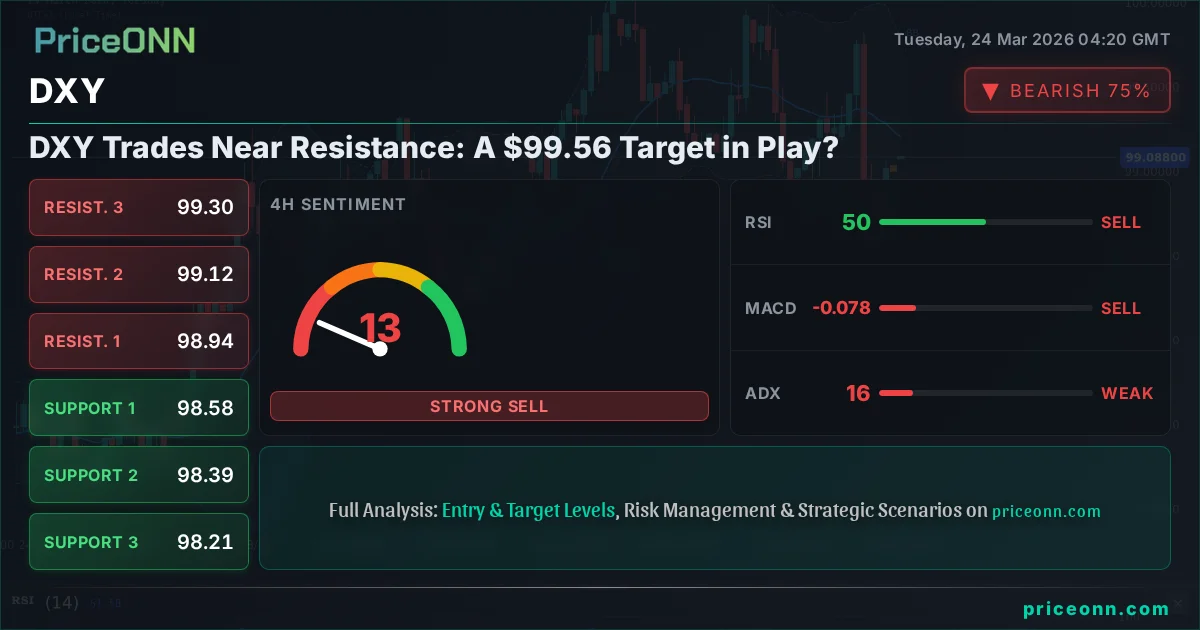
DXY Trades Near Resistance: A $99.56 Target in Play?
The DXY Dollar Index hovers near $99.23 resistance. With mixed signals and strong ADX, a breakout looms. What's next for the dollar?
The US Dollar Index (DXY) is currently finding itself at a critical juncture, trading near the $99.23 mark. This level represents a significant area of resistance, and market participants are keenly watching to see if the dollar can muster the strength to push higher towards a potential $99.56 target. The DXY's recent price action has been characterized by a strong upward trend on the daily chart, reinforced by a powerful ADX reading, yet also showing signs of consolidation and potential divergence across shorter timeframes. This complex technical picture suggests that while upward momentum is present, the path forward is far from clear-cut, with significant implications for global forex markets, commodities, and risk sentiment.
- The DXY is trading near $99.23, a critical resistance level.
- The daily chart shows a strong upward trend (ADX 32.74), but 1-hour and 4-hour charts present mixed signals.
- A potential target of $99.56 is in play if resistance breaks, while support lies around $98.90.
- Geopolitical tensions and upcoming central bank policy remain key drivers for the dollar's direction.
This dance around the $99.23 level is more than just a technical tug-of-war; it's a reflection of broader market anxieties and expectations. The dollar's strength, or lack thereof, has ripple effects across the financial world. A strengthening DXY typically puts pressure on gold and silver, as seen with XAUUSD currently trading at $4341.15 and XAGUSD at $66.83, both experiencing significant daily declines. Similarly, major currency pairs like EUR/USD (currently $1.15769) and GBP/USD ($1.33892) often face headwinds when the dollar index rallies. This intermarket correlation is a vital piece of the puzzle for any trader trying to navigate the current landscape.
Looking at the daily timeframe, the DXY's trend is firmly bullish with a strength of 91%, supported by an ADX of 32.74, indicating a robust trend is in play. The RSI(14) at 56.09 sits comfortably in neutral territory, suggesting room for further upside before becoming overbought. However, the picture becomes more nuanced when we zoom into shorter timeframes. The 1-hour chart shows a neutral trend with an ADX of 23.62, a mid-strength reading that hints at consolidation. Here, the RSI is at 54.19, and while the Stochastic Oscillator's %K line (94.45) is flashing overbought signals, the overall ADX suggests the trend isn't yet committed. This divergence between the daily's strong bullish conviction and the 1-hour's hesitant stance is precisely what creates trading opportunities, but also significant risk.
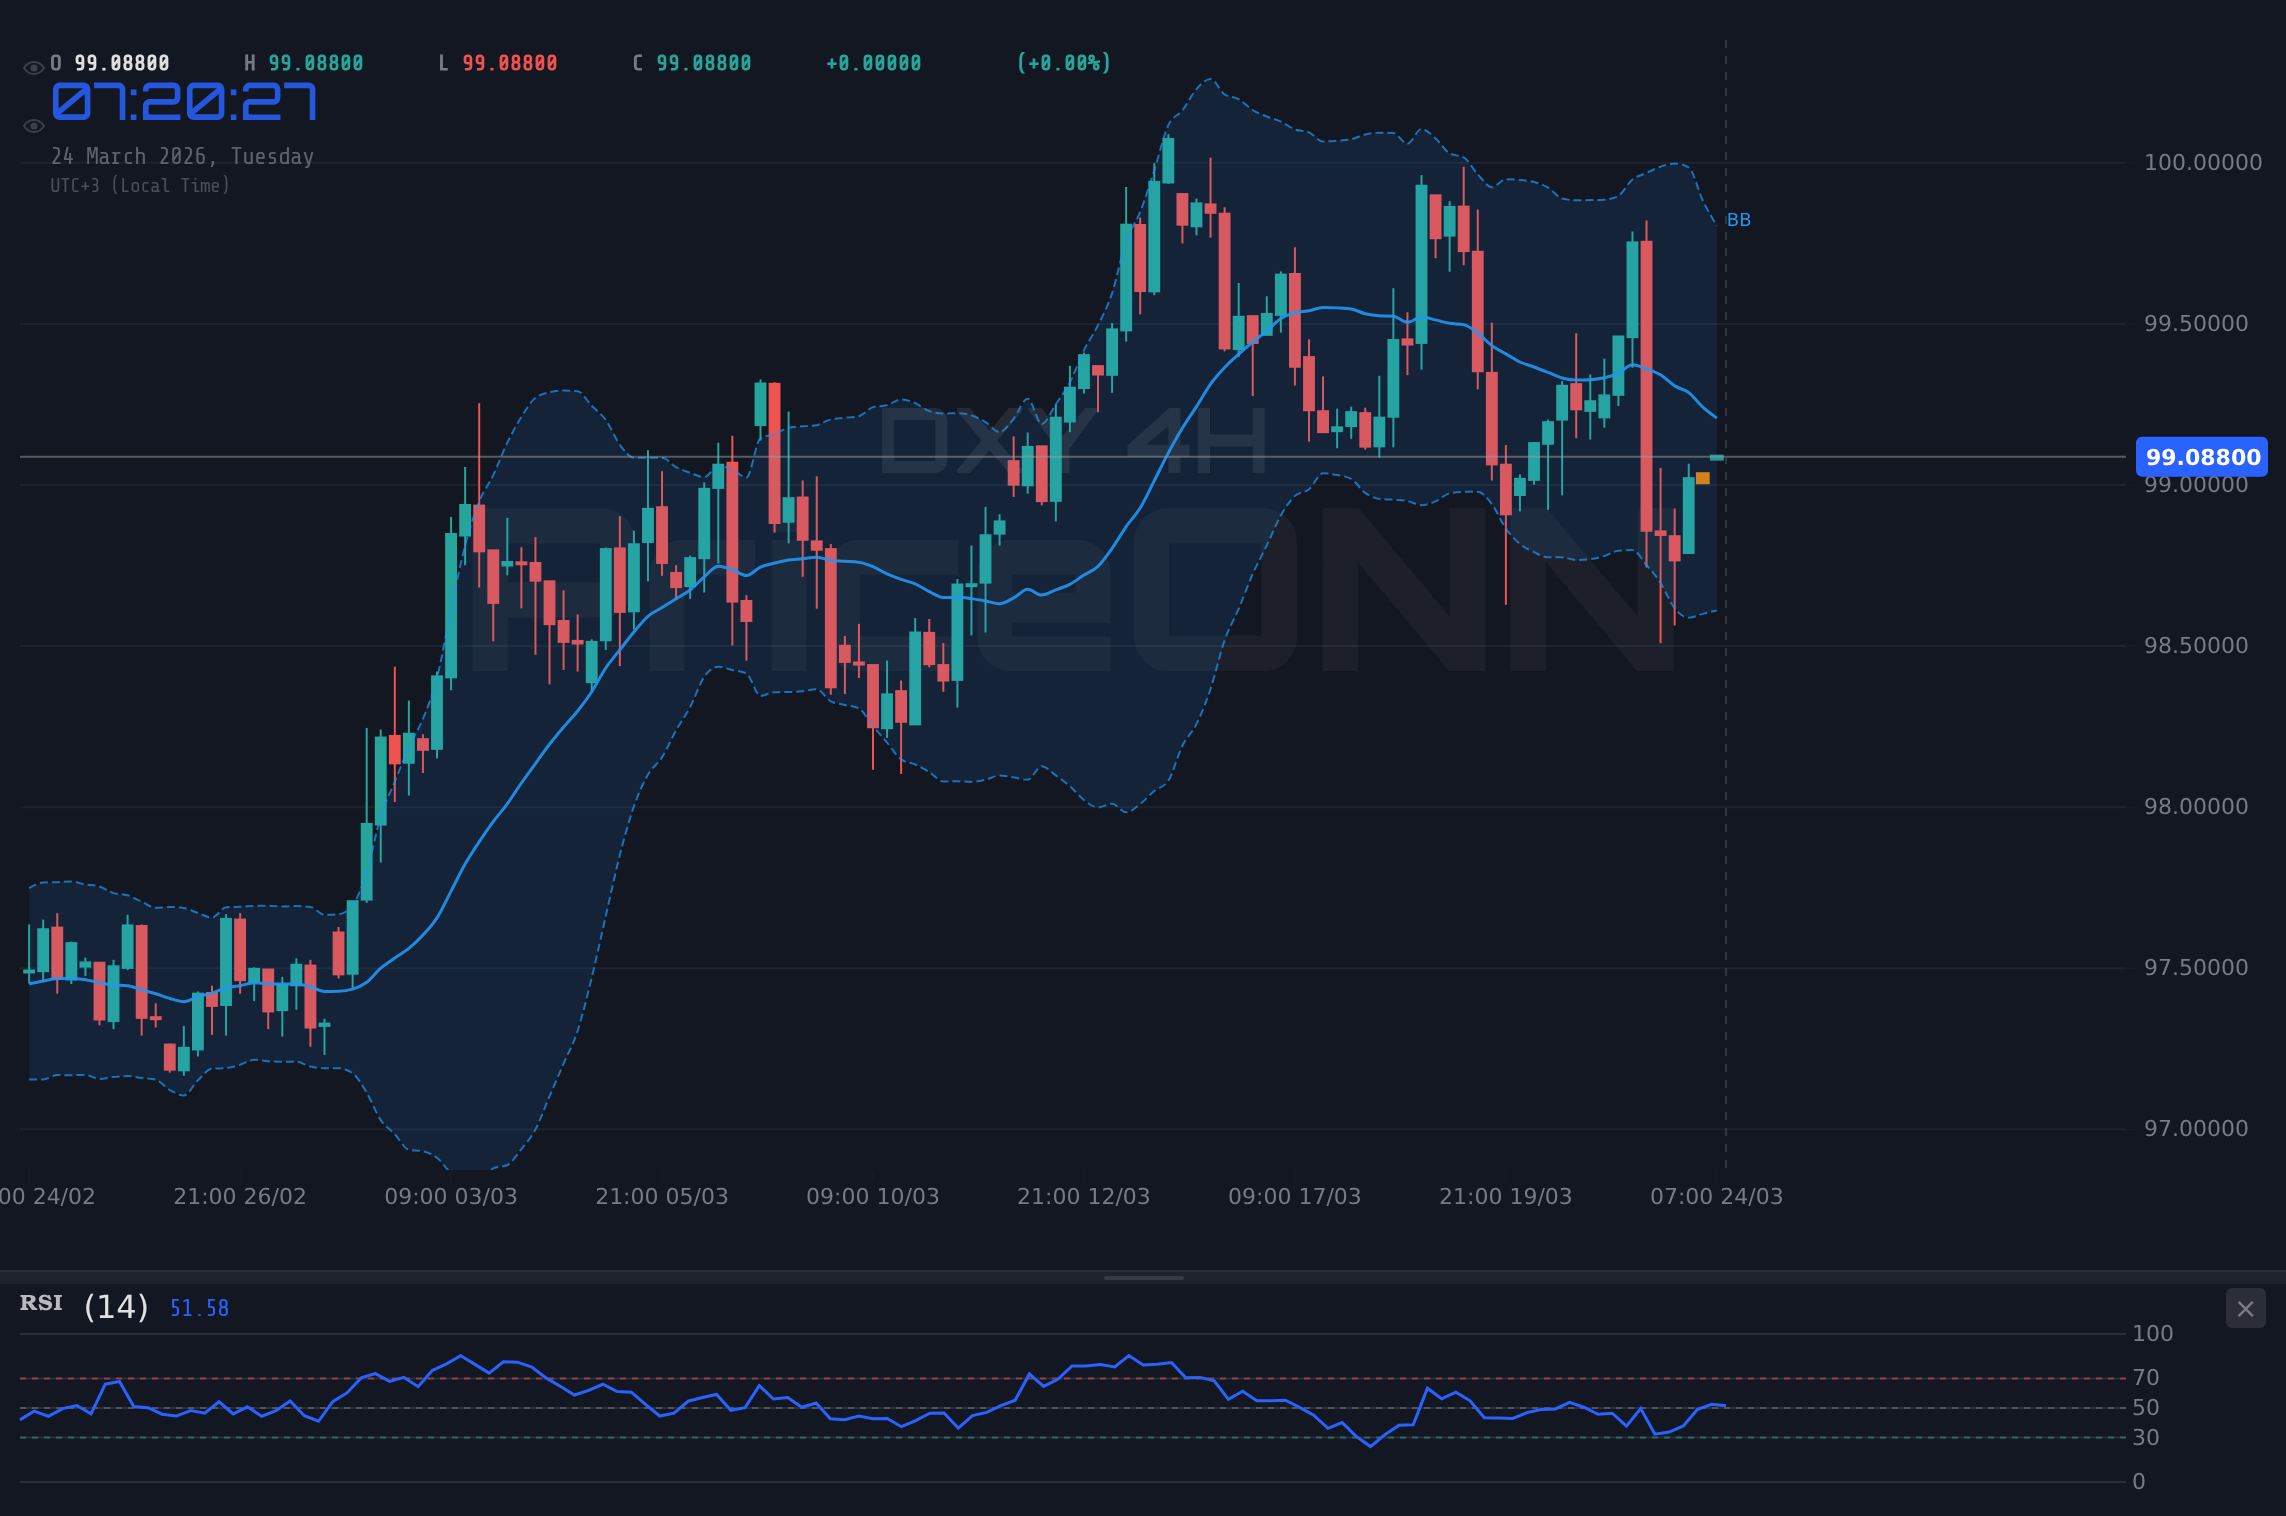
The 4-hour chart adds another layer of complexity. While the trend is neutral with a strength of 50% and a weaker ADX of 15.78, suggesting a choppy, ranging market, the RSI is at 49.68, indicating indecision. The MACD is currently below its signal line, hinting at bearish momentum on this timeframe. This conflicting data across different timeframes underscores the need for a multi-scenario approach. Traders must consider what conditions would validate a continued upward push towards $99.56 and what would signal a reversal or a deeper consolidation phase. The current price action is a battleground where short-term traders might find opportunities in range-bound strategies, while longer-term players are likely waiting for a clearer directional signal.
The Bull's Roadmap: Breaking Through Resistance
For the bulls to maintain control and push the DXY higher, a decisive break above the immediate resistance at $99.23 is paramount. This isn't just about breaching the level; it's about holding there and then building momentum. The key trigger for this bullish scenario would be a strong daily close above $99.23, ideally accompanied by increased trading volume. If this breakout occurs, the next significant resistance level to watch is $99.56. This level has acted as a ceiling in the past, and clearing it would signal a significant shift, potentially opening the door for a move towards $100.34 and perhaps even the psychological barrier of $100.87 in the medium term. The ADX on the daily chart, currently at a robust 32.74, supports the idea that a strong trend could emerge if this resistance breaks. However, the mixed signals on the 1-hour chart, particularly the Stochastic oscillator flashing overbought at 94.45, suggest that any immediate push might face some profit-taking or consolidation before a sustained move higher can be confirmed.
The current market sentiment, as indicated by the DXY's upward trajectory, suggests a degree of risk aversion globally. This is often exacerbated by geopolitical tensions, which have been a recurring theme in recent news cycles. Reports of escalating Middle East tensions, even amidst diplomatic efforts, continue to fuel demand for safe-haven assets like the US dollar. While some news about potential Iran truces has briefly boosted the Euro, the underlying geopolitical uncertainty often favors the dollar's role as a primary safe haven. For the bullish DXY scenario to materialize and sustain, this risk-off sentiment needs to persist or even intensify, making investors shy away from riskier assets and flock towards the perceived safety of US dollar-denominated assets.
Furthermore, the Federal Reserve's policy stance remains a critical undercurrent. While recent economic data might not be screaming for immediate rate cuts, any hawkish undertones from Fed officials can significantly bolster the dollar. The market is constantly parsing speeches and statements for clues about the future path of interest rates. If the Fed signals a more prolonged period of higher rates, or if inflation data continues to surprise to the upside, it would provide a strong tailwind for the DXY, reinforcing the bullish case. The interplay between geopolitical risks and monetary policy expectations creates a fertile ground for dollar strength, especially if other major central banks appear more dovish.
The Bears' Defensive Stand: Holding the Line at $99.23
Conversely, the bearish scenario hinges on the DXY's inability to decisively break through the $99.23 resistance. If the index fails to hold above this level, or if it closes the daily session below it, the bears will likely take control. The immediate support level to watch in such a scenario is $98.97, followed by $98.92. A breakdown below these levels would invalidate the bullish argument and signal a potential move lower. The 4-hour chart, with its weaker ADX of 15.78 and neutral RSI at 49.68, could become more relevant, suggesting a period of range-bound trading or even a deeper correction. The MACD on this timeframe is currently below the signal line, adding to the bearish short-term outlook.
The 1-hour chart's stochastic oscillator, which is currently flashing overbought at 94.45, could be an early warning sign. If this oscillator begins to turn down, it might signal that the upward momentum is exhausted, paving the way for sellers to step in. A failure to hold the $99.23 resistance could lead to a quick test of the lower support levels, potentially triggering stop-loss orders and accelerating the decline. The ADX on the 1-hour chart at 23.62 suggests that while a trend might not be strongly established, there's enough momentum for a move downwards if the key resistance fails. This could see the DXY retrace towards the $98.58 area, which represents a more significant support zone on the 4-hour chart.
Geopolitical developments could also play into the hands of the bears, albeit indirectly. If diplomatic breakthroughs occur, such as a de-escalation in the Middle East or positive news regarding trade relations, risk appetite could increase. This would likely lead to a sell-off in the dollar as investors rotate into riskier assets. While the DXY's safe-haven status is strong, it's not immune to shifts in global risk sentiment. If the market perceives that geopolitical risks are receding, the demand for the dollar as a safe haven would diminish, potentially leading to a correction. Furthermore, any surprising dovish signals from the Fed, or data suggesting a significant slowdown in the US economy, could also put downward pressure on the dollar, validating the bearish outlook.
The Waiting Game: Consolidation Around $99.23
A third, and often overlooked, scenario is that the DXY remains largely range-bound around the $99.23 level for an extended period. This can happen when conflicting forces are at play, such as strong daily bullish trends being countered by short-term overbought conditions or indecisive economic signals. The ADX readings across different timeframes highlight this potential for choppiness: strong on the daily (32.74), weak on the 4-hour (15.78), and moderate on the 1-hour (23.62). This suggests that while there's underlying bullish conviction, the immediate path is being contested.
In a consolidation scenario, price action might oscillate between the immediate support near $98.97 and the resistance at $99.23. Traders might look for opportunities to buy near the lower end of this range and sell near the upper end, expecting the index to bounce between these levels. This type of trading environment is challenging because it requires patience and precise execution. Breakouts from such ranges can be sharp and sudden, catching traders off guard who have become accustomed to the sideways movement. The key here is to watch for divergences in indicators or a significant increase in volume that might signal an impending breakout. For instance, if the RSI consistently fails to move above 60 while the price keeps testing resistance, it could indicate building pressure within the range.
This consolidation could be driven by a standoff between geopolitical fears (which support the dollar) and a potential shift in central bank expectations or improving global economic sentiment (which could weaken it). Until a clear catalyst emerges - either a significant geopolitical event, a major economic data surprise, or a definitive shift in Fed policy guidance - the DXY might remain in this 'waiting game' phase. This period of indecision can be frustrating for traders seeking clear directional trades, but it also presents opportunities for those skilled in range-bound strategies, provided risk management is paramount.
The Probability Game: Which Scenario Dominates?
Considering the data, the most probable scenario in the short to medium term appears to be a continued bullish bias, but with significant caution due to the mixed signals on shorter timeframes and the proximity to resistance. The strong daily trend and ADX suggest underlying strength that shouldn't be ignored. However, the choppiness indicated by the 4-hour ADX (15.78) and the overbought stochastic on the 1-hour chart (94.45) point to potential headwinds. Therefore, I assign a higher probability to a scenario that involves a test of resistance, a potential short-term pullback or consolidation, followed by a possible breakout. Let's break down the probabilities:
Bullish Scenario: The Breakout Play
55% ProbabilityNeutral Scenario: The Waiting Game
30% ProbabilityBearish Scenario: Resistance Holds Firm
15% ProbabilityThe prevailing risk-off sentiment, coupled with the dollar's safe-haven appeal amidst ongoing geopolitical uncertainties, lends weight to the bullish scenario. However, the technical indicators on shorter timeframes, particularly the overbought stochastic on the 1-hour chart and the weak ADX on the 4-hour, suggest that the path to $99.56 might not be a straight line. A period of consolidation or a minor pullback before a potential breakout seems plausible. The key will be how price action behaves around the $99.23 resistance and the subsequent reaction if it's breached or rejected.
What I'm Watching This Week
This coming week will be crucial for determining the DXY's next major move. Several factors will be under the microscope:
- Daily Close Above $99.23: This is the immediate trigger for the bullish scenario. A decisive daily close above this level, especially with solid volume, would confirm the breakout and open the path to $99.56.
- Failure at Resistance: Conversely, if the DXY fails to break $99.23 and starts to pull back, closing below $98.97 would be a strong bearish signal, targeting lower levels like $98.58.
- Geopolitical Developments & Fed Speak: Any escalation or de-escalation in global conflicts, or hawkish/dovish commentary from Fed officials, could provide the catalyst for a decisive move out of the current range.
The interplay between these technical levels and fundamental drivers will dictate the DXY's trajectory. While the daily trend remains bullish, the short-term technicals and broader market sentiment warrant a cautious approach. Traders should remain vigilant for confirmation signals and manage risk accordingly. The market is currently at a crossroads, and the next few trading sessions will likely provide much-needed clarity.
Frequently Asked Questions: DXY Analysis
What happens if DXY breaks above the $99.23 resistance level?
If DXY decisively breaks and closes above $99.23, it validates the bullish scenario. The immediate upside target would be $99.56, with a secondary target at $100.34. This move would likely be driven by continued risk aversion or hawkish Fed sentiment.
Should I buy DXY at current levels of $99.23 given the mixed signals?
Buying directly at resistance carries significant risk. While the daily trend is bullish, the shorter-term charts show overbought conditions and weak trend strength. A more prudent approach would be to wait for a confirmed breakout above $99.23 or a pullback to a more favorable support level around $98.90.
Is the RSI at 56.09 a buy signal for DXY?
An RSI of 56.09 is in neutral territory and doesn't provide a strong buy or sell signal on its own. It indicates that DXY is neither overbought nor oversold on the daily timeframe, suggesting potential for further upward movement but also cautioning against chasing the price without confirmation.
How will upcoming Fed commentary affect DXY this week?
Hawkish commentary from Fed officials, suggesting a delay in rate cuts or a focus on persistent inflation, would likely boost the DXY towards $99.56 and beyond. Conversely, dovish remarks could lead to a pullback towards $98.90.
Track markets in real-time
AI-powered analysis, technical indicators and real-time price data.
Join Our Telegram Channel
Breaking market news, AI analysis and trading signals instantly.
Join Channel