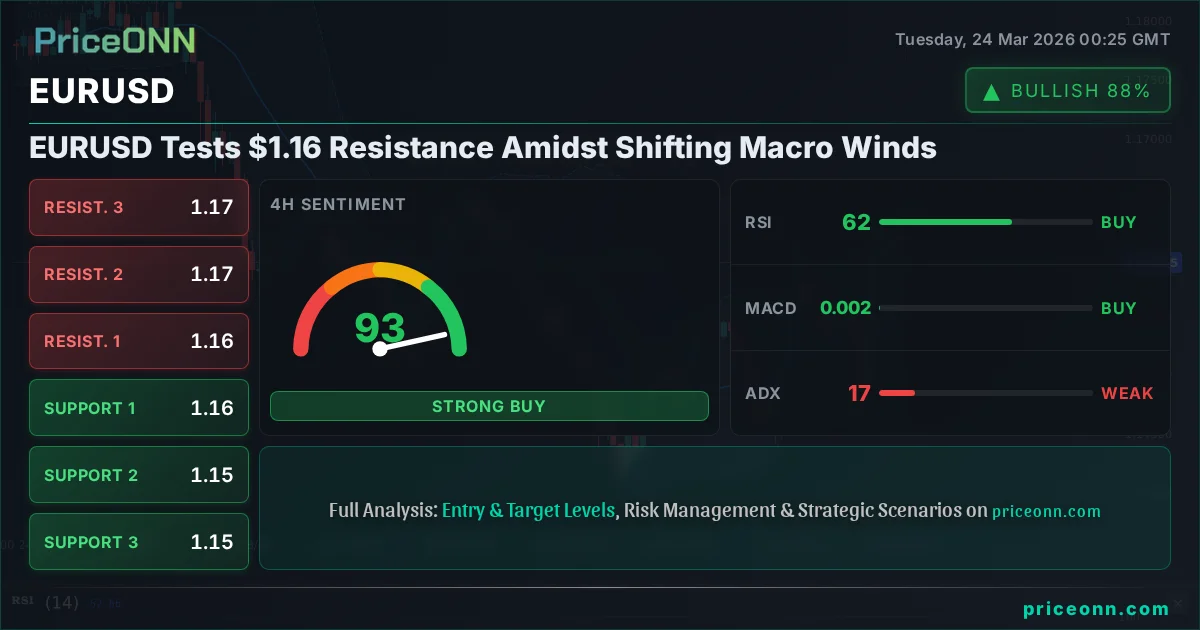
EURUSD Tests $1.16 Resistance Amidst Shifting Macro Winds
EURUSD hovers near $1.16 as traders weigh mixed signals from DXY, equities, and inflation outlook. Is this resistance level a turning point?
The relentless tug-of-war between the US Dollar and the Euro continues, with EURUSD currently testing critical resistance levels around the $1.16 mark. This isn't just another forex headline; it's a pivotal moment where a confluence of macroeconomic factors, central bank posturing, and shifting risk sentiment are converging. Understanding the interplay between these forces is key for any trader looking to navigate the choppy waters of the currency markets. As we've seen, the Dollar Index (DXY) has seen some pullback, currently trading around 99.04, which typically offers some breathing room for pairs like EURUSD. However, the persistent strength in US equities, with the S&P 500 at 6572.4 and Nasdaq at 24154.51, suggests that risk appetite hasn't entirely evaporated, creating a complex backdrop for currency movements. The question on many traders' minds is whether the current resistance near $1.16009 will hold, or if a decisive break higher is on the cards.
- EURUSD is currently challenging resistance around $1.16009, with the RSI(14) at 57.5 indicating some upward momentum but still in neutral territory.
- The Dollar Index (DXY) is trading near 99.04, showing a slight pullback that could offer temporary support to EURUSD, but its 1D trend remains strongly bullish.
- US equities show mixed signals: S&P 500 at 6572.4 and Nasdaq at 24154.51 are showing strength on 1H and 1D charts, but longer-term trends are bearish.
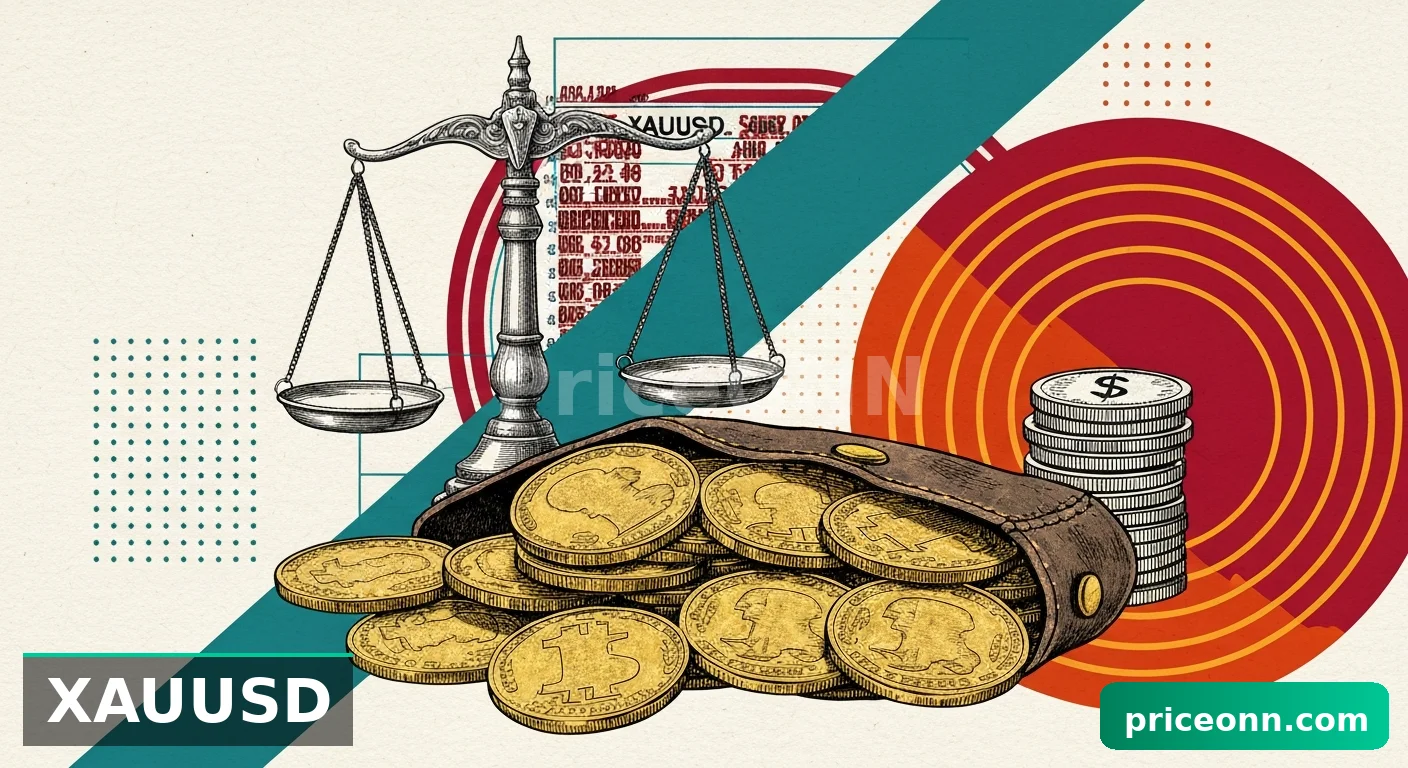
- Gold prices have seen a significant drop to $4408.92, suggesting a potential shift away from safe-haven demand, which could indirectly impact EURUSD.
- Key levels to watch for EURUSD are support at $1.15997 and resistance at $1.16273 on the 1H chart.
Navigating the Dollar's Tightrope Walk
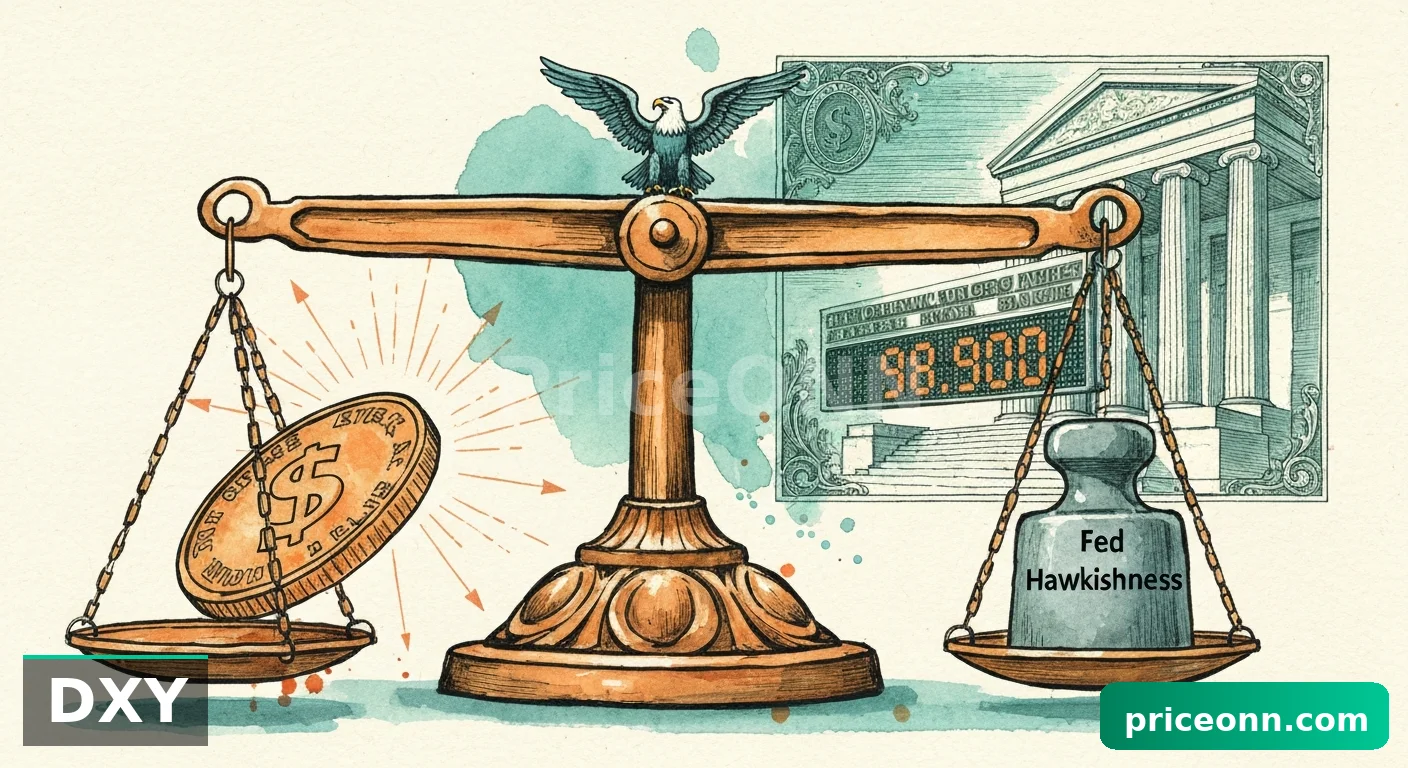
The US Dollar's trajectory remains the primary narrative influencing EURUSD. While the Dollar Index (DXY) has experienced a slight dip to 99.04, it's crucial to remember that this is a minor pause in a larger, persistent upward trend observed on the daily timeframe. The ADX on the daily chart stands strong at 33.66, indicating a robust uptrend. This means that any weakness in the dollar is likely to be temporary unless fundamental drivers shift dramatically. The current price action around 99.04 on the 1H chart shows a neutral trend with a power of 50%, suggesting indecision in the very short term. However, the underlying strength indicated by the daily trend cannot be ignored. This dichotomy is precisely what makes the EURUSD pair so interesting right now. A strong dollar often spells trouble for riskier assets and currency pairs like EURUSD, as capital tends to flow towards perceived safety and higher yields offered by the US economy. The fact that the DXY is showing signs of consolidation rather than a sharp reversal means that the pressure on EURUSD is likely to persist, even if intraday movements appear mixed.
We must also consider the market's reaction to recent economic data. While specific recent releases aren't detailed in the provided data, the general sentiment often hinges on inflation and employment figures. If the US economy continues to show resilience, perhaps with strong employment numbers or sticky inflation that necessitates higher-for-longer interest rates from the Federal Reserve, the dollar's strength could be reasserted. This scenario would naturally put downward pressure on EURUSD, potentially leading to a test of lower support levels like $1.15997 and even $1.15973 on the 1H chart. The market is constantly pricing in future Fed policy, and any hint of continued hawkishness, even if subtle, can bolster the dollar's appeal against a Eurozone economy that might be facing its own set of challenges, such as energy price volatility or slower growth.
Traders are closely watching the DXY around 99.00. A decisive break above 99.01 on the 1H chart could signal a renewed dollar rally, putting EURUSD under pressure. Conversely, a failure to hold above this level, especially with a close below 98.82, might indicate a short-term dollar correction.
Equity Markets: A Tale of Two Trends
The performance of major US equity indices offers a complex picture that indirectly influences EURUSD. The S&P 500 is currently trading at 6572.4, and the Nasdaq is at 24154.51. On the 1-hour chart, both indices show a neutral trend with 50% power, but the 4-hour and 1-day charts present a more bearish outlook, with ADX values suggesting strong downward trends (S&P 500 ADX at 44.98, Nasdaq ADX at 37.8). This divergence between intraday strength and longer-term bearish signals creates uncertainty. Typically, a strong risk-on sentiment, reflected in rising equities, would support a riskier currency like the Euro and weigh on the safe-haven dollar, thus pushing EURUSD higher. However, the current data suggests a more nuanced situation. The short-term bullish signals in equities might be providing some temporary buoyancy to EURUSD, helping it test resistance near $1.16. But the underlying bearish technicals on the daily charts could signal that this rally is fragile. If US equities were to experience a significant downturn, driven by inflation fears or tightening monetary policy, it would likely trigger a flight to safety, boosting the dollar and simultaneously pressuring EURUSD lower, potentially testing support levels around $1.15308 on the daily chart.
The relationship between equities and EURUSD isn't always straightforward. While a general risk-on environment favors higher EURUSD, specific sector performance or news can create cross-asset correlations that deviate from the norm. For instance, if technology stocks (heavily weighted in the Nasdaq) were to lead a sell-off, it might not necessarily translate into a uniform 'risk-off' move across all markets. Investors might rotate into other assets perceived as safer, or even into specific dollar-denominated assets, complicating the expected correlation. The current technical signals for the S&P 500 and Nasdaq on the 1H charts are giving a mixed 'AL' (Buy) signal (S&P 500: 5/3, Nasdaq: 5/3), but the longer-term daily outlook is decidedly bearish (S&P 500: 0/7, Nasdaq: 0/7). This suggests that while there might be short-term buying interest, the broader trend remains under pressure, a sentiment that could spill over into the forex market and cap potential upside for EURUSD.
The conflicting signals from US equities - short-term strength versus long-term bearish trends - create a volatile environment. A sharp reversal in stocks could quickly shift EURUSD lower, making the current test of resistance around $1.16 a potential trap for unwary bulls.
Commodities: Gold's Plunge and Inflationary Echoes
The drastic fall in gold prices, currently at $4408.92 with a significant daily drop of -1.97%, is a noteworthy development that warrants attention in the context of EURUSD. Gold, often considered a safe-haven asset, has seen its price plummet. On the 1H chart, the trend is neutral but leaning towards a bearish sentiment with RSI at 48.47. However, the 4H and 1D charts show stronger bearish signals, with ADX values around 25.34 and 22.73 respectively, indicating a significant downtrend is in play. This sharp decline in gold suggests that demand for safe-haven assets might be waning, or perhaps that market participants are positioning for a scenario where inflation is seen as less of a threat, or that higher interest rates are outweighing safe-haven appeal. If this trend continues, it could have ripple effects on EURUSD. A weaker gold price, implying reduced geopolitical fear or a stronger economic outlook that doesn't necessitate such safe havens, could indirectly support a move higher in EURUSD if it's seen as a riskier asset benefiting from that same risk-on sentiment. Conversely, if gold's fall is due to a broad tightening of financial conditions that also impacts the Eurozone, it could drag EURUSD lower.
The energy markets, particularly Brent crude at $100.22 and WTI at $90.57, also provide crucial context, especially concerning inflation expectations. Brent's daily chart shows a strong bullish trend (ADX 64.58), while WTI's daily trend is also bullish (ADX 58.58). However, both have seen significant intraday drops. The volatility in oil prices directly impacts inflation expectations globally. Higher oil prices tend to fuel inflation, prompting central banks like the Fed and ECB to consider tighter monetary policies, which would generally strengthen their respective currencies. The current sharp drops in oil prices might suggest some easing of inflationary pressures or concerns about global demand. If these lower oil prices persist, it could reduce the urgency for aggressive rate hikes, potentially easing pressure on EURUSD from the dollar's side. However, the daily bullish trend in oil still suggests underlying strength, and any geopolitical flare-up could send prices soaring again, reigniting inflation fears and impacting central bank policy expectations.
The dramatic fall in gold to $4408.92 is a strong signal that safe-haven demand is cooling. This could mean traders are becoming more comfortable with risk, potentially benefiting EURUSD if it can break through current resistance levels. However, always remember that gold can reverse quickly on geopolitical news.
EURUSD: The Technical Crossroads at $1.16
Technically, EURUSD is at a fascinating juncture. On the 1-hour timeframe, the pair shows a neutral trend with moderate strength (ADX 29.1), but the overall signal leans towards 'BUY' (6/2/0). The RSI(14) at 57.5 indicates a mild bullish inclination, while the MACD is showing positive momentum. However, the Stochastic oscillator presents a conflicting 'SELL' signal (%K < %D), suggesting potential short-term weakness. Resistance is identified at $1.16181, $1.16221, and $1.16273, with support seen at $1.16089, $1.16037, and $1.15997. A close above $1.16273 would be needed to suggest a sustained upward move.
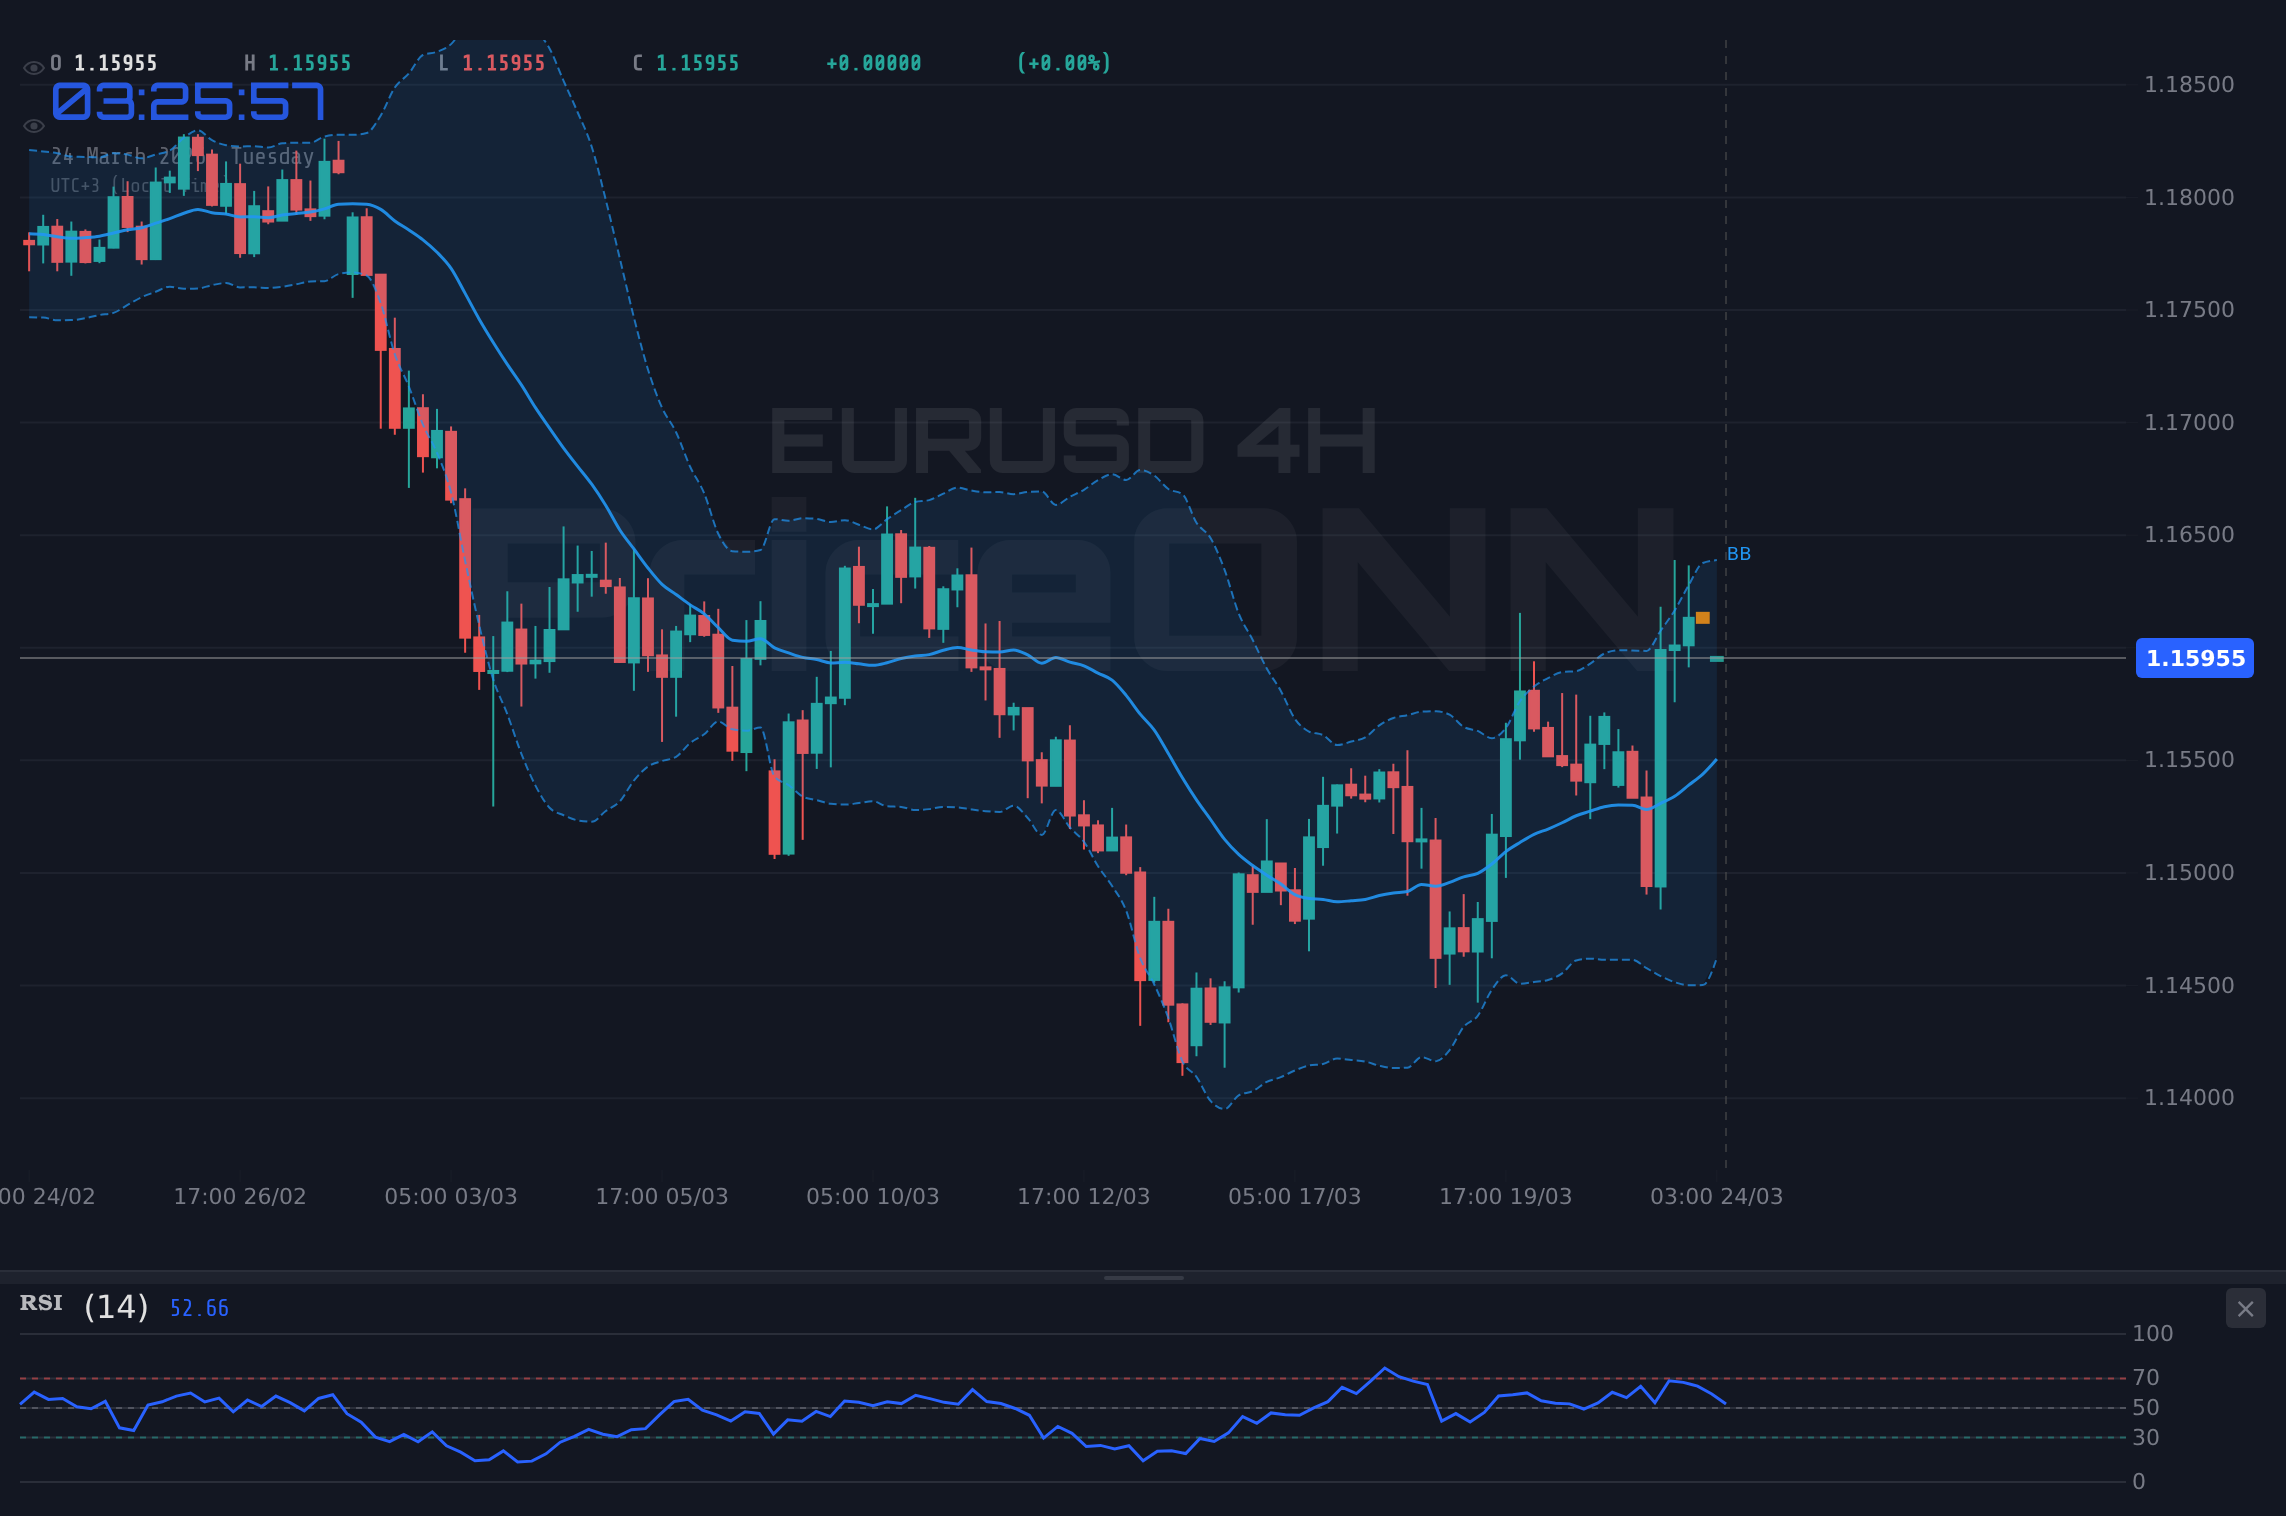
Delving into the 4-hour timeframe, the picture becomes more complex. The trend is still classified as neutral (50% power), but the overall signal is a strong 'BUY' (7/1/0). The RSI at 61.67 is entering the upper range of neutral, suggesting room for upside, and the MACD confirms positive momentum. The Stochastic is in bullish territory (%K > %D), reinforcing the buying sentiment. The key resistance here lies at $1.16347, $1.16685, and $1.16979. The ADX at 16.92 indicates a weak trend, suggesting that any move might lack strong conviction and could be prone to reversals. This lack of trend strength on the 4H chart means that while the momentum might be positive, the market isn't strongly committed to a direction yet.
The daily chart paints a different story, leaning towards a 'SELL' signal (3/5/0) with a strong downward trend indicated by ADX at 36.39. The RSI(14) at 48.11 is hovering just below the midpoint, indicating a slight bearish bias, and the MACD is positive but showing signs of weakening momentum. Support levels on the daily chart are situated at $1.15308, $1.14923, and $1.14607. The Bollinger Bands are below the middle band, indicating bearish pressure. The conflicting signals across different timeframes - bullish on 1H and 4H, but bearish on the daily - highlight the current indecision. A sustained move above the daily resistance at $1.16009 is crucial for a bullish continuation. If this level fails to break decisively, the prevailing daily downtrend could reassert itself, targeting the support levels below.
For EURUSD, the immediate focus is on the $1.16009 resistance level on the daily chart. A confirmed daily close above $1.16325 would signal a potential shift in the short-term trend, while a failure to break this resistance could lead to a retest of the $1.15308 support.
Intermarket Dynamics and Correlation Play
Understanding the interplay between EURUSD, the DXY, and equity markets is vital. Currently, the DXY is showing signs of weakness around 99.04, which typically correlates inversely with EURUSD. However, the daily trend for DXY remains strongly bullish (ADX 33.66), suggesting this pullback might be temporary. If the DXY resumes its upward trend, it would likely exert downward pressure on EURUSD, especially if US economic data continues to surprise to the upside, reinforcing the Fed's hawkish stance. The S&P 500 and Nasdaq, despite some short-term strength, show bearish signals on the daily timeframe. A significant drop in equities, signaling a 'risk-off' environment, would typically bolster the dollar and potentially push EURUSD lower. This correlation is not always perfect, but it provides a crucial backdrop. For instance, if gold continues its sharp decline to $4408.92, it suggests a reduction in safe-haven demand, which could paradoxically support EURUSD if it indicates growing risk appetite. However, the conflicting signals across timeframes for both equities and the DXY make this correlation analysis particularly challenging right now.
We also need to consider the broader economic environment. Inflationary pressures, while potentially easing as suggested by the oil price drops, remain a key concern for central banks. The European Central Bank (ECB) faces its own set of challenges, including managing energy price shocks and supporting economic growth. If the ECB adopts a more dovish stance compared to the Federal Reserve, it would naturally widen the interest rate differential, favoring the dollar and pressuring EURUSD. Conversely, any sign of the ECB becoming more hawkish, perhaps due to persistent inflation in the Eurozone, could provide support to the Euro. The current technical setup on EURUSD, with resistance being tested around $1.16009 while daily indicators suggest a bearish trend, highlights the sensitivity to these macroeconomic narratives. Traders must remain vigilant, as a shift in central bank rhetoric or a significant economic data surprise could quickly alter the outlook.
Keep an eye on upcoming US Non-Farm Payrolls (NFP) and CPI data. Stronger-than-expected figures could solidify the Fed's hawkish stance, strengthening the dollar and potentially pushing EURUSD below its current support levels.
Trade Scenarios for EURUSD
Bearish Scenario: Resistance Holds Firm
65% ProbabilityBullish Scenario: Breakout Confirmation
25% ProbabilityConsolidation Phase: Range-Bound Action
10% ProbabilityWhat the Indicators Are Saying
The technical indicators present a mixed but largely cautious outlook for EURUSD. On the 1-hour chart, the RSI(14) is at 57.5, indicating a mild bullish bias without being overbought. However, the Stochastic oscillator is flashing a sell signal (%K=45.32, %D=63.43), suggesting potential short-term pullback. MACD shows positive momentum, but the ADX at 35.84 points to a strong, albeit potentially choppy, upward trend. The 4-hour chart offers a more bullish perspective, with RSI at 52.05 and Stochastic showing a buy signal (%K=78.39, %D=41.25). The MACD is positive, and the ADX at 29.72 confirms a strong uptrend. Yet, the daily chart brings us back to caution. The RSI(14) is at 51.36, neutral, but the MACD is negative, and the ADX at 20.98 indicates only a moderate uptrend. This conflict across timeframes underscores the 'WATCH_ZONE' recommendation. A clear directional signal would emerge if these indicators aligned more consistently, particularly if the daily chart showed stronger bullish momentum or if the 1H and 4H signals held firm against any dollar strength.
The ADX values are particularly telling. While the 1H and 4H charts suggest strong trends (35.84 and 29.72 respectively), the daily ADX at 20.98 indicates that the longer-term trend lacks conviction. This means that even if EURUSD manages to break higher, the move might not be sustained without further confirmation. The current price action around $1.16 is crucial. A failure to break convincingly above $1.16273 on the 1H chart, especially if coupled with a bearish divergence on the daily RSI or MACD, could signal a reversal. Conversely, a daily close above $1.16325, supported by stronger momentum indicators across multiple timeframes, would be a significant bullish development. For now, the market appears to be in a holding pattern, awaiting clearer direction from macroeconomic data or a more decisive technical breakout.
The divergence between the 1H/4H bullish signals (RSI, Stochastic) and the daily chart's more cautious stance (neutral RSI, moderate ADX) highlights the current uncertainty. Traders should look for confirmation, such as a daily close above $1.16325, before committing to a strong directional trade.
The Road Ahead: What Needs to Happen for a Clearer Picture
For EURUSD to establish a clear direction, several factors need to align. Firstly, the US Dollar's path is paramount. A sustained rally in the DXY, driven by hawkish Fed expectations or a significant 'risk-off' event, would likely push EURUSD lower, challenging the $1.15308 daily support level. Conversely, if the Fed signals a pause or pivot, or if global risk sentiment improves markedly (perhaps reflected in rising equities and gold prices), the dollar could weaken, paving the way for EURUSD to test higher resistance levels, potentially aiming for $1.16685 on the 4H chart. Secondly, economic data from both sides of the Atlantic will be critical. Stronger US data would support dollar strength, while stronger Eurozone data could bolster the Euro. Upcoming inflation reports and employment figures will be key catalysts. Finally, technical confirmation is essential. A decisive break above the $1.16273 resistance, confirmed by daily closes and aligned momentum indicators, would be a bullish signal. Conversely, a break and hold below $1.15997 support could confirm the prevailing daily downtrend. Until then, expect continued choppiness and ranging behavior, making risk management paramount.
The current 'WATCH_ZONE' status for EURUSD reflects this ambiguity. While the 1H and 4H charts show some bullish momentum, the broader daily trend and the conflicting signals from correlated assets like the DXY and US equities suggest caution. Patience is a trader's best friend in such environments. Waiting for a clearer setup, perhaps a confirmed breakout above resistance or a decisive move towards support levels, will increase the probability of success. Remember, it’s not about catching every move; it’s about capitalizing on high-probability setups with well-defined risk parameters. The market always provides opportunities, but discipline dictates waiting for the right moment.
A daily close above $1.16325 would be a significant bullish signal, potentially opening the door for further gains towards $1.16685. However, failure to break this resistance and a subsequent move below $1.15997 could signal a continuation of the daily downtrend, targeting $1.15308.
Frequently Asked Questions: EURUSD Analysis
What happens if EURUSD fails to break above $1.16273 resistance?
If EURUSD fails to decisively break above the $1.16273 resistance on the 1H chart, the prevailing daily downtrend could reassert itself. This scenario would likely lead to a retest of support levels, potentially targeting $1.15997 and subsequently $1.15308, especially if the DXY strengthens.
Should I buy EURUSD at current levels around $1.16 given the mixed signals?
Buying EURUSD at current levels around $1.16 is a high-risk proposition due to the conflicting signals across timeframes and the strong daily downtrend indicated by ADX 36.39. A more prudent approach would be to wait for confirmation, such as a daily close above $1.16325, or a clear break below $1.15997 to join the trend.
Is the RSI at 57.5 a bullish signal for EURUSD right now?
An RSI of 57.5 on the 1H chart indicates mild bullish momentum but is not yet in overbought territory. While it supports the idea of some upward pressure, it needs to be viewed in conjunction with other indicators. The conflicting Stochastic signal and the daily chart's bearish bias suggest this RSI reading alone is not a strong buy signal.
How will potential Fed rate expectations affect EURUSD this week?
If upcoming economic data reinforces expectations of a hawkish Federal Reserve stance (e.g., higher-than-expected inflation or strong jobs numbers), the US Dollar could strengthen significantly. This would likely put downward pressure on EURUSD, potentially pushing it below the $1.15308 support level.
Track markets in real-time
AI-powered analysis, technical indicators and real-time price data.
Join Our Telegram Channel
Breaking market news, AI analysis and trading signals instantly.
Join Channel