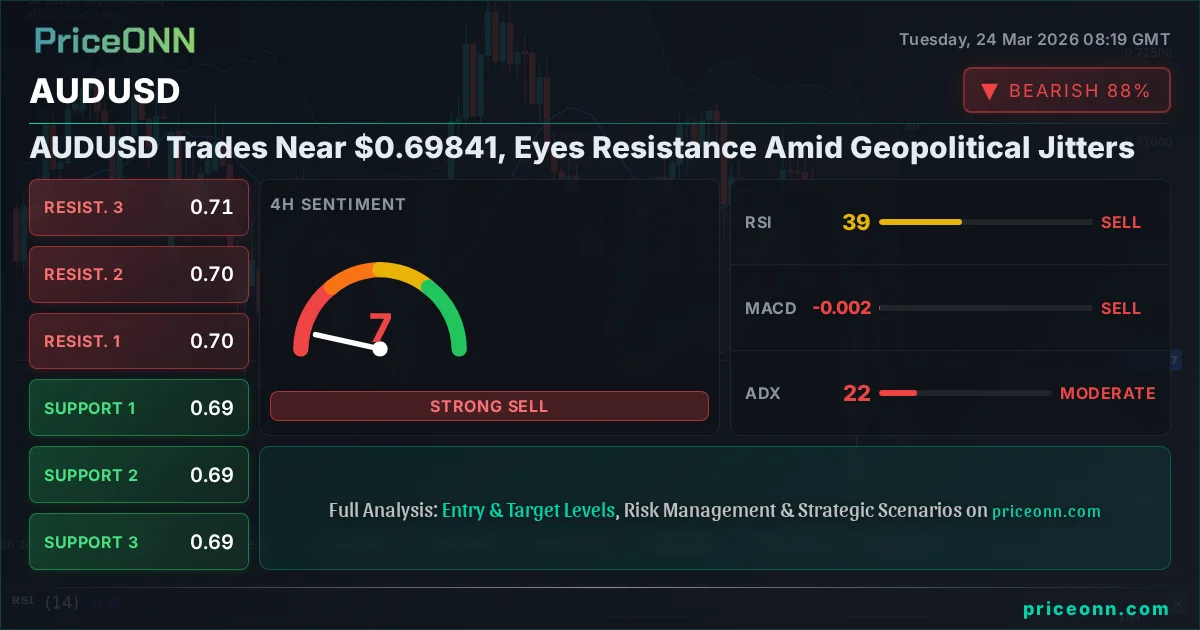
AUDUSD Trades Near $0.69841, Eyes Resistance Amid Geopolitical Jitters
AUDUSD hovers around $0.69841, facing resistance as geopolitical tensions escalate and traders eye DXY movements. A breakdown below support could trigger further decline.
Is AUDUSD poised for a significant move, or will it remain range-bound near $0.69841? The Australian Dollar is currently trading at this critical juncture, with traders and analysts closely watching key resistance levels and the broader market sentiment. With the DXY showing strength and geopolitical tensions simmering, the path ahead for AUDUSD is fraught with uncertainty, demanding a cautious approach and a keen eye on emerging price action. This analysis dives deep into the technical and fundamental drivers shaping AUDUSD’s trajectory, exploring potential scenarios and the critical levels to watch.
- AUDUSD is trading near $0.69841, with the 1D RSI at 45.6 indicating a bearish trend but within neutral territory.
- Critical support sits at $0.6948, tested multiple times this week, while resistance looms around $0.7006.
- The MACD histogram shows negative momentum, suggesting bearish pressure, but Stochastic %K > %D signals a potential short-term upward move.
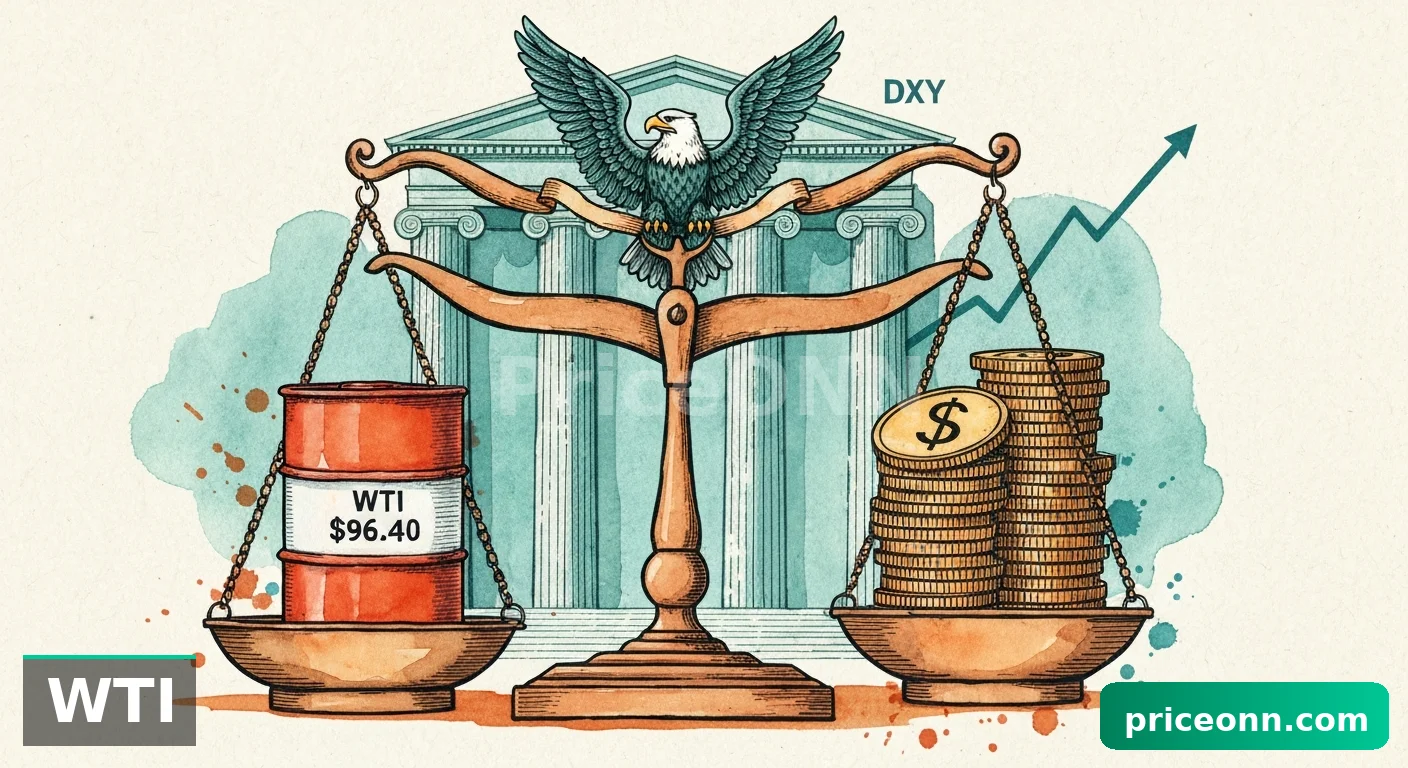
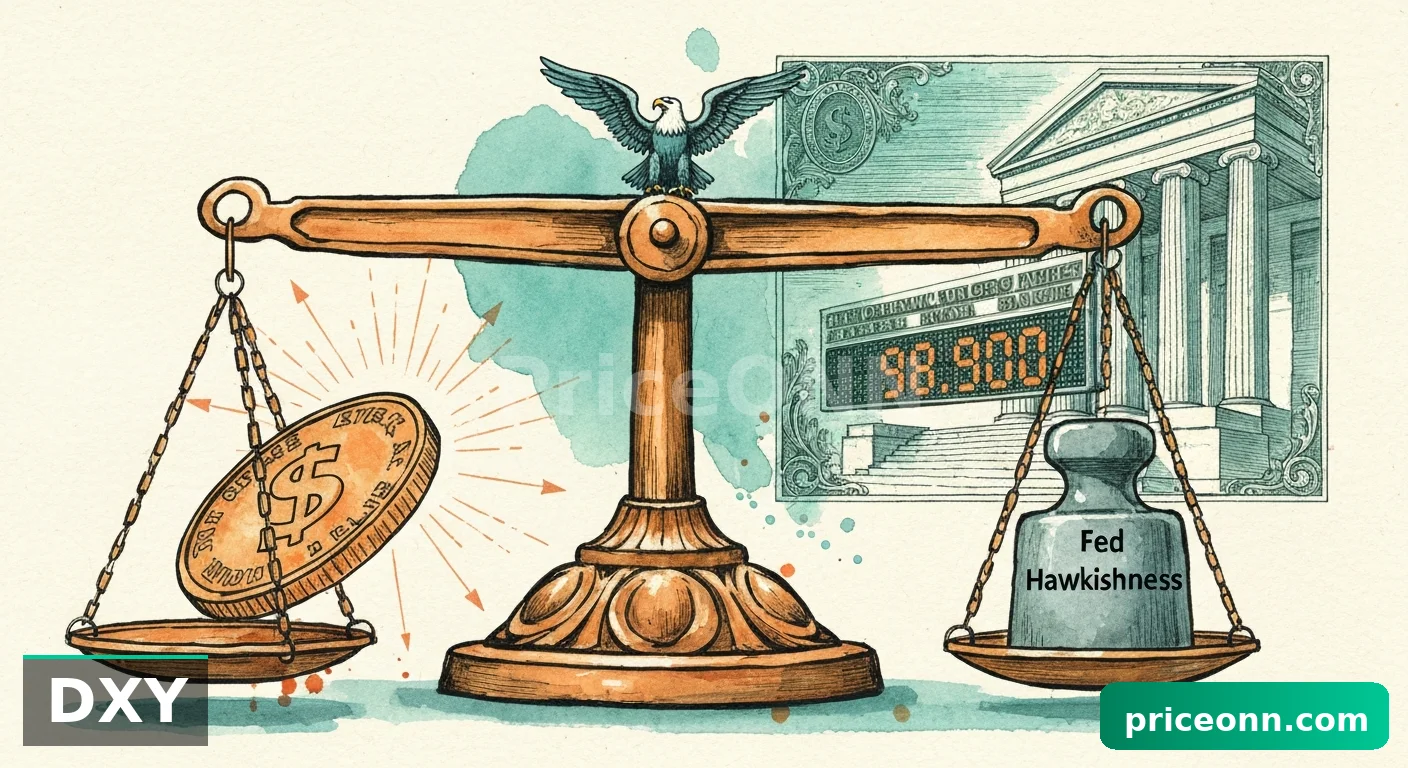
- DXY strength at 98.99 correlates with AUDUSD weakness, highlighting the dollar's influence on the pair.
Navigating the Cross-Currents: AUDUSD and the Dollar's Strength
The Australian Dollar (AUDUSD) finds itself at a pivotal point, hovering precariously near the $0.69841 mark. This price level is more than just a number; it represents a battleground where the forces of global risk sentiment, central bank policies, and geopolitical developments converge. On the daily chart, the AUDUSD shows a bearish trend with an ADX of 21.67, suggesting a moderate but established downward momentum. However, the RSI at 45.6 and MACD histogram's negative momentum paint a picture of selling pressure that, while present, isn't yet overwhelming. The Stochastic oscillator's signal of %K (27.82) being below %D (39.99) on the daily chart actually points towards a potential dip, but the short-term 1H chart shows %K (38.42) above %D (16.37), hinting at a possible, albeit temporary, upward push. This divergence in signals across timeframes underscores the current indecision in the market for AUDUSD.
The prevailing strength of the US Dollar, as indicated by the DXY trading at 98.99, continues to exert downward pressure on AUDUSD. Historically, a stronger dollar tends to make commodities and risk-sensitive currencies like the Australian Dollar less attractive to global investors. This inverse correlation is a key theme that traders must navigate. The DXY's own technical indicators show a mixed picture: while the 1D chart exhibits a strong bullish trend, the 1H and 4H charts suggest some consolidation or potential pullback. This internal conflict within the dollar's own technicals adds another layer of complexity to forecasting AUDUSD's immediate direction.
Geopolitical Storm Clouds and Their Impact on Risk Assets
Recent geopolitical developments, particularly concerning Tehran and the broader Middle East, are casting a long shadow over global markets. Reports of strikes and heightened tensions, even as diplomatic channels are being explored, inject an element of uncertainty that typically favors safe-haven assets and dampens appetite for riskier currencies like the Australian Dollar. The news that AUD/JPY has tumbled amid these tensions, with the Yen strengthening, highlights how interconnected global risk sentiment is. When the Yen strengthens due to geopolitical jitters, it often signals a broader 'risk-off' environment, which can directly impact AUDUSD negatively. Investors tend to move away from higher-yielding, but riskier, currencies and seek refuge in perceived safe havens.
The impact of these geopolitical events on oil prices is also a critical factor. While crude oil futures experienced a dramatic sell-off recently, with Brent dropping significantly, the underlying geopolitical risks remain a constant threat. Spikes in oil prices can fan inflation concerns, potentially influencing central bank policies. However, the recent plunge in oil prices, even as geopolitical tensions surfaced, suggests that market participants might be pricing in a de-escalation or that other factors are currently dominating the narrative. This complex interplay means that while geopolitical news provides a backdrop of uncertainty, its direct translation into market movements requires careful observation of how other asset classes, like oil and the Yen, are reacting.
The Bears' Grip: A Downside Scenario for AUDUSD
65% ProbabilityThe Waiting Game: Range-Bound Consolidation
25% ProbabilityThe Bull's Gambit: An Upside Surprise for AUDUSD
10% ProbabilityFundamental Underpinnings: What's Driving the Aussie?
Beyond the immediate geopolitical headlines, the fundamental picture for the Australian Dollar is shaped by domestic economic data and the Reserve Bank of Australia's (RBA) monetary policy stance. While specific RBA commentary or economic releases aren't provided in the live data feed, the general market context suggests that inflation and interest rate differentials remain paramount. If inflation in Australia were to show signs of persistent stickiness, it could embolden the RBA to maintain a hawkish stance, providing some underlying support for the AUD. Conversely, any indication of cooling inflation or a dovish shift in RBA rhetoric would likely weigh on the currency, especially if the US Federal Reserve maintains a more hawkish outlook.
The concept of 'aud usd fundamentals' is deeply tied to these macroeconomic factors. Traders often look at the yield differential between Australian and US government bonds, as well as interest rate expectations priced into futures markets. Currently, with the Fed's policy path somewhat uncertain, and any potential shift in BoJ policy also on the horizon, the carry trade dynamics involving the AUD could be affected. A widening interest rate differential in favor of Australia would typically attract capital, boosting the AUD. However, the current risk sentiment and the strong correlation with the DXY suggest that these fundamental drivers might be playing second fiddle to broader market fears and dollar strength for now. The RBA's next move, or any significant Australian economic data release, will be crucial in determining if the AUD can decouple from the dollar's influence.
Technical Breakdown: Indicators and Intermarket Analysis
Delving into the technical indicators for AUDUSD reveals a complex and somewhat contradictory picture across different timeframes. On the 1-hour chart, the trend is neutral with a moderate ADX of 18.14, indicating weak trending conditions. The RSI at 48.54 suggests a slight bearish lean, while the MACD histogram is negative. However, the Stochastic oscillator shows %K (38.42) above %D (16.37), signaling a potential short-term buy opportunity. This 1H setup hints at possible intraday bounces but lacks strong conviction.
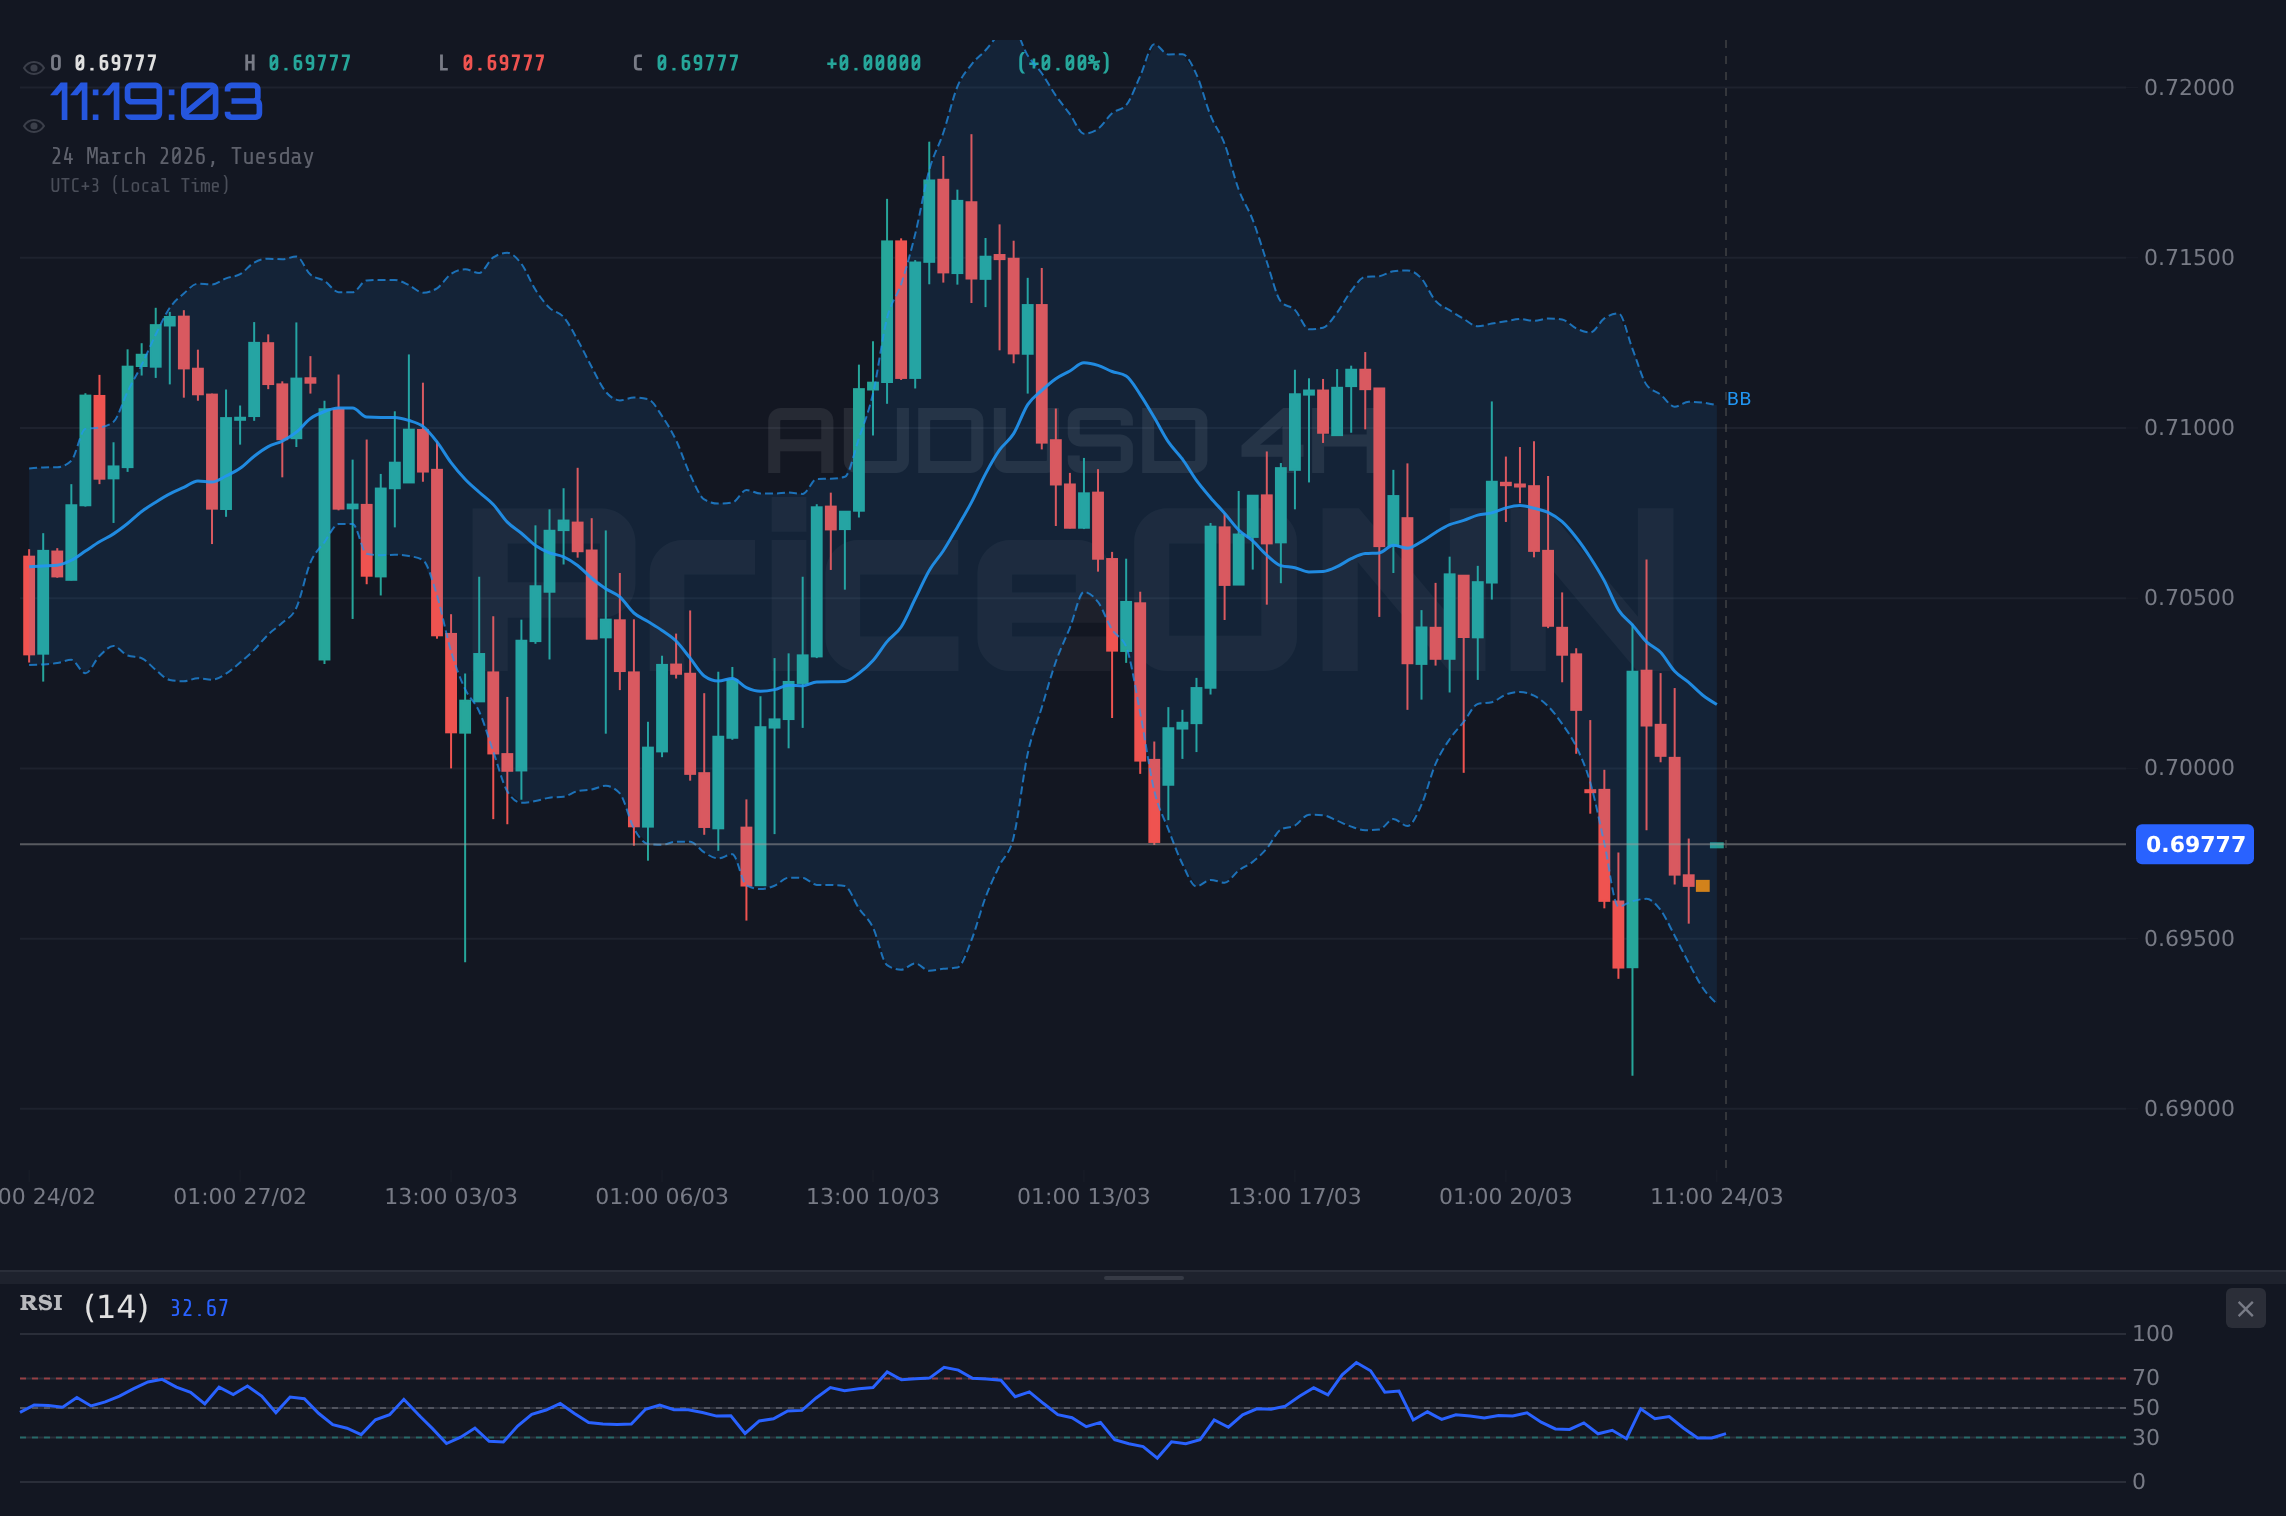
The 4-hour chart paints a more defined bearish picture. The trend is classified as strong (ADX 22.16), with RSI at 38.93 indicating bearish momentum and the MACD histogram firmly in negative territory. The Stochastic here also shows %K (43.03) above %D (35.9), still suggesting a move higher, but within the context of a stronger downtrend. This suggests that any upward moves might be short-lived counter-trend rallies. The daily timeframe reinforces the bearish sentiment, with an ADX of 21.67 and RSI at 45.6. The MACD continues to show negative momentum. The Bollinger Bands on the daily chart are trading below the middle band, indicating downward pressure, with the price hovering near the lower band. The Stochastic on the daily chart shows %K (27.82) below %D (39.99), confirming the bearish bias. This confluence of indicators on the daily chart suggests that the path of least resistance is downwards, despite potential for short-term fluctuations.
Intermarket Correlations: DXY, Oil, and the Yen's Role
The interplay between AUDUSD and other major markets is crucial for a comprehensive outlook. The DXY, currently at 98.99, is a primary driver. As noted, its upward trajectory generally pressures AUDUSD. A sustained push by the DXY above 99.00, coupled with a strong daily close, would likely confirm further downside for AUDUSD. Conversely, a retreat in the DXY below 98.80 could offer some respite, potentially allowing for a minor rebound in AUDUSD, especially if it breaks key intraday resistance levels like $0.7006.
The performance of oil prices, while recently volatile, remains an indirect indicator of global inflation expectations and geopolitical risk. While the immediate impact on AUDUSD might be muted, persistent high energy prices could eventually lead to renewed inflation concerns, influencing central bank policies globally. This, in turn, could affect interest rate differentials and capital flows, indirectly impacting AUDUSD. The Yen's strengthening amid geopolitical news is another vital clue. A 'risk-off' sentiment that benefits the Yen often spells trouble for commodity currencies like the AUD. If geopolitical tensions escalate further, leading to sustained Yen strength, AUDUSD could face significant headwinds, potentially pushing it towards its support levels.
What the Chart Patterns Tell Us About AUDUSD Trend Analysis
Observing the price action on the AUDUSD chart, particularly on the 4-hour and daily timeframes, reveals a pattern of lower highs and lower lows, characteristic of a downtrend. The current price action near $0.69841 is significant as it sits just below the 4-hour resistance at $0.7006. A failure to overcome this level could lead to a retest of the immediate support at $0.6948. This level has acted as a floor multiple times recently, and a decisive break below it would be a strong bearish signal, potentially opening the door for a move towards the next significant support at $0.6928.
Conversely, if AUDUSD manages to break through the $0.7006 resistance, it would signal a potential shift in short-term momentum. However, the more significant resistance lies higher, around $0.7043 on the 4-hour chart and $0.7064 on the daily chart. A breakout above these levels, especially if accompanied by a weakening DXY and positive shifts in broader market sentiment, could pave the way for a more sustained rally. For now, the price action suggests a market grappling with conflicting signals, making the adherence to defined support and resistance levels paramount for traders aiming to capture potential moves.
The Path Forward: Key Triggers for AUDUSD This Week
Looking ahead, several key triggers will likely dictate the direction of AUDUSD in the coming days. Firstly, the continued movement of the DXY is paramount. Any sustained weakness in the dollar index, particularly a break below its own short-term support levels, could provide a tailwind for AUDUSD. Secondly, geopolitical developments will remain a critical wildcard. Any significant escalation or de-escalation in the Middle East could trigger sharp moves in risk assets and safe-haven currencies, directly impacting AUDUSD. Traders should monitor news flow closely for any shifts in sentiment.
Domestically, attention will be on any upcoming Australian economic data or RBA commentary that could influence interest rate expectations. While no specific events are highlighted in the provided data, markets are always forward-looking. A surprise inflation print or a hawkish statement from the RBA could provide a much-needed boost to the Australian Dollar, potentially allowing it to challenge resistance levels. Conversely, weak data or dovish signals would likely reinforce the current bearish trend. Finally, broader market risk appetite, often reflected in the performance of US equities like the S&P 500 and Nasdaq, will serve as a barometer. A continued 'risk-on' environment could support AUDUSD, while a 'risk-off' sentiment would likely see it pressured.
Frequently Asked Questions: AUDUSD Analysis
What happens if AUDUSD breaks below the $0.6948 support level?
A break below the $0.6948 support on AUDUSD would likely signal further downside momentum, potentially targeting the $0.6921 daily support. This scenario is more probable if the DXY remains strong and geopolitical risks continue to weigh on market sentiment, with an estimated 65% probability.
Should I buy AUDUSD at current levels near $0.69841 given the mixed signals?
Buying AUDUSD at $0.69841 carries significant risk given the prevailing bearish trend and resistance at $0.7006. A bullish setup would require a clear break above $0.7043 with a weakening DXY, which currently has a low probability (around 10%). Risk management is crucial; consider waiting for confirmation or a break of key levels.
Is the RSI at 45.6 on the daily chart a sell signal for AUDUSD?
An RSI of 45.6 on the daily chart indicates bearish momentum but is not yet in oversold territory. While it suggests selling pressure, it doesn't provide a definitive sell signal on its own. Confirmation from price action breaking key support levels like $0.6948 would strengthen this signal.
How will the current DXY strength at 98.99 affect AUDUSD this week?
The DXY trading at 98.99 generally exerts downward pressure on AUDUSD due to their inverse correlation. If the DXY continues to hold firm or rises further, it increases the likelihood of AUDUSD testing its support levels. Conversely, a DXY pullback below 98.80 could offer temporary relief for AUDUSD.
Concluding Thoughts: Patience and Precision in a Volatile Market
The market for AUDUSD near $0.69841 is a classic case of conflicting signals and prevailing macro headwinds. While short-term technical indicators might offer fleeting opportunities for intraday traders, the daily chart paints a picture of caution, with bearish momentum and resistance levels capping upside potential. The DXY's strength and ongoing geopolitical uncertainties continue to favor a 'risk-off' environment, making any significant upside for AUDUSD challenging without a clear shift in these broader themes.
For the discerning trader, the key lies in patience and precision. Waiting for clear confirmation of a trend continuation or reversal, rather than chasing short-term fluctuations, is paramount. Adhering to the defined support and resistance levels discussed - particularly the $0.6948 support and $0.7006 resistance - will be crucial in navigating the current choppy waters. As volatility creates opportunity, those who can precisely identify and act upon confirmed setups, while diligently managing risk, will be best positioned to navigate these challenging market conditions.
Technical Outlook Summary
| Indicator | Value | Signal | Interpretation |
|---|---|---|---|
| RSI (14) | 45.6 | Bearish | Momentum suggests downward pressure, but not oversold. |
| MACD Histogram | -0.00053 | Bearish | Negative momentum indicates selling pressure. |
| Stochastic | K: 27.82, D: 39.99 | Bearish | %K below %D in oversold territory, suggesting downtrend continuation. |
| ADX | 21.67 | Neutral | Moderate trend strength, indicating a developing or consolidating trend. |
| Bollinger | Middle Band Break | Bearish | Price below middle band suggests downward bias. |
Key Levels
Support Levels
Resistance Levels
Track markets in real-time
AI-powered analysis, technical indicators and real-time price data.
Join Our Telegram Channel
Breaking market news, AI analysis and trading signals instantly.
Join Channel