The Nasdaq 100 is currently navigating a critical juncture, trading near the $24,015 mark. This level, a focal point for traders and investors, encapsulates the broader market's indecision as conflicting signals emerge from technical indicators, global risk sentiment, and macroeconomic drivers. With the Dollar Index (DXY) showing renewed strength and a palpable risk-off sentiment permeating global markets, the tech-heavy Nasdaq faces headwinds that challenge its recent upward momentum. Understanding the interplay between these factors is crucial for deciphering the index's next potential move.
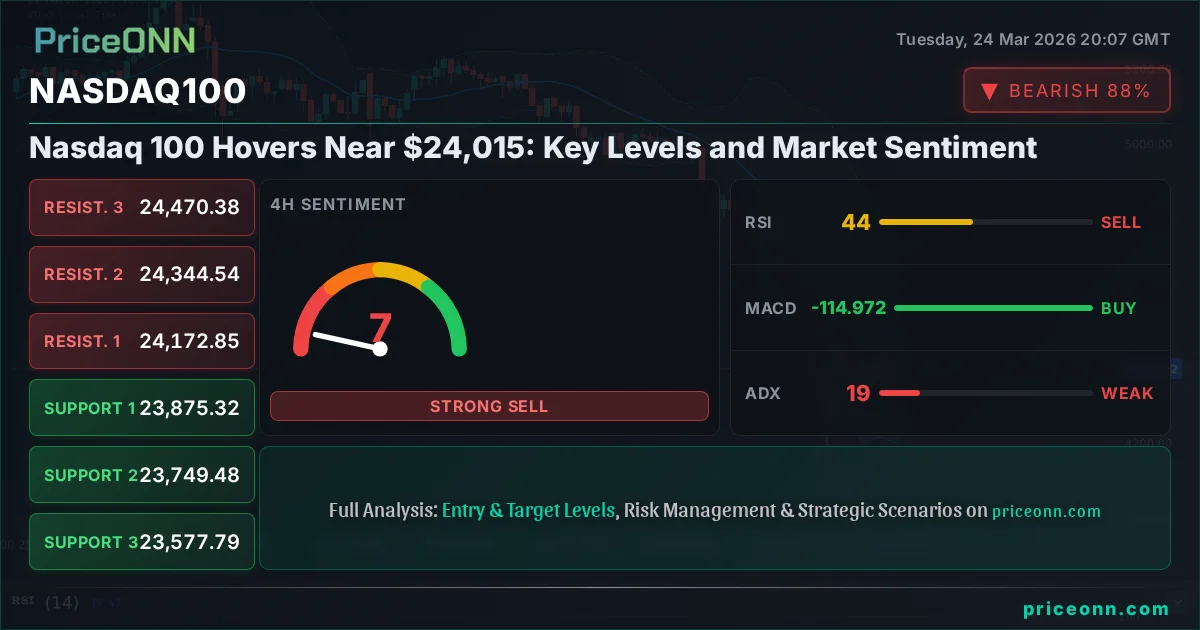
- Nasdaq 100 is trading near $24,015, with key support identified at $23,647.
- RSI at 44.78 on the 1H chart signals bearish momentum, while the 1D ADX at 45.34 indicates a strong downtrend.
- DXY strength above 99.20 and a risk-off mood in SP500/Nasdaq are pressuring the index.
- Conflicting signals exist: 1H Stochastic is rising, but 1D Stochastic shows a bearish signal.
Navigating the Choppy Waters: Nasdaq 100 at a Crossroads
The Nasdaq 100's current position near $24,015 is more than just a price point; it's a battleground where bulls and bears are testing each other's resolve. The index has experienced a notable dip, with the 1-hour chart showing a bearish trend with 77% strength, and the 4-hour chart indicating a strong 81% downtrend. This suggests that the recent downward pressure is significant. However, the daily chart presents a more neutral picture with 50% trend strength, indicating a potential for consolidation or a shift in momentum. The market sentiment, largely dictated by broader macroeconomic concerns and geopolitical tensions, is creating a volatile environment. Investors are keenly watching the DXY, which has climbed to 99.2, and the performance of the SP500 and Nasdaq, both showing downtrends on the daily charts, signaling a clear preference for safer assets over riskier tech stocks. This risk-averse environment makes it challenging for the Nasdaq 100 to find sustainable upward momentum.
The Bull's Roadmap: A Path Above Resistance
For the bulls to regain control, a decisive move above the immediate resistance levels is paramount. The 1-hour resistance is currently pegged at $24,132.99, followed by $24,202.16. A sustained break above these levels, ideally accompanied by increasing trading volume and a shift in momentum indicators, could signal a potential reversal. On the 4-hour timeframe, resistance lies at $24,172.85 and $24,344.54. A successful push through these barriers would need to be validated by a strengthening RSI, which currently hovers at 43.72 on the 4H chart, indicating room for improvement, and a positive shift in the MACD. Historically, such breakouts require confirmation from broader market sentiment. If the DXY were to falter and risk appetite surged, we might see a more aggressive rally. However, given the current prevailing market conditions and the strong downtrend signals on the daily charts (ADX at 45.34), this bullish scenario appears less probable in the short term, likely requiring a significant catalyst to materialize.
Where Bears Take Control: The Support Breakdown Scenario
The bearish outlook hinges on the Nasdaq 100 failing to hold its ground at current support levels and succumbing to selling pressure. The immediate 1-hour support is at $23,996.99, with more significant levels at $23,930.16 and $23,860.99. On the 4-hour chart, the critical support to watch is $23,875.32, followed by $23,749.48. A decisive close below these levels, particularly on the daily chart where support lies at $23,647.55, would confirm a bearish continuation. The daily ADX at 45.34 strongly suggests a robust downtrend, reinforcing the potential for further downside. If this breakdown occurs, the next target could be $23,577.79 on the 4-hour chart. The RSI, currently at 35.64 on the daily timeframe, is in oversold territory, which might suggest a pause or a bounce, but a strong bearish trend can often push RSI deeper into oversold territory before a true reversal. This scenario is amplified by the rising DXY and the general risk-off sentiment, which typically weigh heavily on growth-oriented assets like tech stocks.
The Waiting Game: Consolidation and Range-Bound Dynamics
Between the immediate support and resistance lies a zone where the Nasdaq 100 could become range-bound, characterized by choppy price action and a lack of clear direction. This neutral scenario often occurs when market participants are awaiting definitive catalysts, such as key economic data releases or central bank policy shifts. On the 1-hour chart, the price could oscillate between $23,860.99 and $24,268.99. The 4-hour timeframe suggests a slightly wider range, potentially between $23,749.48 and $24,344.54. During such periods, technical indicators often provide mixed signals, reflecting the indecision. For instance, while the 1-hour Stochastic is signaling an upward move, the 1D Stochastic indicates a bearish signal. The ADX readings across different timeframes also show a conflict: strong on the daily (45.34), weak on the hourly (12.02), suggesting a lack of sustained trend. This 'waiting game' could persist until clearer macroeconomic signals emerge, such as upcoming inflation reports or Fed commentary, which might break the stalemate and define the next directional move.
Most Likely Scenario: Bearish Continuation Amidst Macro Pressures
Considering the confluence of technical signals and the prevailing market environment, the most probable scenario for the Nasdaq 100 in the near term appears to be a bearish continuation, albeit with potential for short-term fluctuations. The strong daily downtrend indicated by the ADX at 45.34, coupled with a daily RSI at 35.64 and MACD showing negative momentum, paints a picture of underlying weakness. The rising DXY to 99.2 and the risk-off sentiment, evidenced by the declines in SP500 (currently at 6559) and Nasdaq itself, further bolster this view. While the oversold conditions on the daily RSI might offer some temporary respite, the overall trend bias remains downwards. The probability of a bearish continuation scenario is estimated at approximately 65%. The bullish scenario, requiring a decisive break above key resistances like $24,202.16 and sustained positive momentum, seems less likely without a significant shift in global sentiment or a dovish surprise from the Fed. The neutral consolidation scenario remains a possibility, but the dominant trend signals lean towards further downside. Therefore, traders should be more attuned to downside risks and potential breakdowns below support levels.
What I'm Watching This Week: Key Triggers for Nasdaq 100
The coming week presents several crucial junctures for the Nasdaq 100. Firstly, I'll be monitoring the $23,647 support level very closely. A confirmed break below this on the daily chart would significantly increase the probability of the bearish scenario playing out, potentially targeting $23,577.79. Secondly, the DXY's trajectory is key. If it continues its ascent above 99.3, it will likely exert further downward pressure on the Nasdaq. Conversely, any signs of weakness in the dollar, perhaps due to shifting Fed expectations, could provide a tailwind. Finally, I am watching the price action around the $24,015 current level. A failure to hold this psychological mark could accelerate selling, while a strong bounce might indicate a short-term consolidation before the next directional move. Traders should remain vigilant for confirmation signals, especially on the daily close, to align with the prevailing trend.
Bearish Scenario: Downside Pressure Mounts
65% ProbabilityNeutral Scenario: Range-Bound Consolidation
25% ProbabilityBullish Scenario: Reclaiming Higher Ground
10% ProbabilityGlobal Market Interplay: DXY, Oil, and Risk Appetite
The Nasdaq 100 does not operate in a vacuum. Its movements are intricately linked to broader market dynamics, particularly the strength of the US Dollar (DXY) and the general risk appetite, which is currently leaning towards 'risk-off'. The DXY is trading at 99.2, showing a clear upward trend on the daily chart (91% strength), which typically exerts downward pressure on global equities, including the tech-heavy Nasdaq. This inverse correlation is a well-established market phenomenon; a stronger dollar makes US exports more expensive and can signal a flight to safety, drawing capital away from growth assets. Meanwhile, oil prices, currently seeing a surge with WTI at $92.29 and Brent at $103.68, are a double-edged sword. While higher oil prices can fuel inflation fears, potentially leading to tighter monetary policy and impacting growth stocks, they also reflect geopolitical tensions. The recent news about WTI prices plunging 15% after topping $100, followed by a rebound, highlights the volatility and uncertainty in the energy markets, which can spill over into broader market sentiment. Geopolitical instability in the Middle East, mentioned in market updates, directly impacts oil prices and contributes to the prevailing risk-off mood. This sentiment is further reflected in the performance of major indices like the SP500 (6559) and Nasdaq itself, which are both exhibiting downtrends on their daily charts, indicating a general reluctance among investors to take on significant risk.
Technical Deep Dive: Indicators in Conflict
Examining the technical indicators provides a nuanced, though often conflicting, view of the Nasdaq 100's immediate prospects. On the 1-hour chart, the trend is bearish with strong momentum, but the Stochastic indicator is showing a potential rise. The RSI at 44.78 suggests bearish momentum, while the MACD is positive but below the signal line, indicating caution. The ADX at 12.02 points to a weak trend, suggesting that any current move might lack conviction. Shifting to the 4-hour timeframe, the trend is a strong 81% downtrend. The RSI at 43.72 reinforces the bearish sentiment, and the MACD is positive, but the Stochastic is showing a bearish signal (%K %D), directly contradicting the bearish signals from RSI and MACD on the same timeframe. This internal conflict within the indicators suggests that the market is at a critical inflection point, where a clear directional catalyst is needed to resolve the ambiguity.
Macroeconomic Undercurrents: Fed Policy and Inflation Expectations
The Federal Reserve's monetary policy and inflation expectations remain central to the Nasdaq 100's outlook. While the provided data doesn't include specific Fed commentary or interest rate futures, the general market narrative often revolves around the Fed's stance on inflation and potential rate cuts. If inflation proves to be more persistent than anticipated, the Fed might delay or reduce the number of planned rate cuts. This would typically support a stronger dollar (as seen with the DXY at 99.2) and put pressure on growth stocks like those in the Nasdaq 100, as borrowing costs remain higher for longer, impacting company valuations and investment. Conversely, any indication that the Fed is leaning towards a more dovish stance, perhaps due to signs of cooling inflation or a significant economic slowdown, could boost risk appetite and provide support for the Nasdaq. Traders are constantly parsing economic data releases – such as employment figures and inflation reports – for clues about the Fed's next move. The current risk-off sentiment suggests that markets are pricing in a scenario where inflation might remain sticky, or that geopolitical risks warrant a cautious approach from policymakers, thereby capping upside potential for the Nasdaq.
Geopolitical Ripples: From the Middle East to Asia
Geopolitical developments continue to cast a long shadow over global markets, influencing risk sentiment and driving flows into perceived safe-haven assets. The ongoing tensions in the Middle East, a significant factor impacting oil prices and contributing to the DXY's strength, create an environment of uncertainty. News reports mentioning Brent crude's volatility and the US Dollar's resilience amidst these tensions underscore the interconnectedness of global events. Furthermore, the significant outflow of foreign funds from Asian stock markets, totaling $50.45 billion in March according to market reports, signals a broader risk aversion that extends beyond just the US. This global flight from riskier assets means that even if domestic US economic data were to improve, the prevailing geopolitical climate could still suppress enthusiasm for growth-oriented investments like the Nasdaq 100. The market is essentially pricing in a higher probability of 'tail risk' events, making investors more cautious and demanding a higher risk premium, which is detrimental to equity valuations, particularly for forward-looking tech companies.
The 1D Chart: A Battle for Trend Confirmation
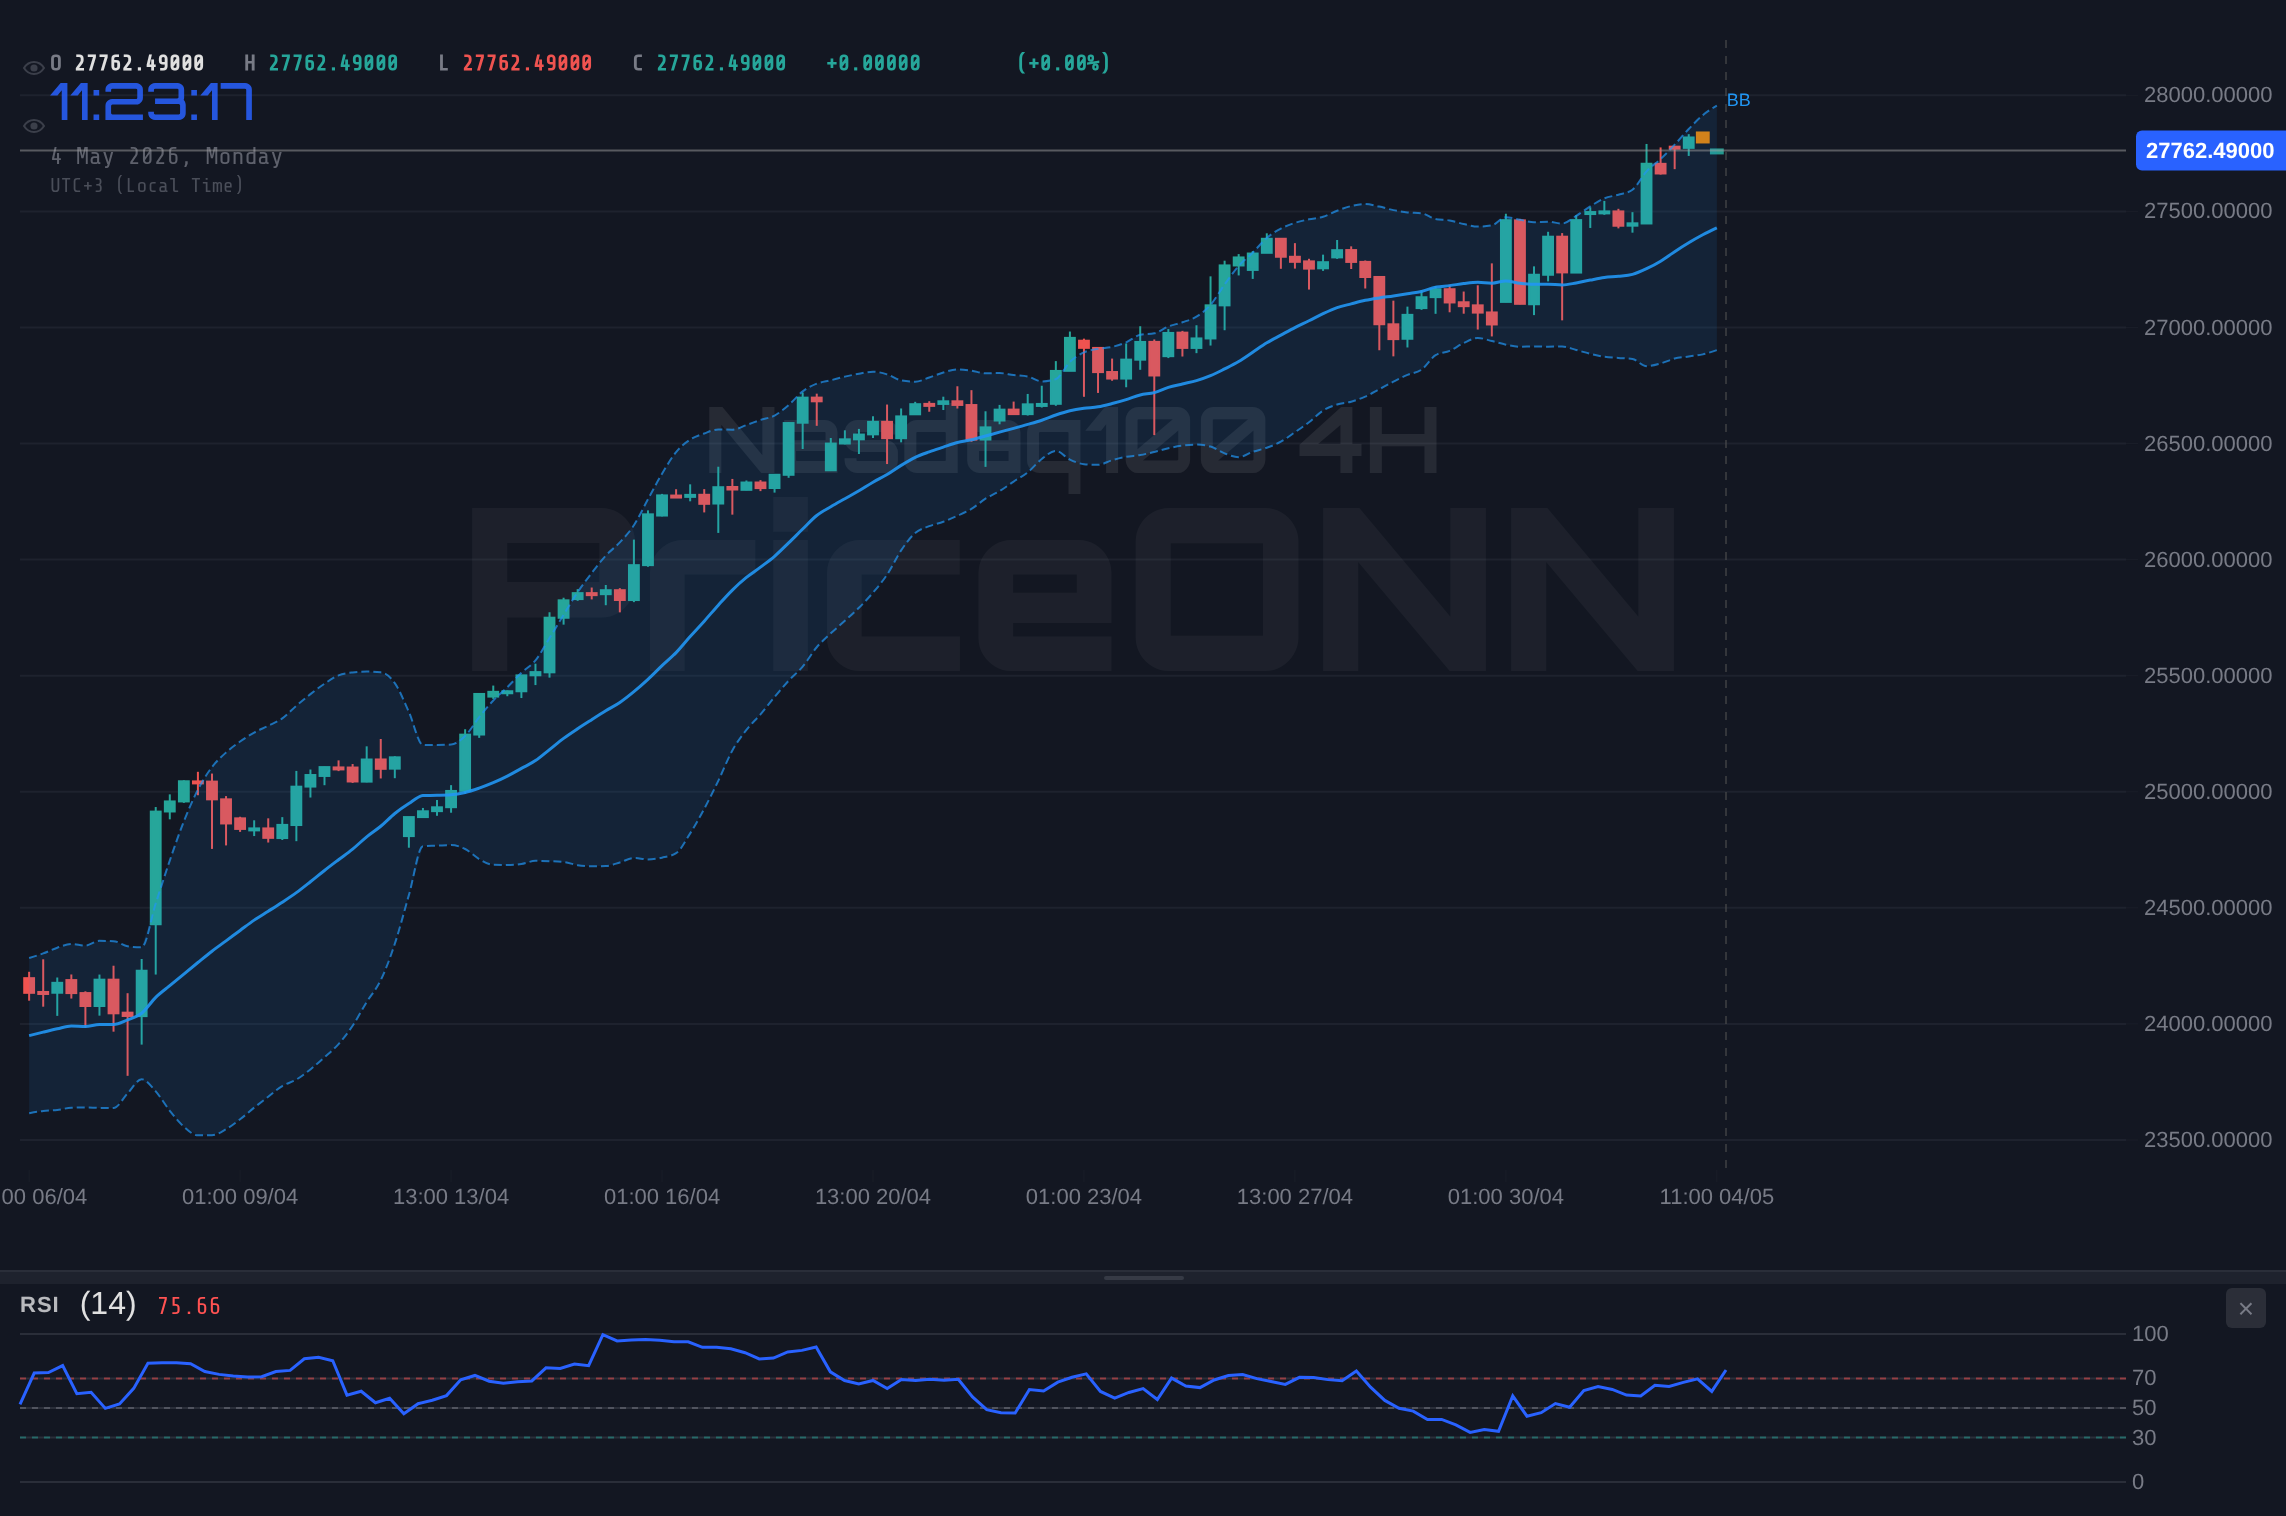
The daily chart for the Nasdaq 100 is where the true battle for trend confirmation is playing out. While the ADX at 45.34 indicates a strong downtrend, the RSI at 35.64 sits in oversold territory, and the Stochastic oscillator is showing a bullish signal. This divergence is crucial. A strong downtrend, as indicated by the ADX, suggests momentum is firmly in the hands of sellers. However, oversold RSI readings historically can precede sharp bounces or reversals, especially if coupled with positive divergences or shifts in MACD. The MACD itself is currently negative and below its signal line, reinforcing the bearish bias. The Bollinger Bands are below the middle band, indicating downside pressure. The fact that the trend strength is only 50% neutral despite the strong ADX suggests that the trend might not be as committed as the ADX reading implies, or that the market is consolidating after a significant move. The key takeaway from the daily chart is the conflict: strong bearish trend indicators are battling oversold conditions and conflicting oscillator signals. A decisive close above the daily resistance levels, or conversely, a breakdown below the daily support, will be critical in determining the next sustained direction.
Frequently Asked Questions: Nasdaq 100 Analysis
What happens if Nasdaq 100 breaks below the $23,647 support level?
A daily close below $23,647.55 would invalidate the current neutral outlook and likely trigger a bearish continuation. This could send the Nasdaq 100 towards the next significant support at $23,577.79, as indicated by the 4-hour chart levels.
Should I consider buying Nasdaq 100 at current levels near $24,015 given the oversold RSI on the daily chart?
Buying solely based on an oversold RSI at $24,015 carries significant risk due to the strong daily downtrend (ADX 45.34). A more prudent approach would be to wait for confirmation, such as a bullish divergence on the MACD or a clear break above resistance, and manage risk tightly.
Is the Stochastic oscillator's bullish signal at 19.12 a reliable indicator for Nasdaq 100 right now?
While the daily Stochastic at 19.12 is in oversold territory and showing a bullish signal, it contradicts the stronger bearish signals from the daily RSI (35.64) and MACD. This conflict suggests caution; confirmation from other indicators or price action is needed before relying solely on this signal.
How will the rising DXY above 99.2 affect Nasdaq 100's outlook this week?
The sustained strength in the DXY, currently above 99.2, generally exerts downward pressure on growth assets like the Nasdaq 100. This reinforces the bearish scenario, suggesting that the index may struggle to find upside momentum until the dollar shows signs of reversal or a shift in risk appetite occurs.
The Path Forward: Patience and Risk Management
The Nasdaq 100 is currently caught in a tug-of-war, with technical indicators flashing mixed signals and macro pressures creating a challenging environment. The prevailing risk-off sentiment, coupled with a strengthening DXY and geopolitical uncertainties, points towards potential downside risks. However, the oversold conditions on the daily chart and the conflicting signals across different timeframes suggest that sharp fluctuations are possible. For traders and investors, the immediate future calls for patience and disciplined risk management. Focusing on the key support level at $23,647.55 and resistance at $24,202.16 will be paramount. Waiting for clear confirmation signals, rather than chasing every short-term move, will be crucial in navigating these choppy waters. The market is offering lessons in volatility; those who heed them will be better positioned to capitalize when clarity eventually emerges.
Track markets in real-time
AI-powered analysis, technical indicators and real-time price data.
Join Our Telegram Channel
Breaking market news, AI analysis and trading signals instantly.
Join Channel