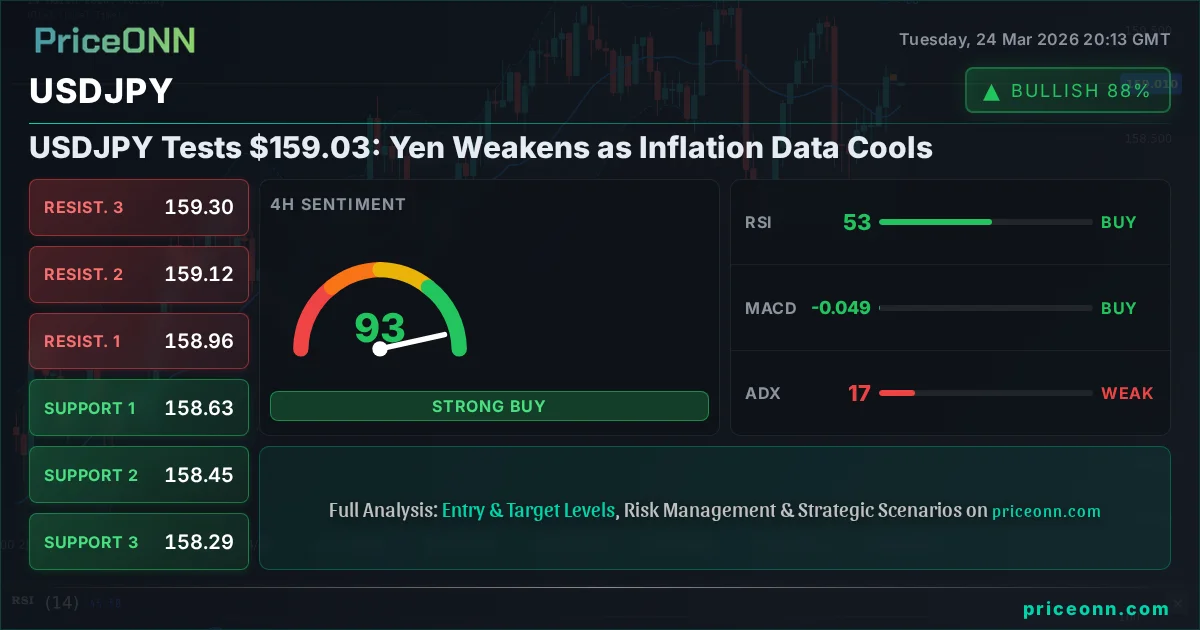
USDJPY Tests $159.03: Yen Weakens as Inflation Data Cools
USDJPY hovers near $159.03 following a softer inflation report. With the Dollar Index strengthening, traders eye key levels amidst mixed technical signals.
The relentless climb of USDJPY has brought the pair to a critical juncture, hovering precariously around the $159.03 mark. This significant psychological level, now in sharp focus, comes after a cooling inflation report from Japan, which has allowed the Yen to briefly catch its breath, only to be immediately pressured by a resurgent US Dollar. The interplay between Japanese monetary policy signals and the Dollar's broader strength, amplified by geopolitical undercurrents, creates a complex tapestry for traders attempting to navigate this currency pair. Understanding the nuances of the current market sentiment, the technical underpinnings, and the potential impact of upcoming economic data is paramount for anyone positioned in USDJPY.
- RSI at 57.47 on the daily chart signals neutral pressure, but a bullish uptrend is still in play.
- Critical resistance sits at $159.339, tested multiple times this week.
- MACD histogram is negative, suggesting bearish momentum is fading but still present.
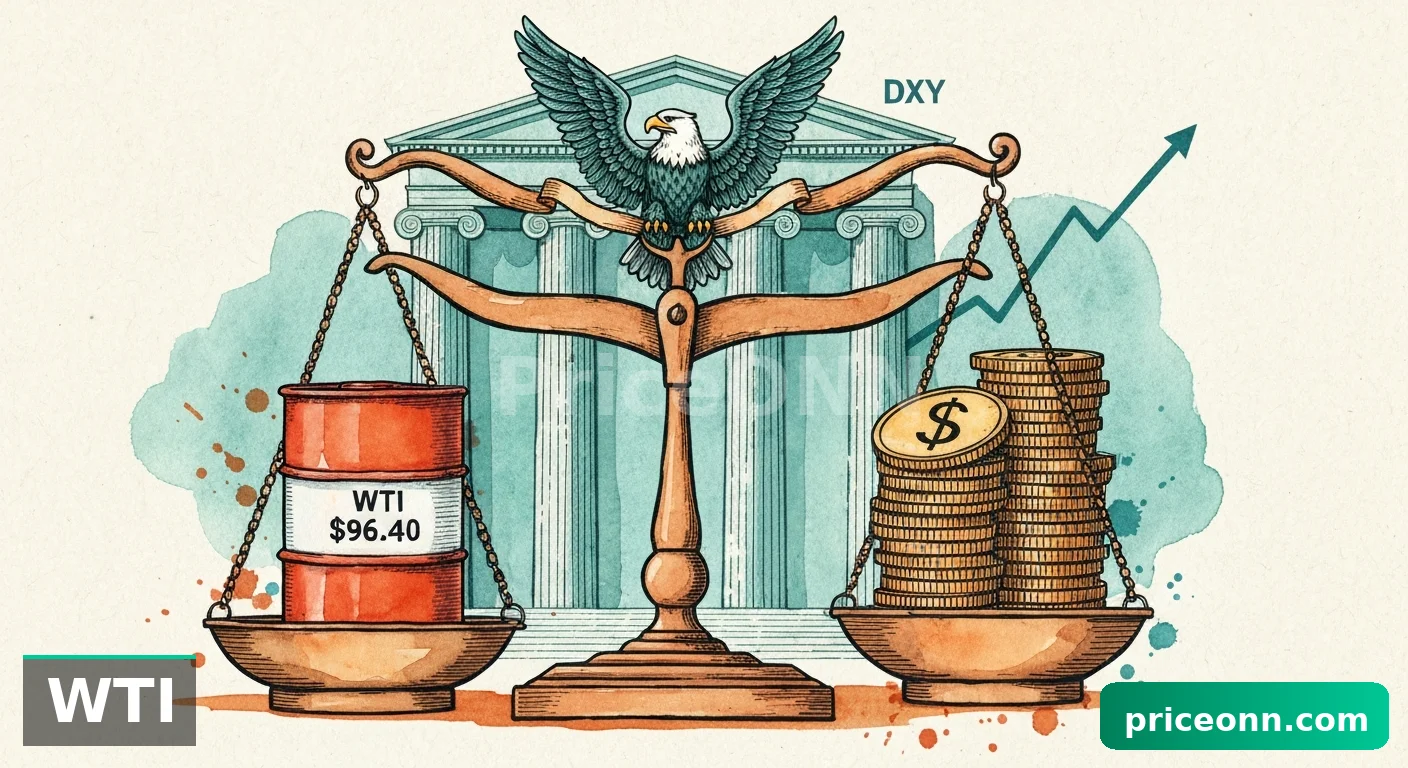
- Fed rate expectations driving USDJPY correlation with DXY at 99.21.
The recent Japanese inflation figures, while showing some moderation, have not fundamentally altered the Bank of Japan's ultra-loose monetary policy stance. This divergence continues to fuel the carry trade, where investors borrow in low-yielding currencies like the Yen to invest in higher-yielding assets, primarily the US Dollar. The USDJPY pair has been on a multi-month ascent, largely driven by the widening interest rate differential between the Bank of Japan and the Federal Reserve. While the Fed has signaled a pause in its rate-hiking cycle, market expectations still price in higher US rates compared to Japan, providing a persistent tailwind for USDJPY. The current technical setup, however, suggests that the upward momentum may be facing headwinds, demanding closer scrutiny of the price action around the $159.03 level.
USDJPY Today Analysis: The 159 Barrier
The $159.03 level for USDJPY is not just a number; it represents a significant psychological and technical barrier that has held sway over market sentiment. Historically, such round numbers often act as magnets for price action, attracting both speculative interest and cautionary hedging. On the 1-hour chart, we see a trend that is broadly neutral, with a power rating of 50%. This suggests a period of consolidation or indecision. The ADX at 18.85 reinforces this, indicating a weak trend environment on this short-term timeframe. However, the overall signal across multiple timeframes paints a more complex picture. While the 1-hour chart might suggest neutrality, the 4-hour and daily charts offer a different perspective, hinting at underlying strength or potential reversals that demand careful interpretation.
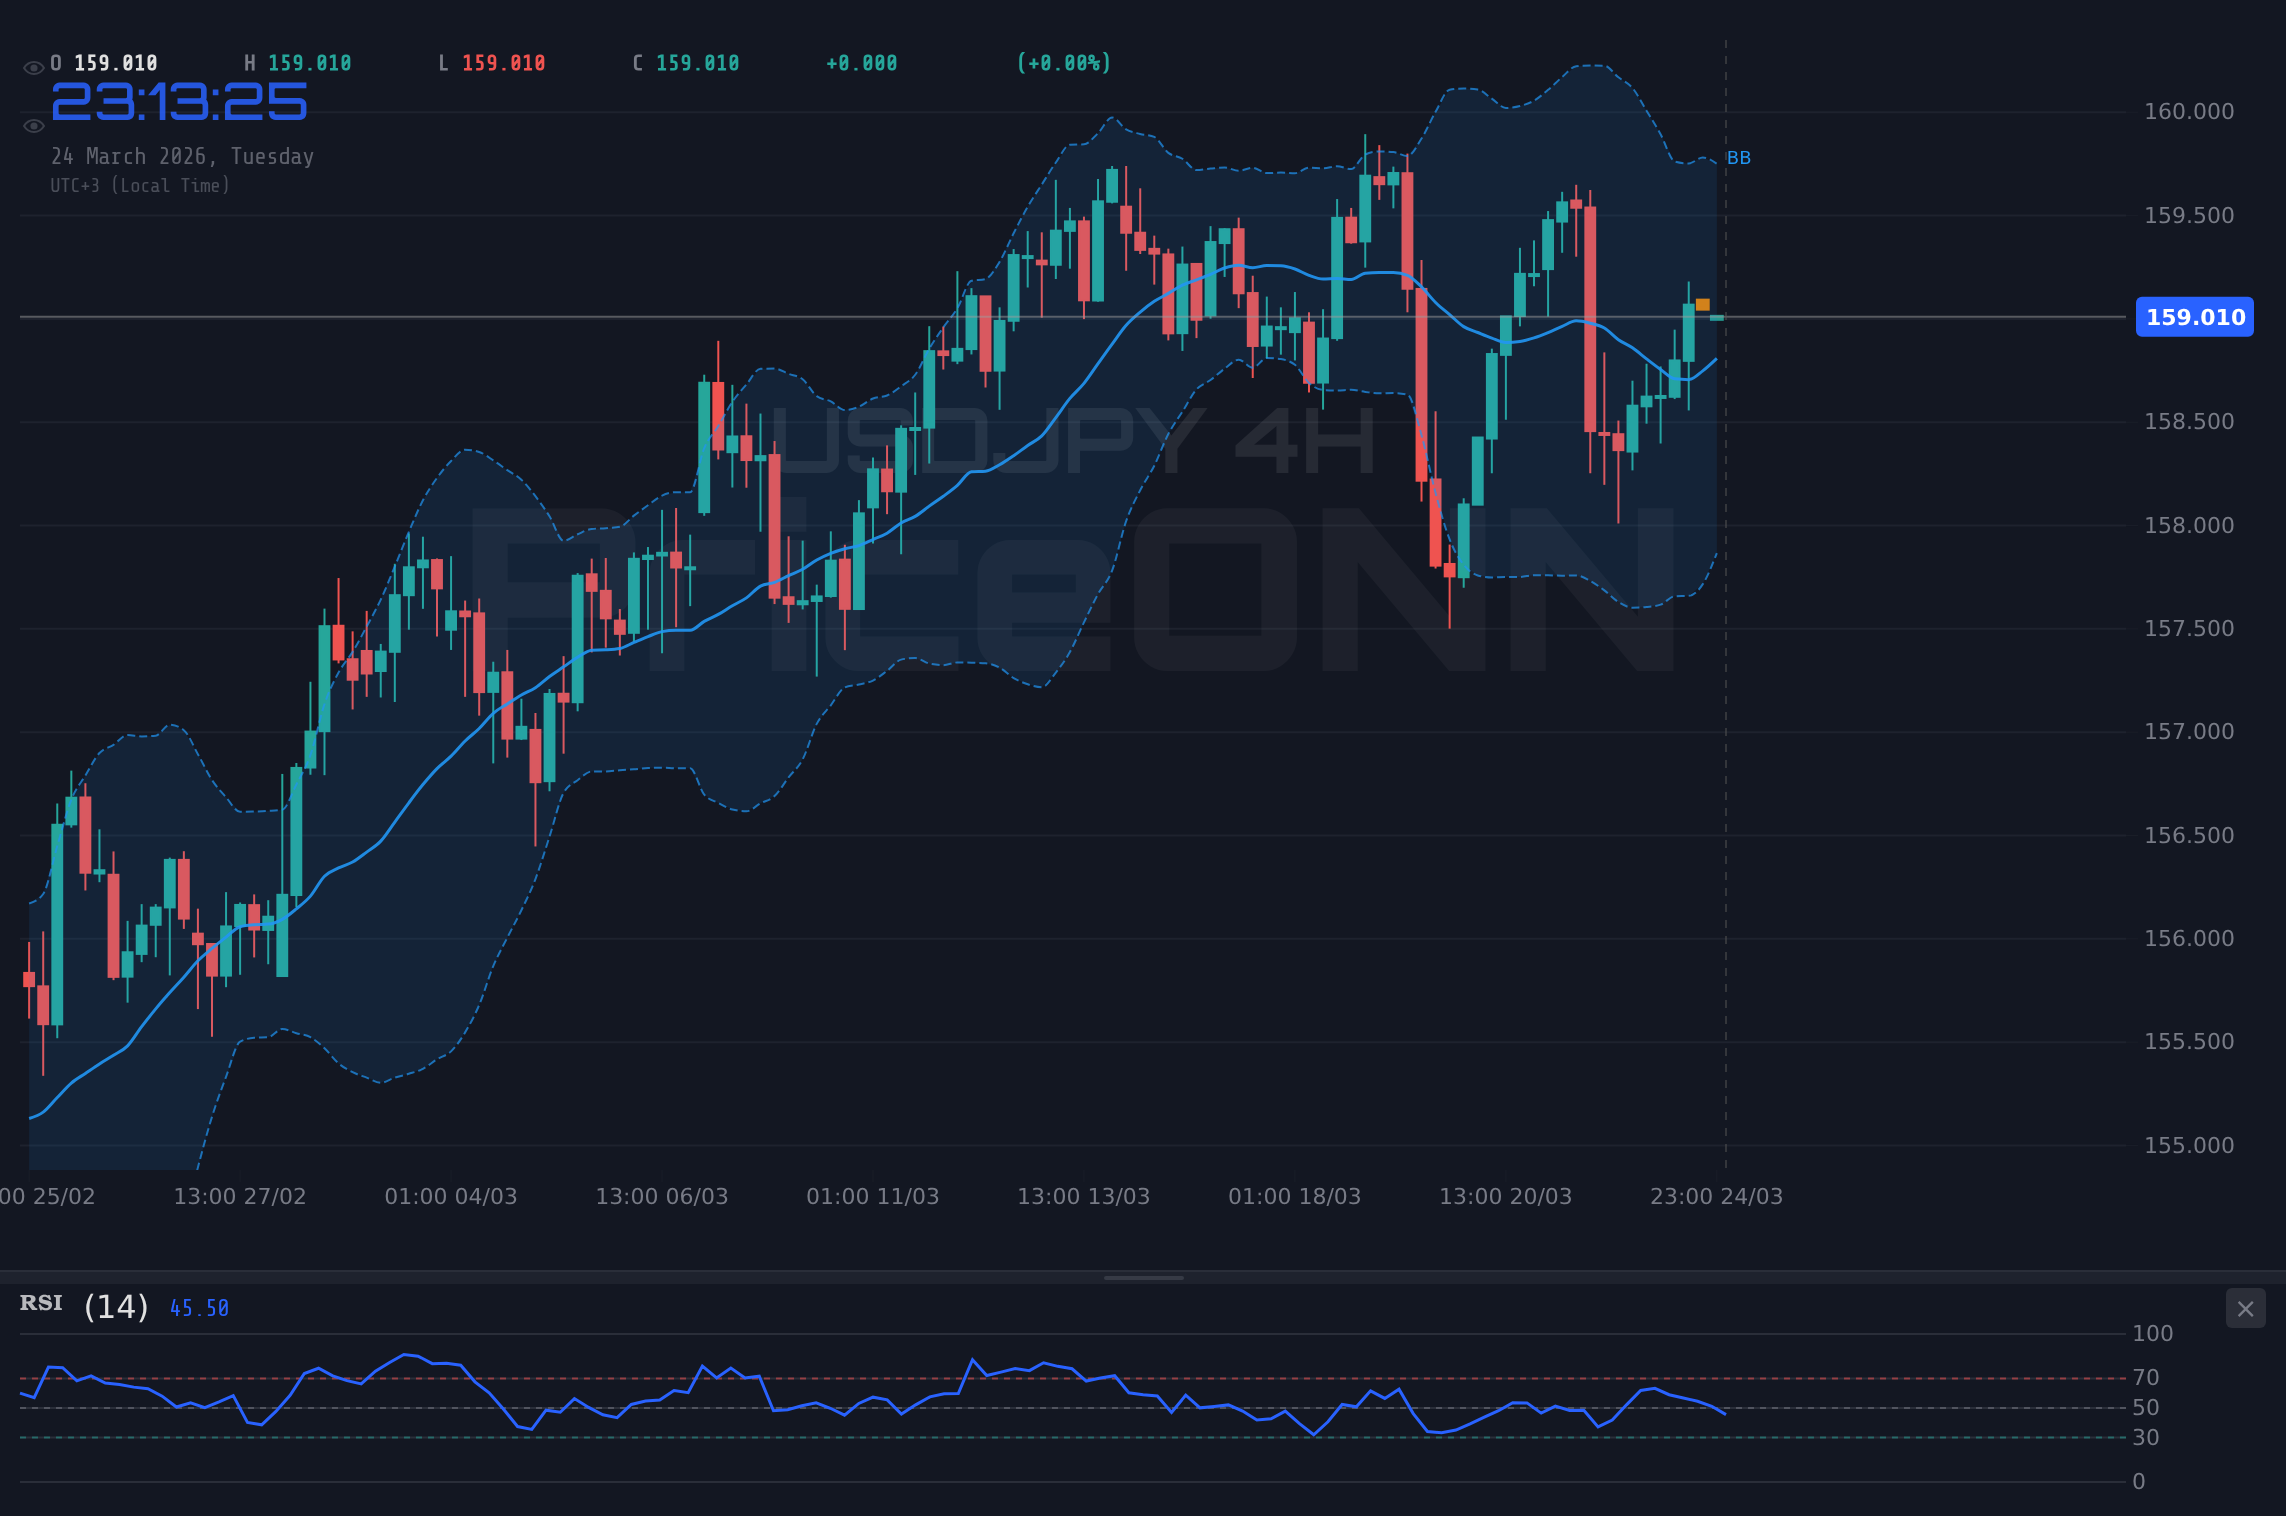
The 4-hour chart shows a trend that is currently classified as 'Düşüş' (Downtrend) with a high strength of 89%. This seems counterintuitive given the price action hovering near highs, but it reflects recent price action and momentum indicators. The ADX here is 17.33, still indicating a weak trend, which might be a sign of consolidation within a larger move rather than a definitive trend. Meanwhile, the daily chart presents a neutral trend with 50% strength, but the ADX at 21.48 suggests a moderately strong trend is building. This conflict across timeframes - neutrality on the 1-hour and daily, but a strong downtrend signal on the 4-hour - is exactly where the 'WATCH_ZONE' decision comes into play. It signals that immediate trading may be risky due to choppy conditions, and a clearer directional setup needs to emerge.
Why USDJPY Volatility Analysis Points to a Breakout
The current technical indicators on the daily timeframe for USDJPY are sending mixed signals, but a pattern is emerging that demands attention. The RSI(14) stands at 57.47, firmly in neutral territory, suggesting neither overbought nor oversold conditions. This level often indicates a market that is balanced, waiting for a catalyst to push it in one direction or another. The MACD histogram, currently negative, shows that while selling momentum might be present, it's not accelerating aggressively, hinting that the bears might be losing some steam. This is crucial because a sustained move often requires strong, consistent momentum.
What is particularly interesting is the Stochastic Oscillator. On the daily chart, the %K line at 58.1 is above the %D line at 65.25, which typically signals a potential upward move. However, the fact that %K is still below %D on the 4-hour chart (49.39 vs 33.88) adds a layer of complexity. This divergence suggests that while the longer-term outlook might lean bullish, the intermediate-term is showing signs of caution or even a potential pullback. The ADX at 21.48 on the daily chart indicates a moderate trend strength, suggesting that the market is not entirely directionless, but also not in a strong, committed trend. This creates an environment ripe for volatility once a clear breakout occurs.
The Dollar Index and Its Influence on USDJPY
The Dollar Index (DXY), currently trading at 99.21, plays a pivotal role in the USDJPY equation. A rising DXY, as we're seeing today with a 0.45% gain and trading near 99.21, typically exerts downward pressure on currency pairs like USDJPY, where the US Dollar is the base currency. The DXY's upward trajectory is supported by its own daily trend strength of 91%, indicating a robust bullish sentiment in the greenback. This strength is further corroborated by its RSI at 55.93, which is comfortably in the neutral-to-bullish zone, and a daily ADX of 32.74, signifying a strong uptrend. The fact that the DXY is showing such resilience, even as USDJPY probes higher levels, highlights a potential decoupling or a complex market dynamic at play.
Typically, a strong DXY would imply USDJPY is facing significant headwinds. However, the persistent strength in USDJPY suggests that the Yen's weakness is currently a more dominant factor than the Dollar's overall strength relative to other majors. This could be due to specific market dynamics related to Japanese monetary policy or unique safe-haven flows that are not fully captured by the DXY. The intraday Stochastic on the DXY showing a potential pullback (%K below %D) might offer a brief respite for USDJPY if it materializes, but the overarching bullish trend of the Dollar Index remains a significant factor to monitor. Traders must watch if the DXY can maintain its upward momentum above the 99.23 resistance level; a sustained break higher would likely add fuel to the USDJPY fire, potentially pushing it towards the 160 handle.
Navigating the Yen Weakness: Inflation and Monetary Policy
The recent inflation data from Japan, while not a complete reversal of inflationary pressures, has provided a brief pause in the Yen's steep depreciation. However, the core issue remains: the Bank of Japan's commitment to negative interest rates and yield curve control stands in stark contrast to the tightening cycles of most major central banks. This policy divergence is the primary engine driving USDJPY higher. Even if inflation shows signs of cooling, the BoJ's policy framework is unlikely to shift dramatically in the short term without more concrete evidence of sustained wage growth and demand-driven inflation.
The market's reaction to the inflation data underscores this point. While the Yen might have seen a brief bout of strength, the immediate resumption of USDJPY's upward trend, coupled with the DXY's rise, indicates that the market is already pricing in the BoJ's continued accommodative stance. The news that USD/JPY is trading near 158.55 as the Japanese Yen softens following a cooler-than-expected inflation report is a textbook example of this dynamic. This suggests that any relief rallies in the Yen are likely to be short-lived unless there is a significant shift in the BoJ's forward guidance or a major change in global risk sentiment that boosts safe-haven demand for the Yen more substantially.
Geopolitical Tensions and Risk Sentiment
In the current market environment, geopolitical tensions continue to cast a long shadow, influencing risk sentiment and safe-haven flows. While the immediate focus might be on inflation data and central bank policies, the underlying geopolitical landscape remains volatile. The ongoing conflicts in the Middle East and Eastern Europe, coupled with broader US-China relations, create an unpredictable backdrop. These factors can, at any moment, trigger a flight to safety, which traditionally benefits currencies like the Japanese Yen and the Swiss Franc, as well as assets like gold. However, the recent price action in USDJPY suggests that, for now, these geopolitical risks are not overpowering the Yen-weakening fundamentals.
The resilience of the US Dollar amidst lingering geopolitical tensions, as highlighted by market analysis, is a testament to its status as the world's primary reserve currency. Even when safe-haven demand might typically favor the Yen, the broader macroeconomic picture and interest rate differentials are currently dominating the narrative. The Brent crude oil market, which experienced a dramatic reversal after briefly topping $100, shows how quickly sentiment can shift. A plunge in oil prices, potentially driven by easing geopolitical fears or demand concerns, could reduce inflationary pressures globally, indirectly affecting central bank policy expectations and, consequently, currency pairs like USDJPY. For USDJPY, a significant escalation of geopolitical risk could lead to a sharp reversal, as traders seek the safety of the Yen, but the current technical setup does not strongly signal such an outcome.
Trade Scenarios for USDJPY Around the $159.03 Level
Given the conflicting signals across different timeframes and the critical $159.03 level, a cautious approach is warranted. The ADX at 17.33 on the 4-hour chart and 21.48 on the daily chart suggests that while a trend might be forming, it lacks strong conviction yet. This 'WATCH_ZONE' environment means that specific entry triggers are needed before committing to a trade. A clear break and sustained hold above the 4-hour resistance at $159.122 could signal a continuation of the bullish trend, potentially targeting higher levels. Conversely, a decisive break below the 1-hour support at $158.82, especially on increasing volume, might indicate a short-term pullback or a deeper correction.
The daily chart offers longer-term support levels at $157.70 and $157.036. A break below these levels would significantly invalidate the bullish thesis and suggest a more substantial correction. On the resistance side, the daily chart points towards $159.339 as the immediate hurdle, with further targets at $160.314 and $160.978. The strength of the DXY at 99.21 and the persistent policy divergence between the Fed and the BoJ remain key drivers that support a bullish outlook for USDJPY, but the choppy technicals demand patience.
Bearish Scenario: Yen Strength Resumes
25% ProbabilityNeutral Scenario: Consolidation Around $159.03
35% ProbabilityBullish Scenario: Breakout Above Resistance
40% ProbabilityThe market is currently in a state where patience is a virtue. While the fundamental drivers - interest rate differentials and the BoJ's policy - continue to support a bullish outlook for USDJPY, the technical picture is not yet offering a clear, high-conviction entry. The ADX readings across timeframes suggest a lack of strong directional commitment, making it a 'WATCH_ZONE' rather than a 'TRADE_ZONE'. A daily close above the critical resistance at $159.339, supported by increasing volume and positive DXY momentum, would be the signal needed to open the door for further gains towards the $160 psychological level.
Frequently Asked Questions: USDJPY Analysis
What happens if USDJPY breaks above $159.339 resistance?
A sustained break above the daily resistance at $159.339, especially on increasing volume, would likely trigger further bullish momentum. This could open the door for targets towards $160.314, supported by the ongoing interest rate differentials and a strong DXY.
Should I buy USDJPY at current levels of $159.03 given the mixed signals?
Buying at current levels of $159.03 is risky due to the choppy technicals and weak trend signals (ADX ~17-21). Wait for a confirmed breakout above $159.339 with robust volume, or a clear test and hold of daily support at $157.70, before considering a position.
Is the RSI at 57.47 a sell signal for USDJPY right now?
An RSI of 57.47 on the daily chart is not a sell signal; it indicates neutral pressure with a slight bullish bias. It suggests the market is not overbought, leaving room for potential upside, but it does not provide a strong buy signal on its own.
How will the upcoming US inflation data affect USDJPY this week?
Stronger-than-expected US inflation data could reinforce Fed hawkishness, strengthening the DXY and pushing USDJPY higher towards $160. Conversely, softer data might lead to a DXY pullback and a short-term USDJPY correction towards $157.70.
| Indicator | Value | Signal | Interpretation |
|---|---|---|---|
| RSI (14) | 57.47 | Neutral | Balanced momentum, room for upside |
| MACD Histogram | -0.15 | Bearish | Selling momentum fading but still present |
| Stochastic (%K/%D) | 58.1 / 65.25 | Neutral | Mixed signals, potential for reversal |
| ADX | 21.48 | Moderate Trend | Trend is building but lacks strong conviction |
| Bollinger Bands | Middle Band | Watch | Price hovering near middle band, awaiting direction |
Track markets in real-time
AI-powered analysis, technical indicators and real-time price data.
Join Our Telegram Channel
Breaking market news, AI analysis and trading signals instantly.
Join Channel