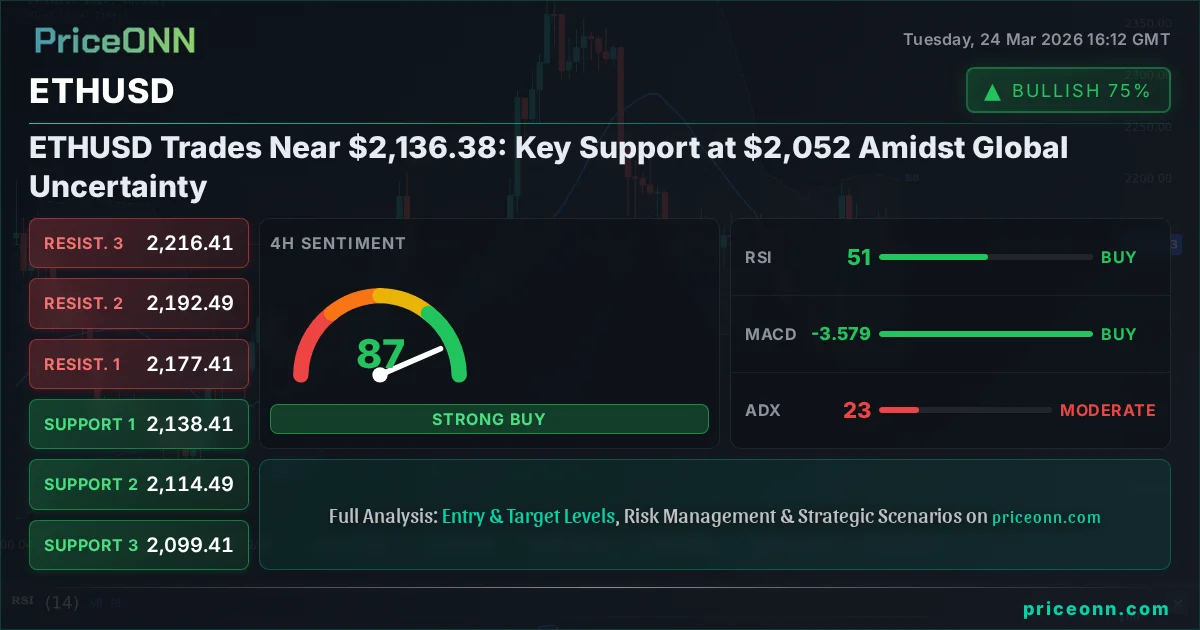
ETHUSD Trades Near $2,136.38: Key Support at $2,052 Amidst Global Uncertainty
ETHUSD hovers around $2,136.38. With key support at $2,052 and facing global headwinds, traders eye critical levels. Analysis reveals potential for volatility.
Now this is where it gets interesting! The crypto market, particularly Ethereum (ETHUSD), is currently at a critical juncture, trading near the $2,136.38 mark. This isn't just another price point; it represents a delicate balance, a pivot around which significant market forces are coalescing. Having navigated the choppy waters of the past few weeks, where volatility has been the only constant, ETHUSD now finds itself teetering on the edge of key psychological and technical levels. The question on every trader's mind isn't just about the immediate price action, but what broader market dynamics and geopolitical undercurrents are shaping the narrative for this digital asset. We're seeing a fascinating interplay between risk sentiment, the strength of the US Dollar, and the specific technical signals ETHUSD is flashing across multiple timeframes. Understanding this confluence is paramount for anyone looking to navigate the opportunities and risks that lie ahead.
- RSI at 49.47 on the 1H chart signals bearish momentum is building, suggesting caution for intraday traders.
- Critical support sits at $2,052 on the daily timeframe, a level that has historically acted as a floor during significant downturns.
- The MACD histogram on the 1H chart shows negative momentum, indicating a potential short-term downtrend, while the 4H chart shows positive momentum, creating a divergence.
- Fed rate expectations, reflected in DXY currently at 99.24, are influencing ETHUSD's correlation, suggesting dollar strength could pressure crypto prices.
ETHUSD Today Analysis: Navigating Choppy Waters Above $2,100
The Delicate Dance Around $2,136.38
Ethereum (ETHUSD) is currently finding itself in a precarious position, hovering just above the $2,136.38 level. This price point is more than just a number; it's a battleground where bulls and bears are locked in a tense standoff. On the 1-hour chart, the RSI sits at 49.47, nudging into bearish territory, a sign that intraday momentum might be shifting. However, the 4-hour chart presents a conflicting picture, with an RSI of 50.71 suggesting a more neutral stance, albeit with a slight upward lean. This divergence across timeframes is a classic sign of market indecision, a period where traders are trying to decipher the next significant move. The MACD indicator offers little clarity, showing negative momentum on the 1-hour chart but positive on the 4-hour, further underscoring the current ambiguity. It’s a market that demands patience, where trying to force a trade based on short-term signals alone could be a recipe for disaster. The real story is unfolding on the daily chart, where deeper trends and more significant support levels come into play.
Daily Chart Signals: A Test of Deeper Support
Looking at the daily timeframe for ETHUSD, the picture becomes clearer, albeit more cautionary. The RSI is sitting at 50.99, a level that historically represents a neutral zone, but with a noticeable downward eğilim (trend). This suggests that while outright selling pressure isn't overwhelming, the upward momentum that characterized previous rallies is certainly waning. The MACD indicator on the daily chart is also showing negative momentum, sitting below its signal line, which is a bearish signal that has preceded previous downturns. Bollinger Bands are also trading below the middle band, indicating downward pressure. Most critically, the daily chart points to a significant support level at $2,052. This isn't just an arbitrary number; it's a level that has previously shown strength, acting as a floor during significant price consolidations. A break below this $2,052 mark would be a major signal, potentially opening the door for further downside. For now, however, the price remains above it, creating a crucial demarcation line for the market.
What the Broader Market Tells Us About ETHUSD's Path
DXY Strength and Its Shadow on Crypto
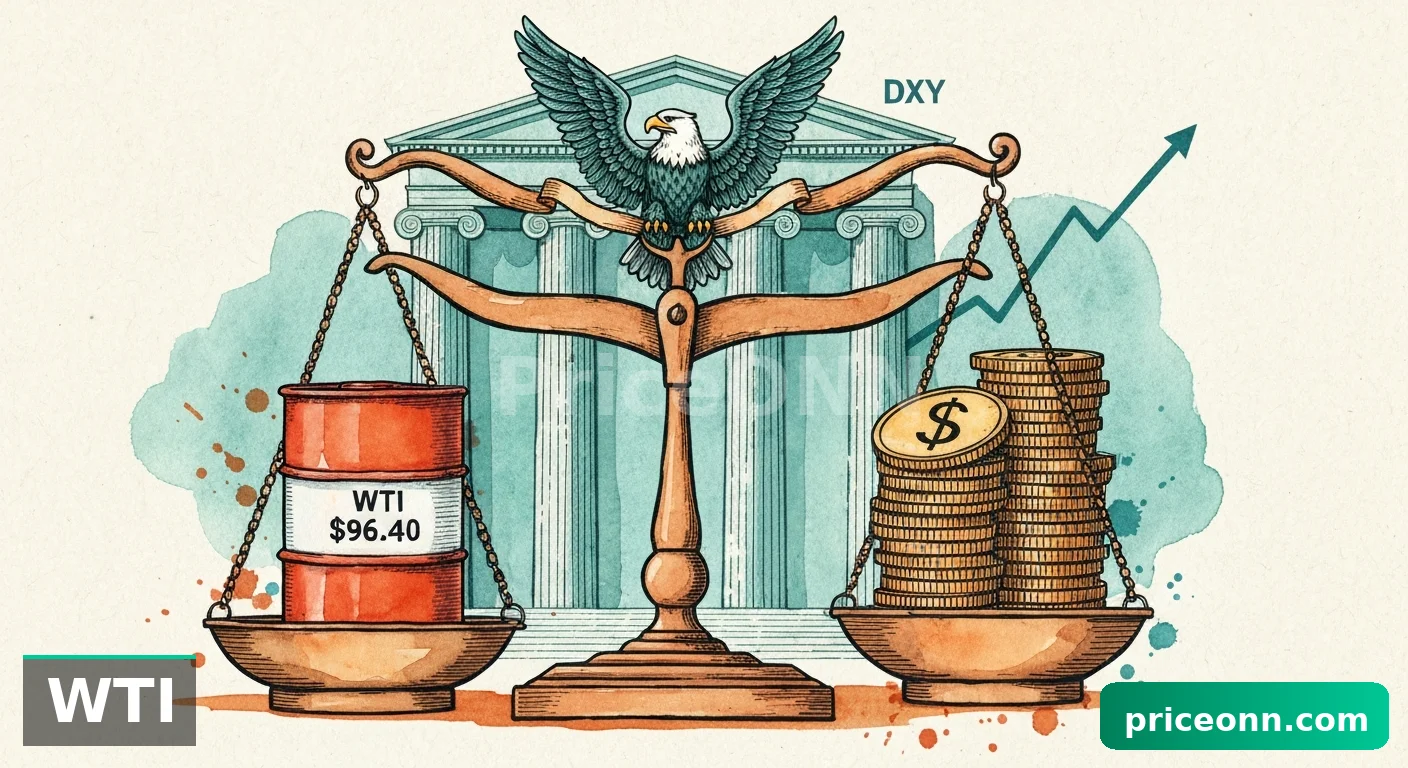
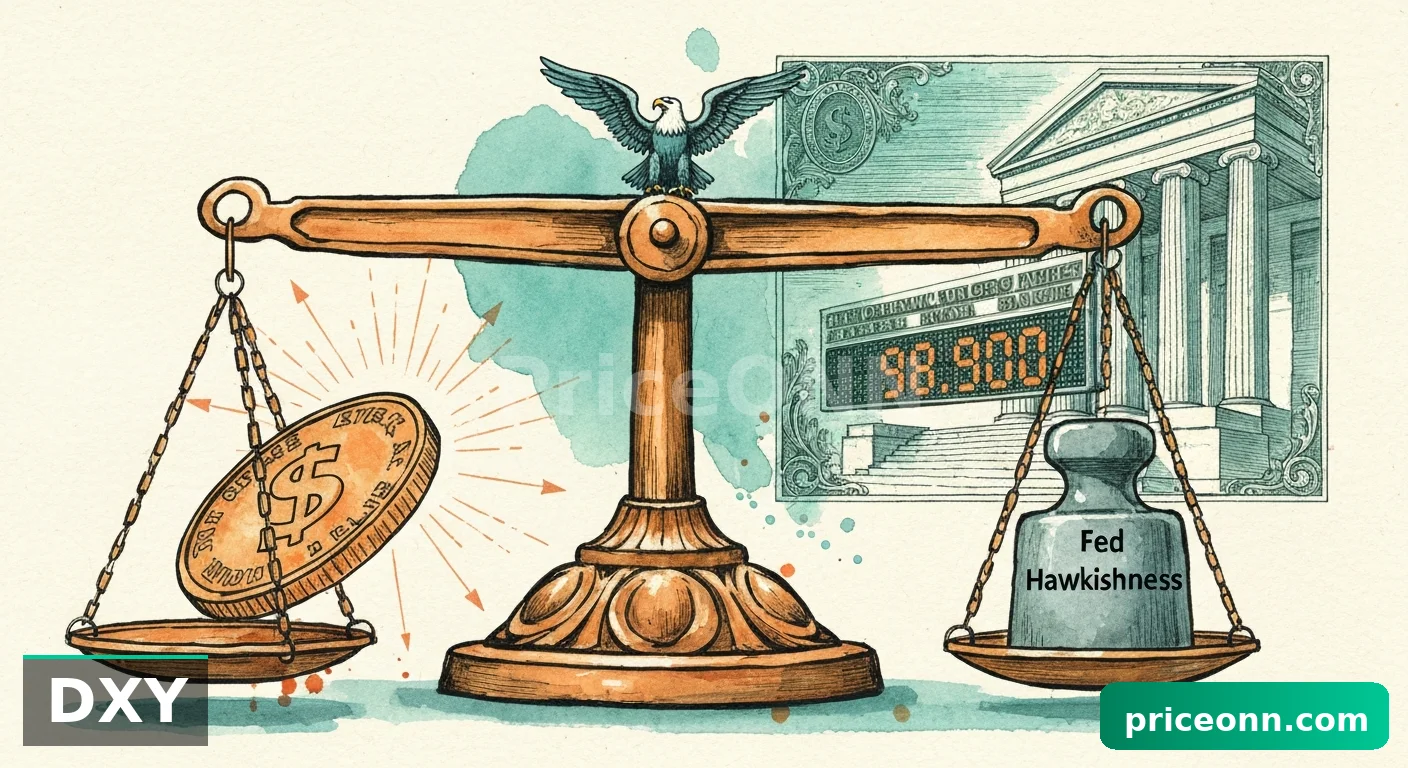
The intricate web of global markets means that the performance of one asset is rarely in isolation. The US Dollar Index (DXY), currently trading around 99.24, is a prime example of this interconnectedness. As the DXY strengthens, it typically exerts downward pressure on riskier assets like cryptocurrencies, including Ethereum. The dollar's current upward trajectory, supported by a robust ADX reading of 32.74 on the daily chart indicating a strong uptrend, suggests that global investors are favoring the perceived safety and yield of dollar-denominated assets. This dynamic creates a challenging environment for ETHUSD. When the dollar strengthens significantly, as it has been, capital tends to flow out of riskier markets and into the greenback. This correlation is not always perfect, but it's a powerful force, and the current DXY levels imply a headwind for Ethereum. Traders are watching to see if this dollar strength will continue to weigh on risk appetite, potentially pushing ETHUSD towards its support levels.
Equities Selloff and Risk-Off Sentiment
The correlation between major stock indices like the S&P 500 and Nasdaq, and cryptocurrencies, is well-established. Currently, the S&P 500 is trading around 6,575.65 with a daily chart trend that is decidedly bearish (ADX 45.34), and the Nasdaq 100 is also showing weakness, trading around 24,081.57 with a strong bearish trend (ADX 39.41). This broader market weakness signals a decline in risk appetite among institutional and retail investors alike. When equities are in retreat, the instinct is often to move away from riskier assets, and cryptocurrencies, despite their potential for high returns, are still perceived as high-risk. This risk-off sentiment can further exacerbate selling pressure on ETHUSD. Investors are pulling money out of speculative assets, seeking refuge in more traditional safe havens. The current equity market's downward trend suggests that the environment for risk assets remains challenging, and ETHUSD may struggle to find sustained upward momentum until this broader sentiment shifts.
Oil Prices and Inflationary Headwinds
The price of oil, particularly Brent crude at $103.94, is a critical indicator for inflationary pressures and geopolitical stability. The recent surge in oil prices, with Brent showing a strong daily uptrend (ADX 63.98), signals rising inflation expectations. Higher energy costs ripple through the economy, increasing transportation and production costs for businesses, which can eventually feed into consumer prices. This inflationary environment has significant implications for central bank policy. If inflation remains stubbornly high, it could force central banks, including the Federal Reserve, to maintain higher interest rates for longer, or even consider further tightening. This would be a bearish signal for risk assets like ETHUSD, as higher interest rates increase the cost of capital and reduce the attractiveness of speculative investments. The market is closely watching oil prices as a barometer for inflation and a potential driver of future monetary policy decisions.
Intermarket Dynamics and What They Mean for ETHUSD
The Fed's Balancing Act: Rate Path Uncertainty
The Federal Reserve remains a central figure in market narratives, and its forward guidance on interest rates is a critical driver of asset prices. Recent commentary from San Francisco Fed President Mary Daly suggests the central bank faces an uncertain path for monetary policy, highlighting the difficulty in navigating inflationary headwinds without a clear rate path. This uncertainty is palpable. While some anticipate rate cuts later this year, persistent inflation, as indicated by rising oil prices and sticky core PCE data (though not provided in this specific data set, it's a known macro factor), could delay or diminish those expectations. The market's pricing of Fed fund futures, which reflects these expectations, is constantly shifting. If the Fed signals a 'higher for longer' interest rate environment, it generally bodes ill for growth assets like ETHUSD, as the opportunity cost of holding non-yielding or speculative assets increases. Conversely, any hint of a dovish pivot could spark a rally across risk assets.
Geopolitical Tensions and Safe-Haven Flows
The global geopolitical landscape remains a significant source of market volatility. Escalating tensions, particularly in regions like the Middle East, often trigger a flight to safety. This phenomenon typically benefits traditional safe-haven assets such as the US Dollar (DXY), US Treasuries, and even gold. While cryptocurrencies are increasingly seen as a store of value by some, they are still largely viewed as risk assets, meaning they often suffer during periods of heightened geopolitical uncertainty. The recent news of geopolitical détente hopes fading and the US Dollar finding strength from these risks underscores this point. As safe-haven demand for currencies like the Yen surges amidst geopolitical tensions, it further highlights the risk-off environment. For ETHUSD, this means that while it might not be a direct safe haven, the broader market sentiment driven by these global events plays a crucial role in its price action. A sustained period of geopolitical instability would likely weigh on ETHUSD, pushing investors towards more established safe havens.
The Impact of Foreign Fund Flows
Recent reports indicate that foreign funds are ditching Asian stocks at a historic rate, a clear sign of global risk aversion and a potential shift in capital allocation. While this specific news focuses on Asian equities, it reflects a broader trend of capital seeking perceived safety. When such significant outflows occur from major markets, it can have ripple effects across the globe, influencing liquidity and risk appetite in other asset classes, including cryptocurrencies. This flight from riskier markets suggests a cautious stance among global investors, which is generally not conducive to strong performance in assets like ETHUSD. It implies that capital may be consolidating in perceived safe havens, such as the US Dollar, rather than flowing into speculative or high-growth assets. This trend needs to be closely monitored as it directly impacts the availability of capital for riskier investments.
ETHUSD Trading Signals and Key Levels
1-Hour Chart: Short-Term Ambiguity
On the 1-hour timeframe, ETHUSD is currently trading around $2,136.38. The technical indicators paint a mixed, albeit slightly bearish, picture for intraday traders. The RSI at 49.47 is creeping lower, suggesting a loss of bullish momentum. The MACD histogram is also in negative territory, indicating selling pressure. Stochastic Oscillator shows %K at 28.57 and %D at 31.62, confirming a bearish signal as %K is below %D, and both are in the lower range, hinting at potential further downside. The ADX at 18.57 signifies a weak trend, meaning any move might lack conviction and could be prone to reversals. However, the Bollinger Bands are trading below the middle band, indicating a potential for further downward movement or a breakdown. While the overall signal leans towards 'SELL' on this timeframe (5 Sell, 3 Buy, 0 Neutral), the weak trend strength suggests caution. This is not a strong directional conviction, and short-term traders should be wary of false breakouts or reversals.
4-Hour Chart: Conflicting Momentum
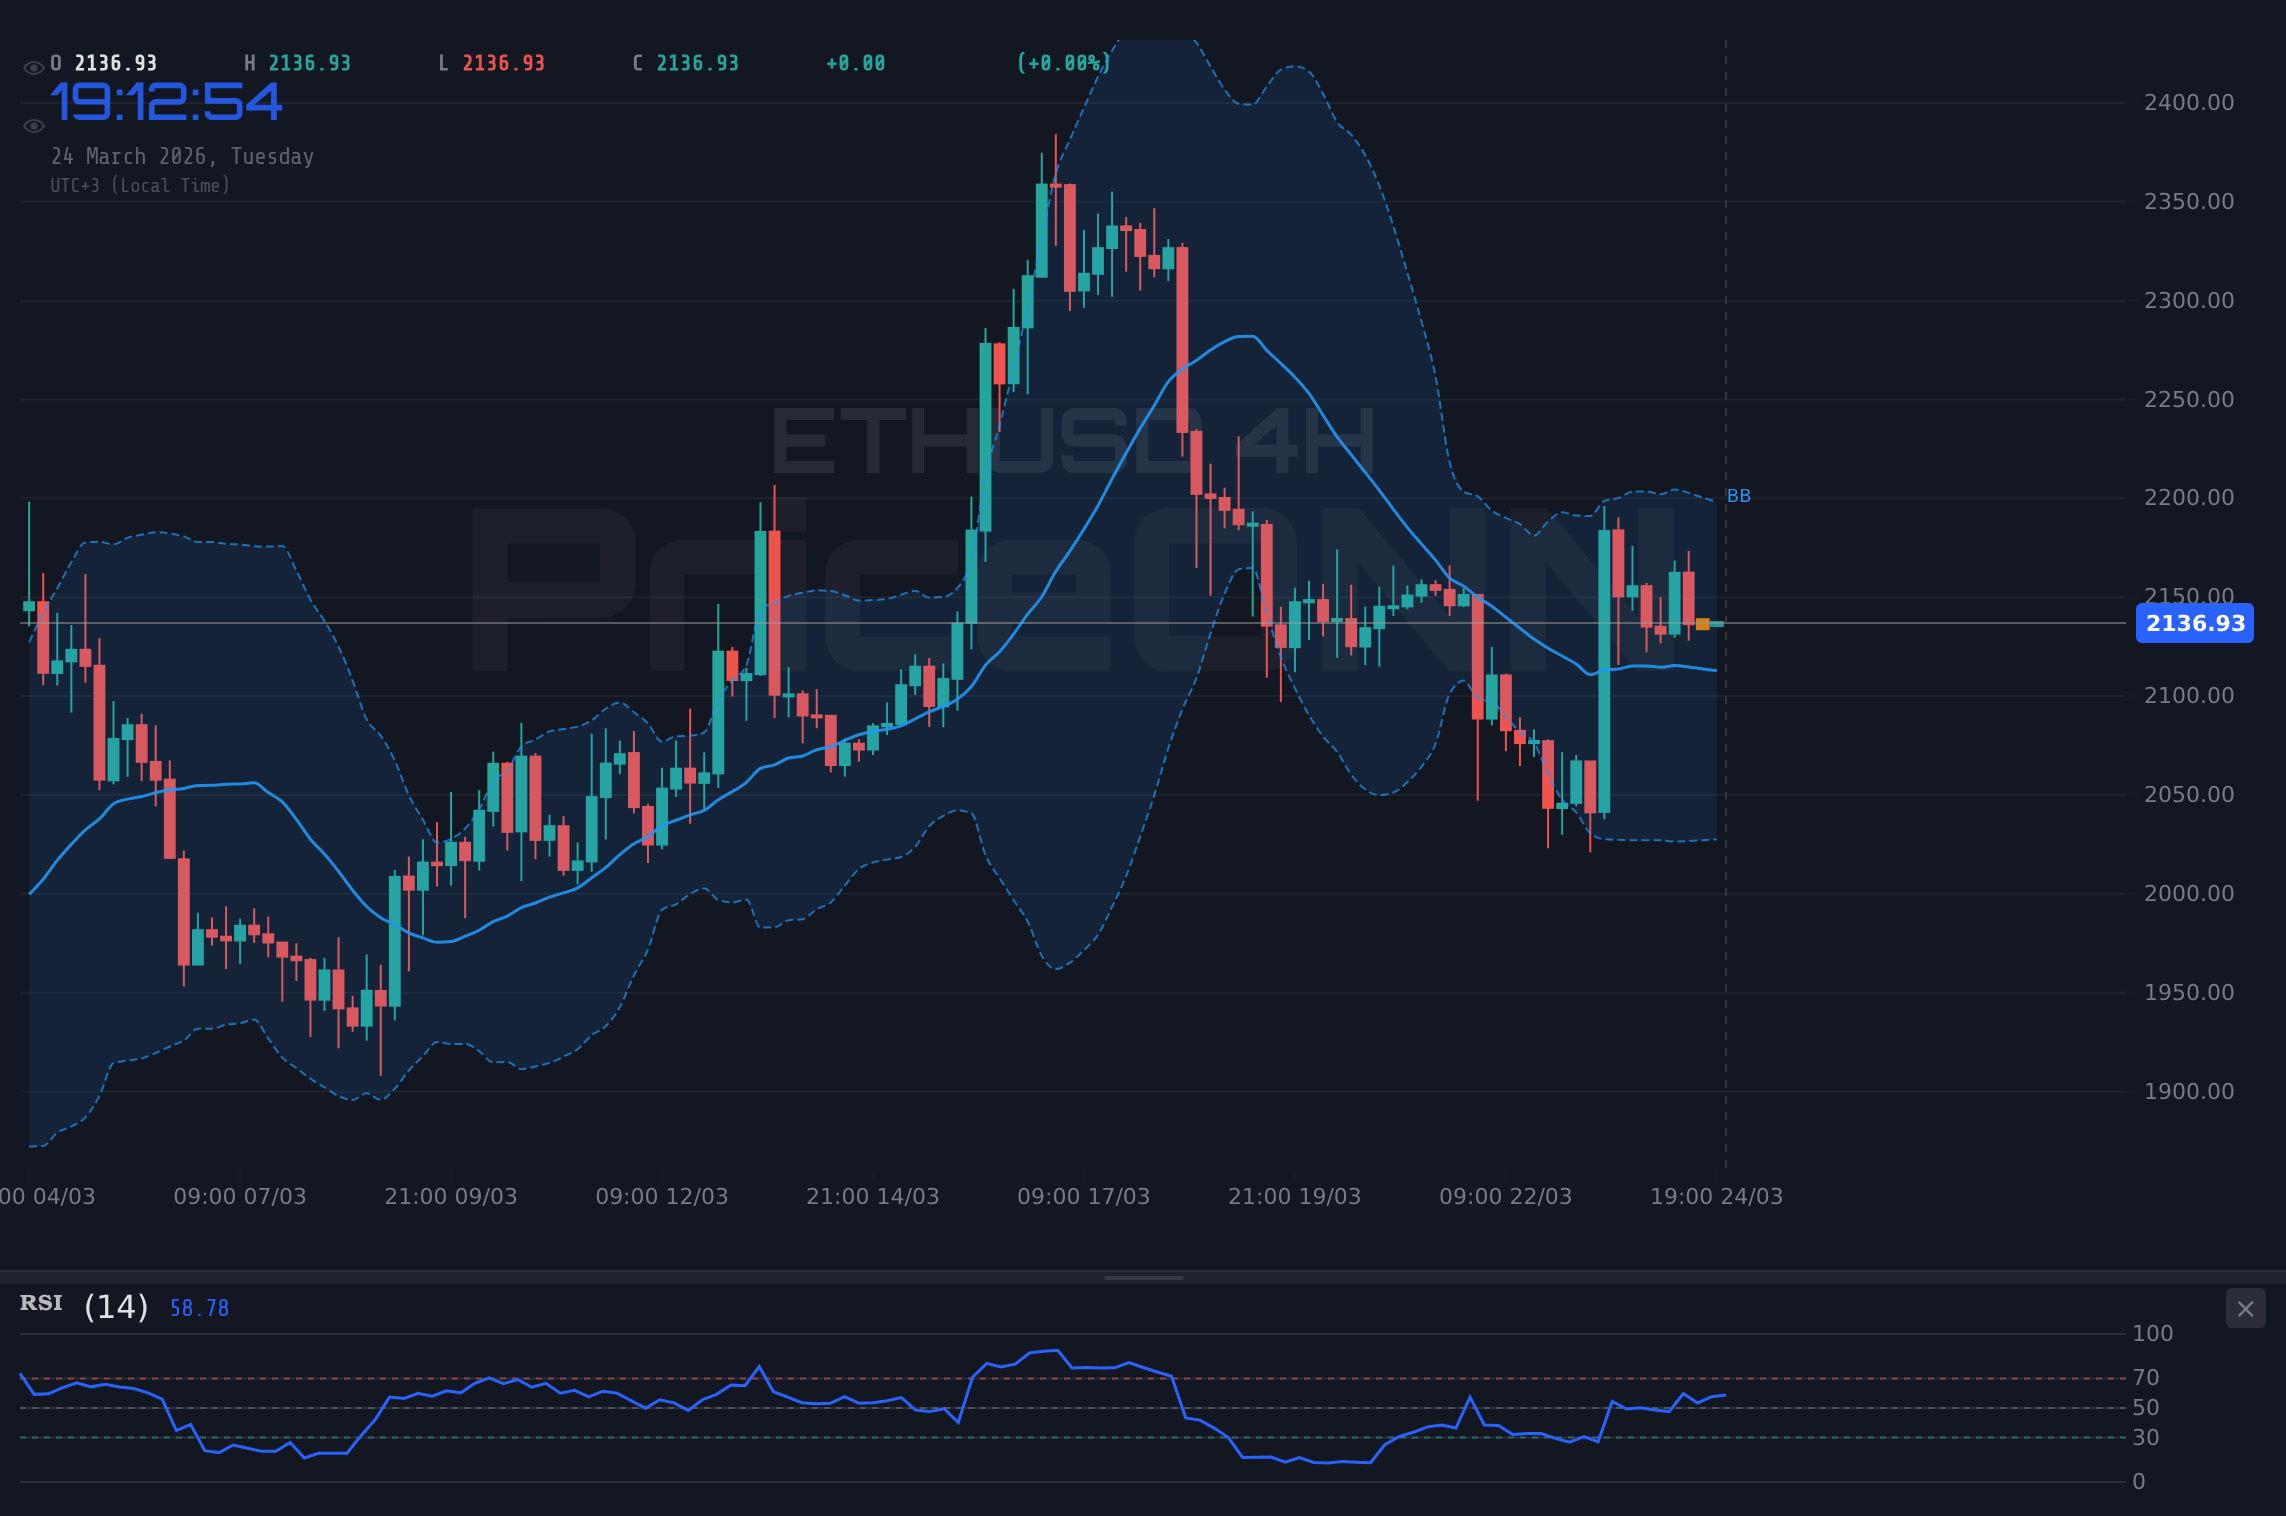
The 4-hour chart for ETHUSD presents a more complex scenario. The current price hovers around $2,136.38, with an RSI of 50.71, which is relatively neutral but showing a slight upward eğilim. The MACD is showing positive momentum, with the MACD line above the signal line, which is a bullish signal. However, the Stochastic Oscillator is showing a bearish signal (%K at 69.83, %D at 75.32, with %K below %D), indicating that momentum might be waning and a pullback could be imminent. The ADX reading of 24.82 suggests a moderate trend, stronger than the 1-hour but not yet indicating a strong directional conviction. The Bollinger Bands are trading above the middle band, which is generally bullish. The overall signal for the 4-hour chart leans towards 'BUY' (6 Buy, 2 Sell, 0 Neutral), but the conflicting signals from RSI, MACD, and Stochastic require careful consideration. This timeframe suggests that while there's underlying buying interest, the short-term pressures could cap any immediate upside.
1-Day Chart: The Crucial Support at $2,052
The daily chart is where the most significant technical picture for ETHUSD emerges. The current price of $2,136.38 is well above the critical support level of $2,052. The RSI at 50.99 is neutral, but the trend is slightly downwards, indicating a potential for further cooling. MACD is negative, showing bearish momentum, and Bollinger Bands are below the middle band, reinforcing the idea of downward pressure. The ADX at 18.75 indicates a weak trend, suggesting that the market is not yet committed to a strong directional move on the daily scale, despite the bearish MACD. The Stochastic Oscillator on the daily chart shows %K at 25.24 and %D at 27.55, both in oversold territory and signaling a potential for a bounce, but %K is below %D, which is a bearish signal. The overall signal leans towards 'SELL' (1 Buy, 7 Sell, 0 Neutral), but the presence of strong support at $2,052 cannot be ignored. This level is the linchpin; a sustained hold above it keeps the possibility of a recovery alive, while a decisive break below would signal a more significant downtrend.
Trade Scenarios for ETHUSD
Bearish Scenario: Testing the Depths Below $2,052
65% ProbabilityNeutral Scenario: Consolidation Around $2,100-$2,150
25% ProbabilityBullish Scenario: Reclaiming Higher Ground
10% ProbabilityThe Trader's Edge: What to Watch Now
Actionable Insights for Today
For the active trader, the current environment demands a high degree of risk management and patience. The conflicting signals across different timeframes for ETHUSD mean that chasing short-term moves could be perilous. The 1-hour chart suggests a potential for further downside, with an RSI below 50 and negative MACD momentum. However, the broader daily picture, with support at $2,052, provides a critical floor. A trader might look for a short opportunity if ETHUSD breaks decisively below $2,136.38, aiming for the $2,052 support, but with a tight stop-loss just above the current level to manage risk. Conversely, if ETHUSD shows signs of holding above $2,136.38 and begins to consolidate, waiting for confirmation of a move towards the 4-hour resistance at $2,177.41 could be a strategy, but only if accompanied by increasing volume and positive daily indicator shifts. The key is to avoid premature entries and wait for clear signals. The prevailing risk-off sentiment, driven by DXY strength and equity market weakness, suggests that any bullish move will likely face stiff resistance.
Looking Ahead: Macro Drivers and Their Influence
The path forward for ETHUSD will undoubtedly be influenced by macroeconomic factors and central bank policies. The Fed's stance on interest rates remains a pivotal point. Any indication of a prolonged 'higher for longer' rate environment would likely continue to dampen enthusiasm for risk assets like Ethereum. Conversely, signs of cooling inflation or a shift towards a more dovish monetary policy stance could provide a significant tailwind. Geopolitical events also remain a wild card, capable of triggering sharp shifts in risk appetite and safe-haven flows, which can indirectly impact ETHUSD. The current geopolitical détente hopes fading and the dollar’s resilience highlight this ongoing uncertainty. For ETHUSD to mount a sustained recovery, we would likely need to see a confluence of factors: a stabilization or decline in the DXY, a more risk-on sentiment in equity markets, and clearer signals from central banks that they are moving towards easing. Until then, expect choppiness and a heightened focus on key support and resistance levels.
Frequently Asked Questions: ETHUSD Analysis
What happens if ETHUSD breaks below the critical $2,052 support level?
A decisive break below $2,052 on the daily chart would likely trigger significant selling pressure. Invalidation of the bullish outlook would occur, potentially leading ETHUSD towards the next support levels at $1,948.96 and subsequently $1,877.02, as indicated by the daily chart analysis.
Should I consider buying ETHUSD at current levels around $2,136.38 given the mixed signals?
Current levels present a high-risk, low-reward scenario due to conflicting signals across timeframes and prevailing risk-off sentiment. A more prudent approach would be to wait for confirmation: either a clear break above $2,177.41 on increased volume for a bullish setup, or a decisive break below $2,052 for a bearish trade.
Is the RSI at 49.47 on the 1H chart a strong sell signal for ETHUSD right now?
An RSI of 49.47 on the 1-hour chart does suggest bearish momentum is building for intraday trading, but it's not an extreme oversold or overbought reading. It indicates caution is warranted, but without confirmation from other indicators like MACD or price action breaking key levels, it's not a definitive sell signal on its own.
How will the Fed's potential interest rate path affect ETHUSD this week?
If Fed commentary leans hawkish, signaling rates might stay higher for longer due to persistent inflation (as suggested by oil prices), this would likely pressure ETHUSD. Conversely, any dovish signals or indications of upcoming rate cuts could boost sentiment for risk assets like Ethereum.
Track markets in real-time
AI-powered analysis, technical indicators and real-time price data.
Join Our Telegram Channel
Breaking market news, AI analysis and trading signals instantly.
Join Channel