
Bitcoin's sideways action near $66,622 last Friday close reflects a market caught between conflicting forces. Escalating tensions in the Middle East are fueling safe-haven demand, while looming jobs data could trigger a fresh wave of volatility. Which force will prevail?
- RSI at 41.75 signals potential for further downside pressure.
- Critical support sits at $64,131.33, a break below which could trigger a sharp sell-off.
- MACD histogram shows positive momentum, suggesting a possible bullish reversal.
- Geopolitical tensions and upcoming jobs data are key drivers of BTCUSD volatility.
Iran Conflict Sparks Risk-Off Sentiment
The death of Iran's Supreme Leader Khamenei in a US-Israeli strike, as reported by Iranian state television, has injected a significant dose of geopolitical uncertainty into the markets. This event, coupled with rising tensions in the Middle East, has triggered a flight to safety, benefiting traditional safe-haven assets. However, Bitcoin's role as a safe haven is still under debate, and its price action reflects this ambiguity. The initial surge in oil prices, as reported, further complicates the picture, raising concerns about inflation and potentially impacting central bank policies.
Jobs Data Looms: Potential Catalyst for Volatility
All eyes are now on the upcoming Nonfarm Payrolls (NFP) data, a key economic indicator that could significantly influence the Federal Reserve's monetary policy decisions. Expectations are set at 51.2, lower than the previous 52.4, and the market is closely watching to see if the actual data aligns with these forecasts. A strong NFP reading could reinforce the Fed's hawkish stance, potentially leading to a stronger dollar and downward pressure on BTCUSD. Conversely, a weaker-than-expected NFP could fuel speculation about a potential rate cut, boosting risk assets like Bitcoin.
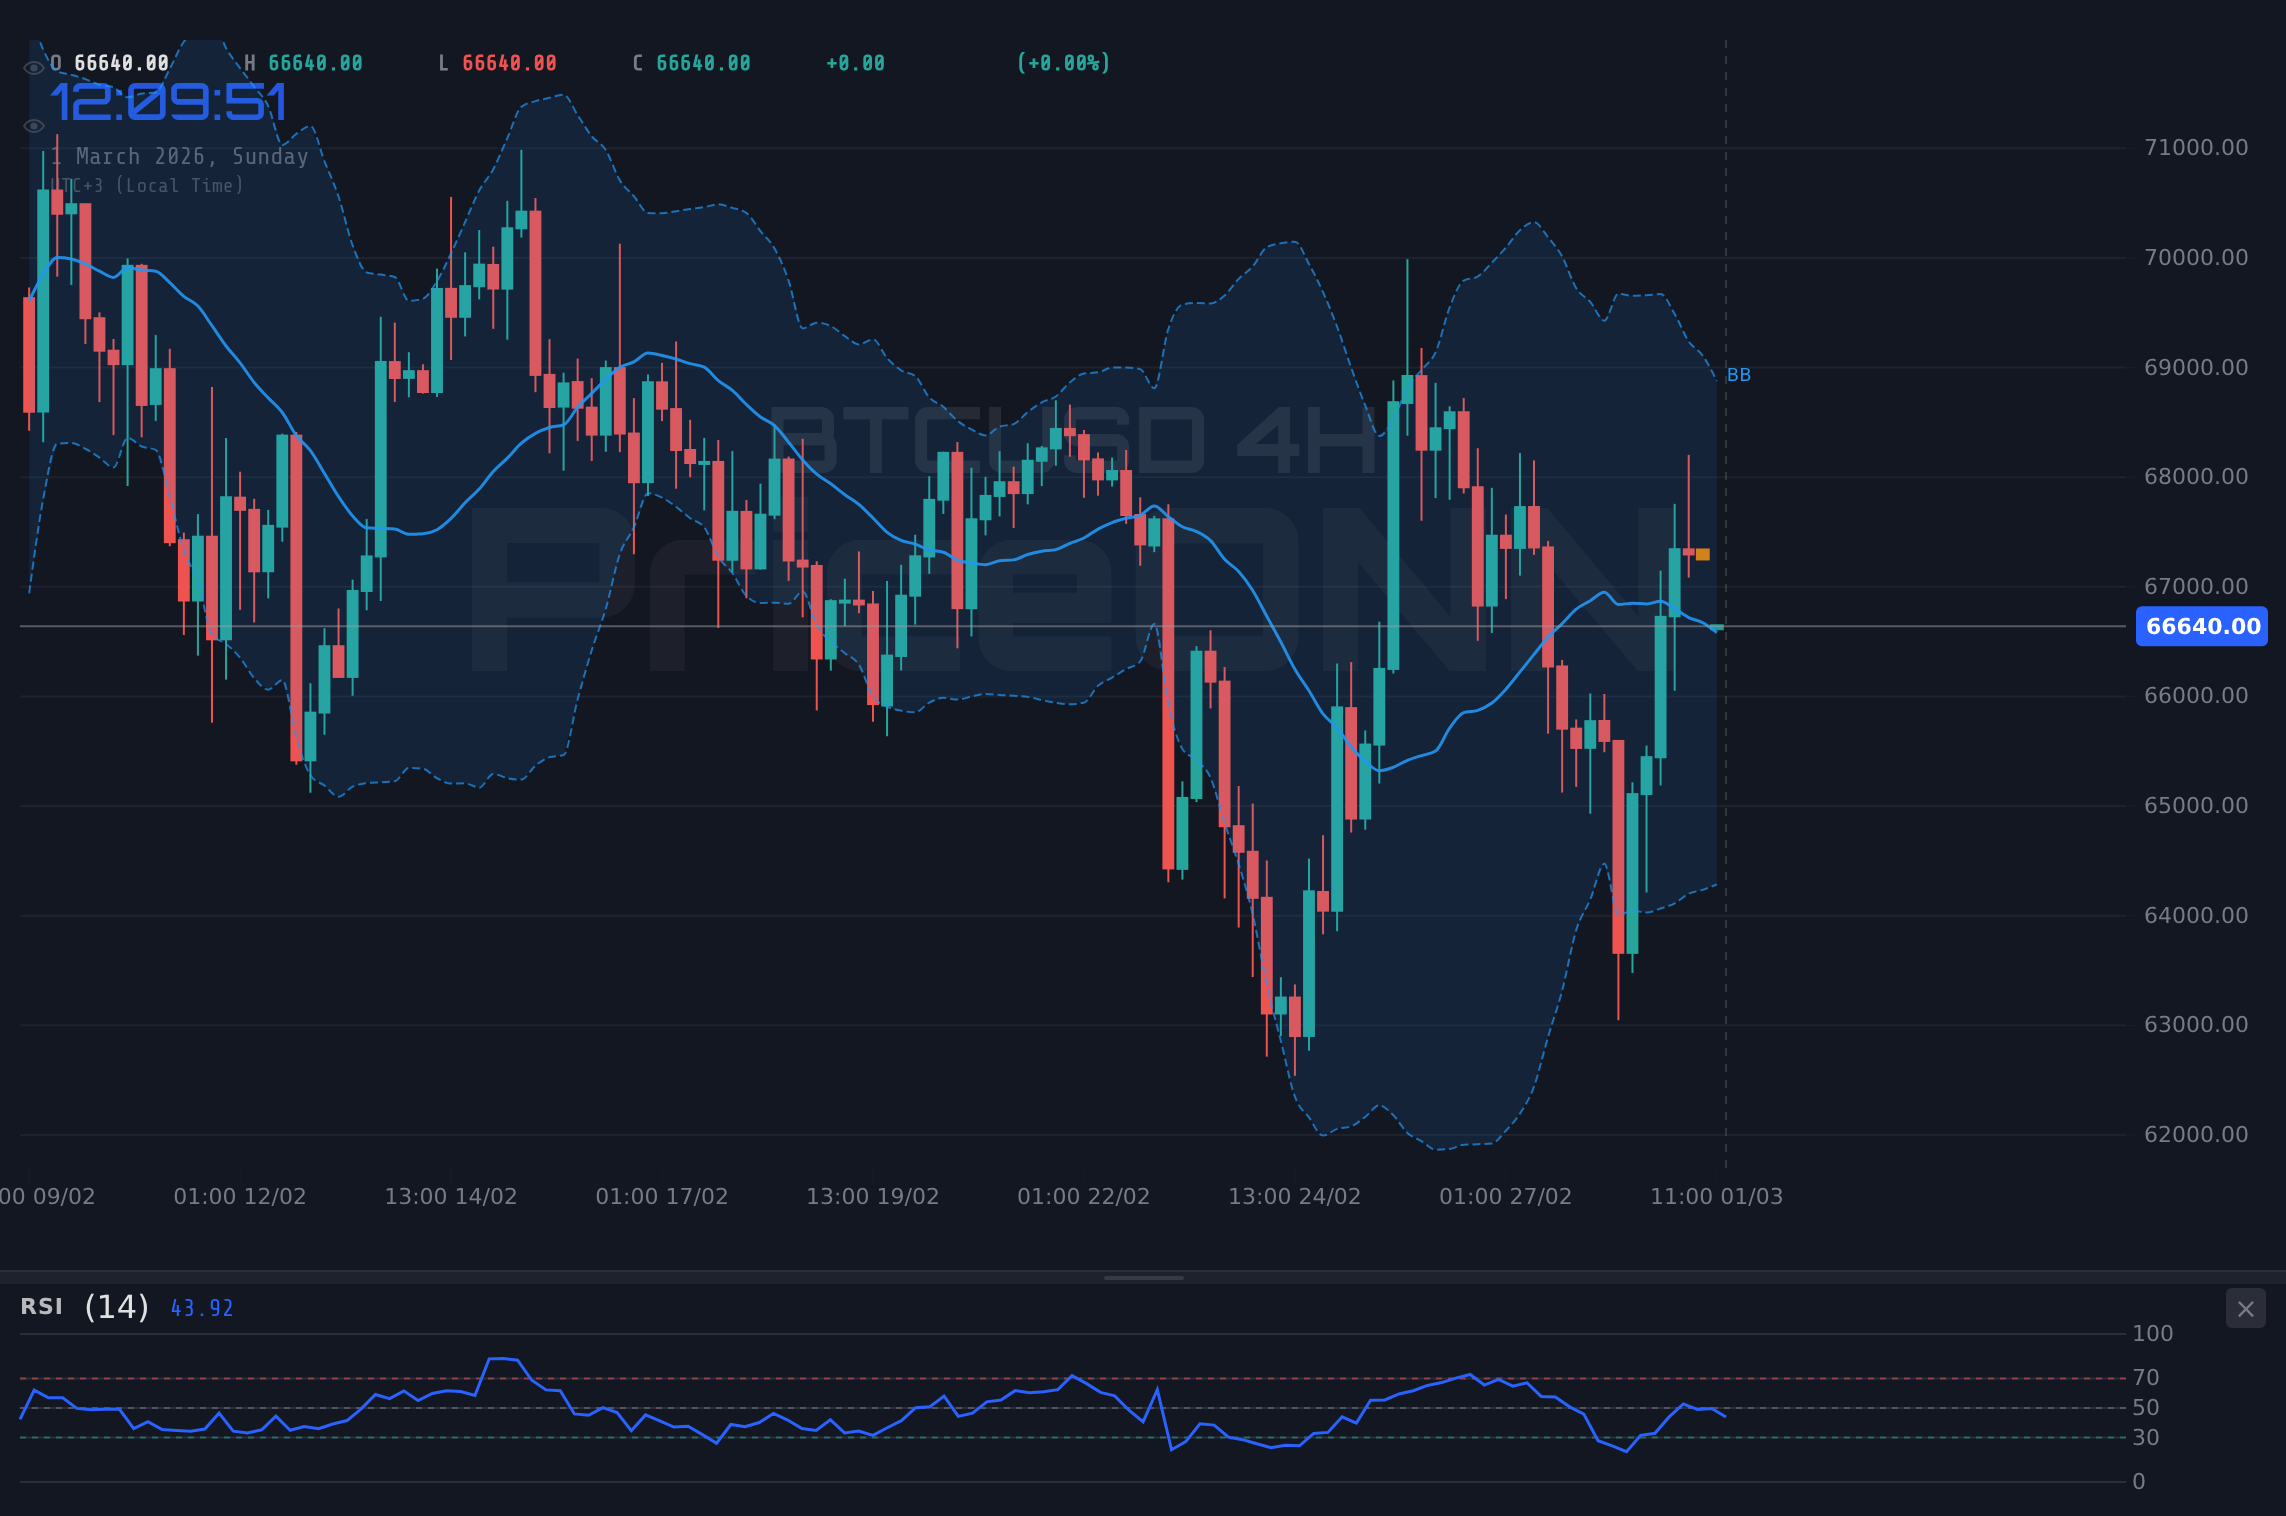
Technical Picture: Stuck in Neutral
From a technical perspective, BTCUSD is currently trading in a neutral zone, as reflected in the mixed signals across different timeframes. On the 1-hour chart, the trend is neutral, while the 4-hour chart shows a bullish trend, and the daily chart indicates a bearish trend. This lack of clear direction underscores the market's indecision. The RSI on the daily chart sits at 41.75, suggesting potential for further downside, while the Stochastic Oscillator shows a bullish crossover, hinting at a possible rebound. The ADX on the daily chart stands at 49.07, indicating a strong downtrend, further adding to the conflicting signals.
Analyzing Key Levels: Support and Resistance
Key support levels to watch are $64,131.33, $61,536.67, and $60,028.33. A break below $64,131.33 could open the door for a test of the lower support levels. On the upside, resistance levels are located at $68,234.33, $69,742.67, and $72,337.33. A sustained move above $68,234.33 would be needed to confirm a bullish breakout and pave the way for further gains. The current price action suggests that the market is waiting for a catalyst to trigger a decisive move in either direction. The 1H trend is neutral, with resistance at $67326.33, support at $66874.33, and an ADX of 35.6.
BTCUSD and the DXY: A Complex Relationship
The Dollar Index (DXY) is currently trading at 97.32, down -0.14% on the day. A weaker dollar typically supports Bitcoin, but the relationship is not always straightforward. With the DXY trading near key support levels, a bounce could put pressure on BTCUSD. Traders should closely monitor the DXY's price action and its correlation with Bitcoin to gain a better understanding of the market dynamics. The inverse relationship between the two assets is a key factor to consider when assessing potential trading opportunities. The DXY's RSI is at 50.36, suggesting a potential shift to the bullish side.
The Elliott Wave Perspective
According to a recent PriceONN analysis, BTCUSD's Elliott Wave pattern suggests a corrective bounce or a potential bullish breakout. The corrective bounce scenario implies that the current sideways action is a temporary pause before a further decline. On the other hand, the bullish breakout scenario suggests that the market is preparing for a sustained uptrend. The key to determining which scenario is more likely to play out lies in closely monitoring the price action and key technical indicators. A decisive break above resistance would favor the bullish scenario, while a break below support would confirm the corrective bounce scenario.
Trade Plan: Waiting for Confirmation
Given the current market conditions, a conservative approach is warranted. Traders should wait for a clear signal before initiating a new position. A potential long entry could be considered on a break above $68,234.33, with targets at $69,742.67 and $72,337.33. A stop-loss order should be placed below $64,131.33 to protect against downside risk. Alternatively, a short entry could be considered on a break below $64,131.33, with targets at $61,536.67 and $60,028.33. A stop-loss order should be placed above $68,234.33 to limit potential losses.
BTCUSD breaks above $68,234.33 resistance, fueled by weaker-than-expected jobs data and renewed risk appetite. Confirmation requires sustained trading above this level, targeting $69,742.67 and $72,337.33.
BTCUSD fails to hold $64,131.33 support, pressured by stronger-than-expected jobs data and DXY strength. This opens the door for a test of $61,536.67 and $60,028.33.
Risk Warning: Jobs Data and Geopolitical Tensions
Traders should be aware of the potential for increased volatility in the coming days, driven by the upcoming jobs data release and ongoing geopolitical tensions. It is crucial to manage risk effectively and avoid over-leveraging positions. The outcome of these events could significantly impact the direction of BTCUSD, so it is essential to stay informed and adapt trading strategies accordingly. Remember to do your own research. The data suggest that the market may be in for some choppy trading, with the bears having a slight advantage.
Frequently Asked Questions: BTCUSD Analysis
Is BTCUSD a good buy right now?
Given the current price of $66,622 and mixed technical signals, it's not a clear buy. Waiting for a confirmed breakout above $68,234.33 or a hold above $64,131.33 is prudent before initiating a position.
What is the BTCUSD price forecast for this week?
The BTCUSD price forecast for this week is highly dependent on the jobs data. A bullish scenario targets $69,742.67, while a bearish scenario could see a drop to $61,536.67. I give a 60% chance to the bullish scenario.
What are the key support and resistance levels for BTCUSD?
Key support levels for BTCUSD are $64,131.33, $61,536.67, and $60,028.33. Resistance levels are at $68,234.33, $69,742.67, and $72,337.33. These levels are derived from daily chart analysis.
Why is BTCUSD moving today?
BTCUSD's price movement today is largely influenced by geopolitical tensions and anticipation of upcoming jobs data. The market is in a holding pattern, awaiting a catalyst to trigger a more decisive move.
Track markets in real-time
AI-powered analysis, technical indicators and real-time price data.
Join Our Telegram Channel
Breaking market news, AI analysis and trading signals instantly.
Join Channel