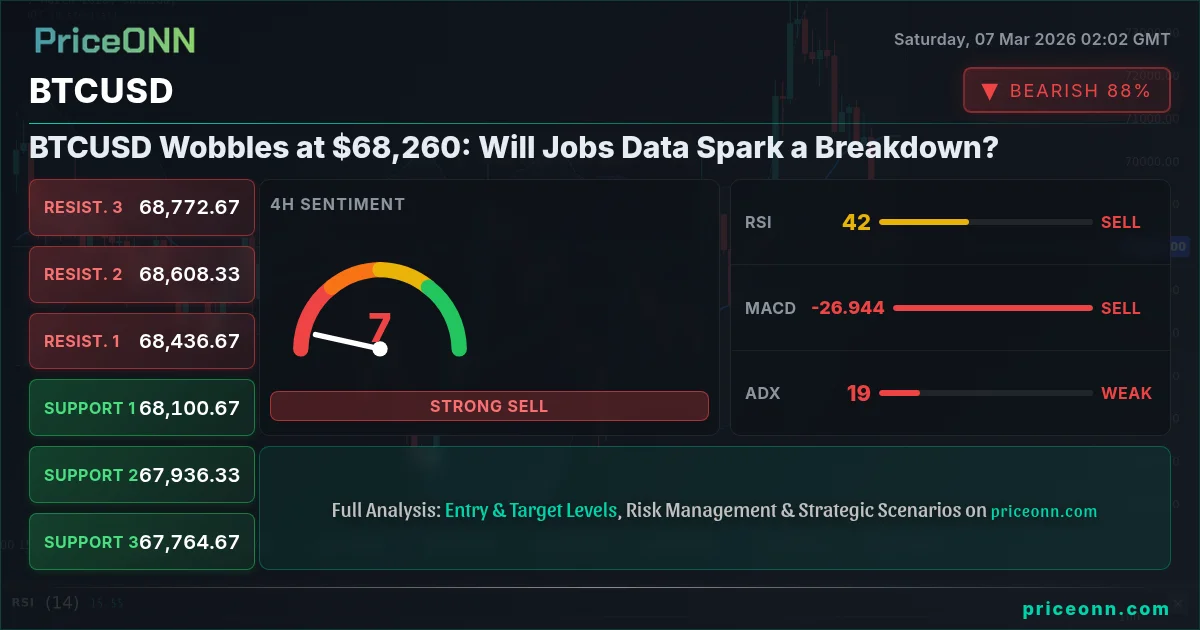
Bitcoin's struggle is real. After failing to sustain its rally above $70,000, BTCUSD is currently hovering around $68,260, and the bears are circling. Why is Bitcoin falling today? The answer may lie in a combination of technical exhaustion and looming economic data. This week's price action has been choppy, and the market is bracing for Friday's US jobs report, which could be the catalyst for the next major move.
- RSI at 31.51 on the 1H chart indicates oversold conditions, but the overall trend remains bearish.
- Key support level to watch sits at $67,885.33, a break below which could trigger further downside.
- MACD histogram shows positive momentum on 1H, a signal of potential short-term correction.
- The market's focus is now on US jobs data and its impact on Fed policy, impacting BTCUSD correlation with DXY.
Let's dive into what's been happening this week and what to expect in the coming days. The recent volatility is a trader's playground, but also a minefield for the undisciplined. Here’s what you need to know.
Last Week's Key Events and Developments
Last week was a mixed bag for Bitcoin. We saw an initial surge towards $72,000, fueled by renewed institutional interest and positive sentiment, but the rally quickly fizzled out. As PriceONN noted earlier this week, BTCUSD consolidated above $70,000, but the bulls couldn't maintain the momentum. This consolidation phase has now given way to a bearish pullback, raising concerns about the sustainability of the overall uptrend.
The decline in SP500 and Nasdaq100, currently at 6737.1 and 24639.96 respectively, also contributed to the risk-off sentiment in the market. As risk appetite declines, safe-haven assets like gold tend to gain traction, putting further pressure on Bitcoin. The DXY, currently at 98.71, is showing signs of strength, which traditionally weighs on BTCUSD.
PriceONN's Weekly News and Analysis
PriceONN’s analysis this week has consistently highlighted the precarious position of BTCUSD. The consolidation above $70,000 was seen as a crucial test, and the failure to break higher has opened the door for a potential pullback. The articles have also pointed out the importance of monitoring key levels and economic data releases, particularly the upcoming US jobs report.
Notably, PriceONN's March 5th report highlighted Bitcoin's resilience amidst market volatility, suggesting a potential safe-haven appeal. However, the current price action indicates that this narrative is being challenged, and Bitcoin may be more correlated with risk assets than previously thought.
Technical Levels Broken or Held
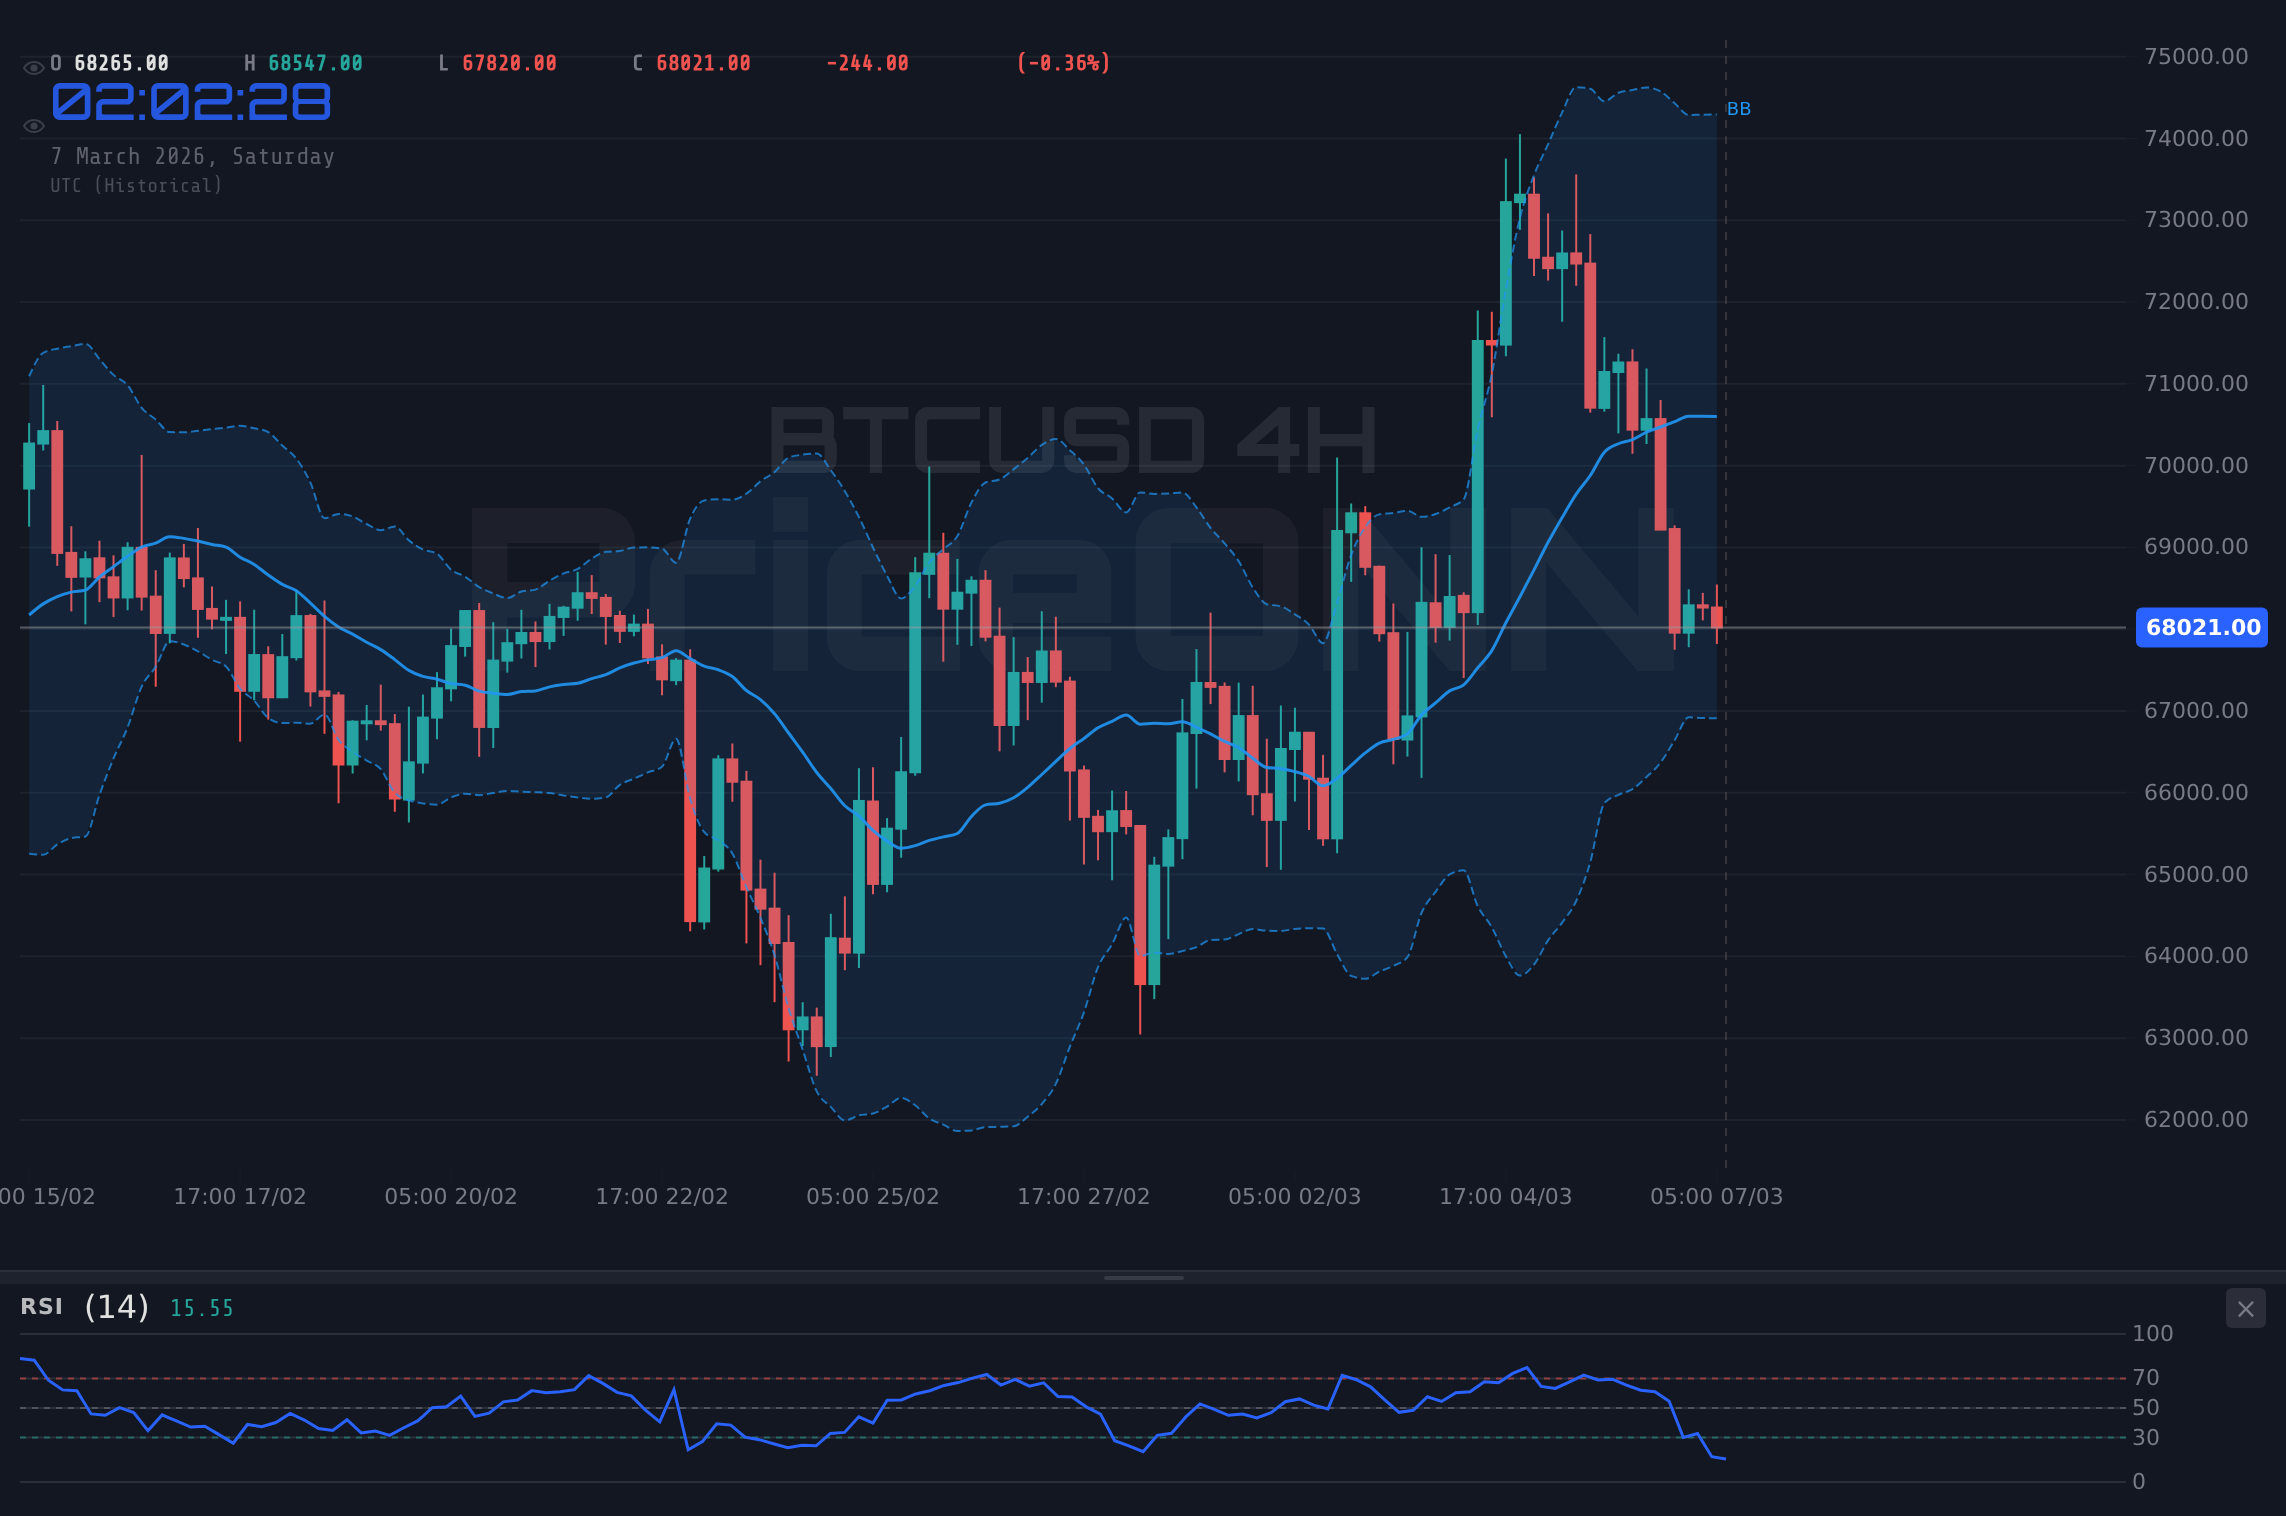
Technically, BTCUSD has broken below several key support levels this week. The initial support at $70,000 gave way relatively easily, followed by a breach of the $69,000 mark. The current price of $68,260 is now testing the next major support zone around $67,885.33 on the 4H chart. A daily close below this level would confirm the bearish breakdown and open the door for further downside.
On the upside, immediate resistance lies at $68,423.67 on the 1H chart. A successful break above this level would alleviate some of the bearish pressure and potentially trigger a short-term rally. However, the overall technical picture remains tilted to the downside, and any rallies are likely to be met with selling pressure.
Next Week's Expectations and Key Events
Looking ahead to next week, the key event to watch is the US jobs report scheduled for release today. The market is expecting a mixed bag of data, and any surprises could trigger significant volatility in BTCUSD. Traders should pay close attention to the Nonfarm Payrolls (NFP) number, the unemployment rate, and average hourly earnings. A stronger-than-expected jobs report would likely strengthen the dollar and put further pressure on Bitcoin, while a weaker-than-expected report could provide some relief.
The forex market is bracing for volatility as traders await the latest US Nonfarm Payrolls (NFP) data. According to forex news, USD/JPY is testing 158.00, EUR/USD under pressure.
From a technical perspective, the key levels to watch next week are $67,885.33 as support and $68,423.67 as resistance. A sustained break below the support level would likely trigger a move towards the next major support zone around $67,478.67. Conversely, a break above the resistance level could lead to a rally towards $69,000.
The 1H chart's RSI is at 31.51, indicating oversold conditions. However, with the ADX at 48.35 showing a strong downtrend and the Stochastic K at 45.32, there is a chance for a brief upward move, but the downtrend is likely to continue. The 4H chart's RSI is at 42.65, with the Stochastic K at 7.66, indicating oversold conditions, but a weak trend as indicated by the ADX at 18.74. There is a chance for a brief upward move, but the downtrend is likely to continue.
For those who have been tracking BTCUSD through the rate cycle, it's not surprising to see the cryptocurrency fluctuate as it does. As a trader, it's important to have a good understanding of the market's movements and trends. The ADX at 18.74 on the 4H chart is the real story here. A weak trend reading like this means the breakout hasn't committed yet - it could go either way.
Here's what the different trader types should watch for. Scalpers can look for short-term trading opportunities around the key support and resistance levels. Swing traders should wait for a confirmed break below $67,885.33 before entering short positions. Long-term investors should remain patient and accumulate Bitcoin at lower levels, as the overall uptrend is still intact.
Historically, when RSI reaches this zone on BTCUSD, the outcome has been a short-term bounce followed by a resumption of the downtrend. We will need to see a confirmed break above $68,423.67 to suggest otherwise.
Trade Recommendation: Watch Zone
Given the current technical picture and the looming economic data release, a clear trade setup hasn't yet emerged. A daily close above $68,423.67 would open the door for a potential long position, targeting $69,000. Manage your risk, wait for your setup-the market always gives a second chance.
Frequently Asked Questions: BTCUSD Analysis
Is BTCUSD a good buy right now?
At $68,260, BTCUSD is in a precarious position. While the 1H RSI suggests oversold conditions, the overall trend is bearish. Waiting for a confirmed break above $68,423.67 or a drop to the $67,478.67 support level before making a decision is recommended.
What is the BTCUSD price forecast for this week?
The BTCUSD price forecast for this week is highly dependent on the US jobs report. A stronger-than-expected report could push BTCUSD towards $67,478.67, while a weaker-than-expected report could trigger a rally towards $69,000. A 60% probability is assigned to the bearish scenario, with a 40% probability for the bullish scenario.
What are the key support and resistance levels for BTCUSD?
Key support levels for BTCUSD are $67,885.33 and $67,478.67. Key resistance levels are $68,423.67 and $69,000. These levels should be closely monitored for potential breakouts or breakdowns.
Why is BTCUSD moving today?
BTCUSD is moving today due to a combination of technical factors and anticipation of the US jobs report. The recent bearish breakdown has triggered a wave of selling pressure, and the market is now bracing for potential volatility following the data release.
Track markets in real-time
AI-powered analysis, technical indicators and real-time price data.
Join Our Telegram Channel
Breaking market news, AI analysis and trading signals instantly.
Join Channel