

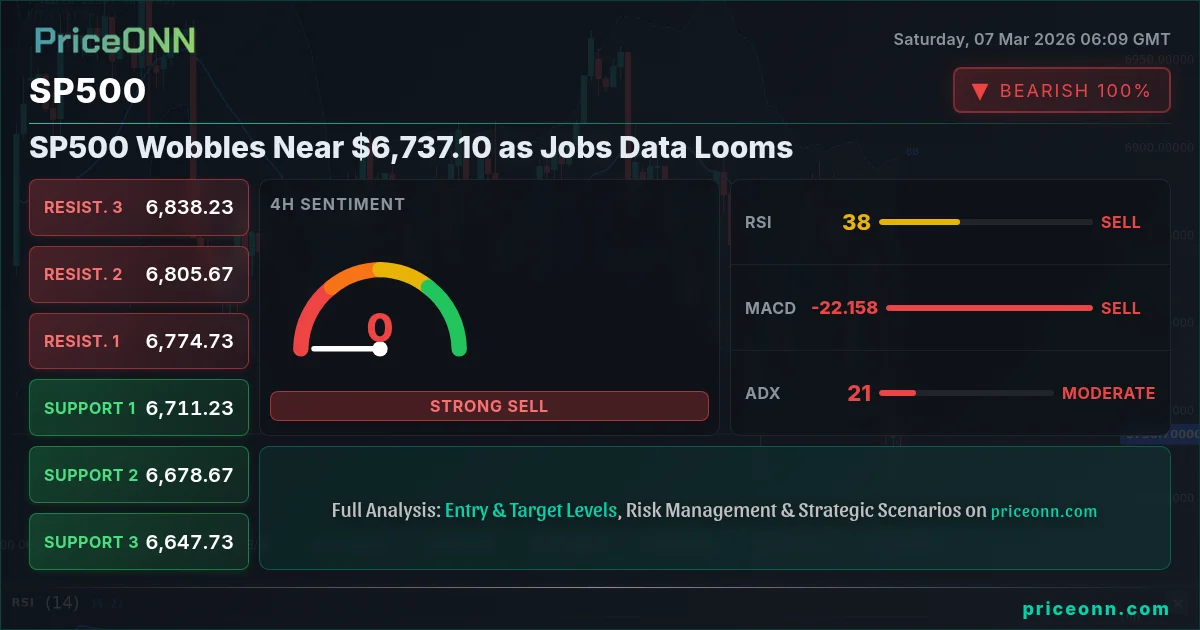
The SP500 finds itself at a critical juncture near $6,737.10, as bulls and bears grapple for control amid rising uncertainty. The index has shown increasing volatility, highlighting a tug-of-war between optimism and caution. The upcoming jobs data will likely be the deciding factor.
- RSI at 39.22 on the daily chart suggests further downside potential before oversold conditions are reached.
- Key support level at $6,702.13, a break below which could trigger a sharper sell-off.
- MACD histogram shows negative momentum, indicating bearish sentiment is strengthening.
- DXY strength is putting pressure on the SP500, reinforcing the risk-off environment.
The Bull Case: A Temporary Pullback?
The bullish argument rests on the belief that the recent dip is merely a healthy correction within a larger uptrend. Proponents point to the underlying strength of the US economy, which, despite recent concerns, continues to show resilience. They also emphasize the potential for a dovish pivot from the Federal Reserve, which could provide a significant boost to risk assets. Some analysts believe that any weakness in the SP500 represents a buying opportunity, particularly for long-term investors.
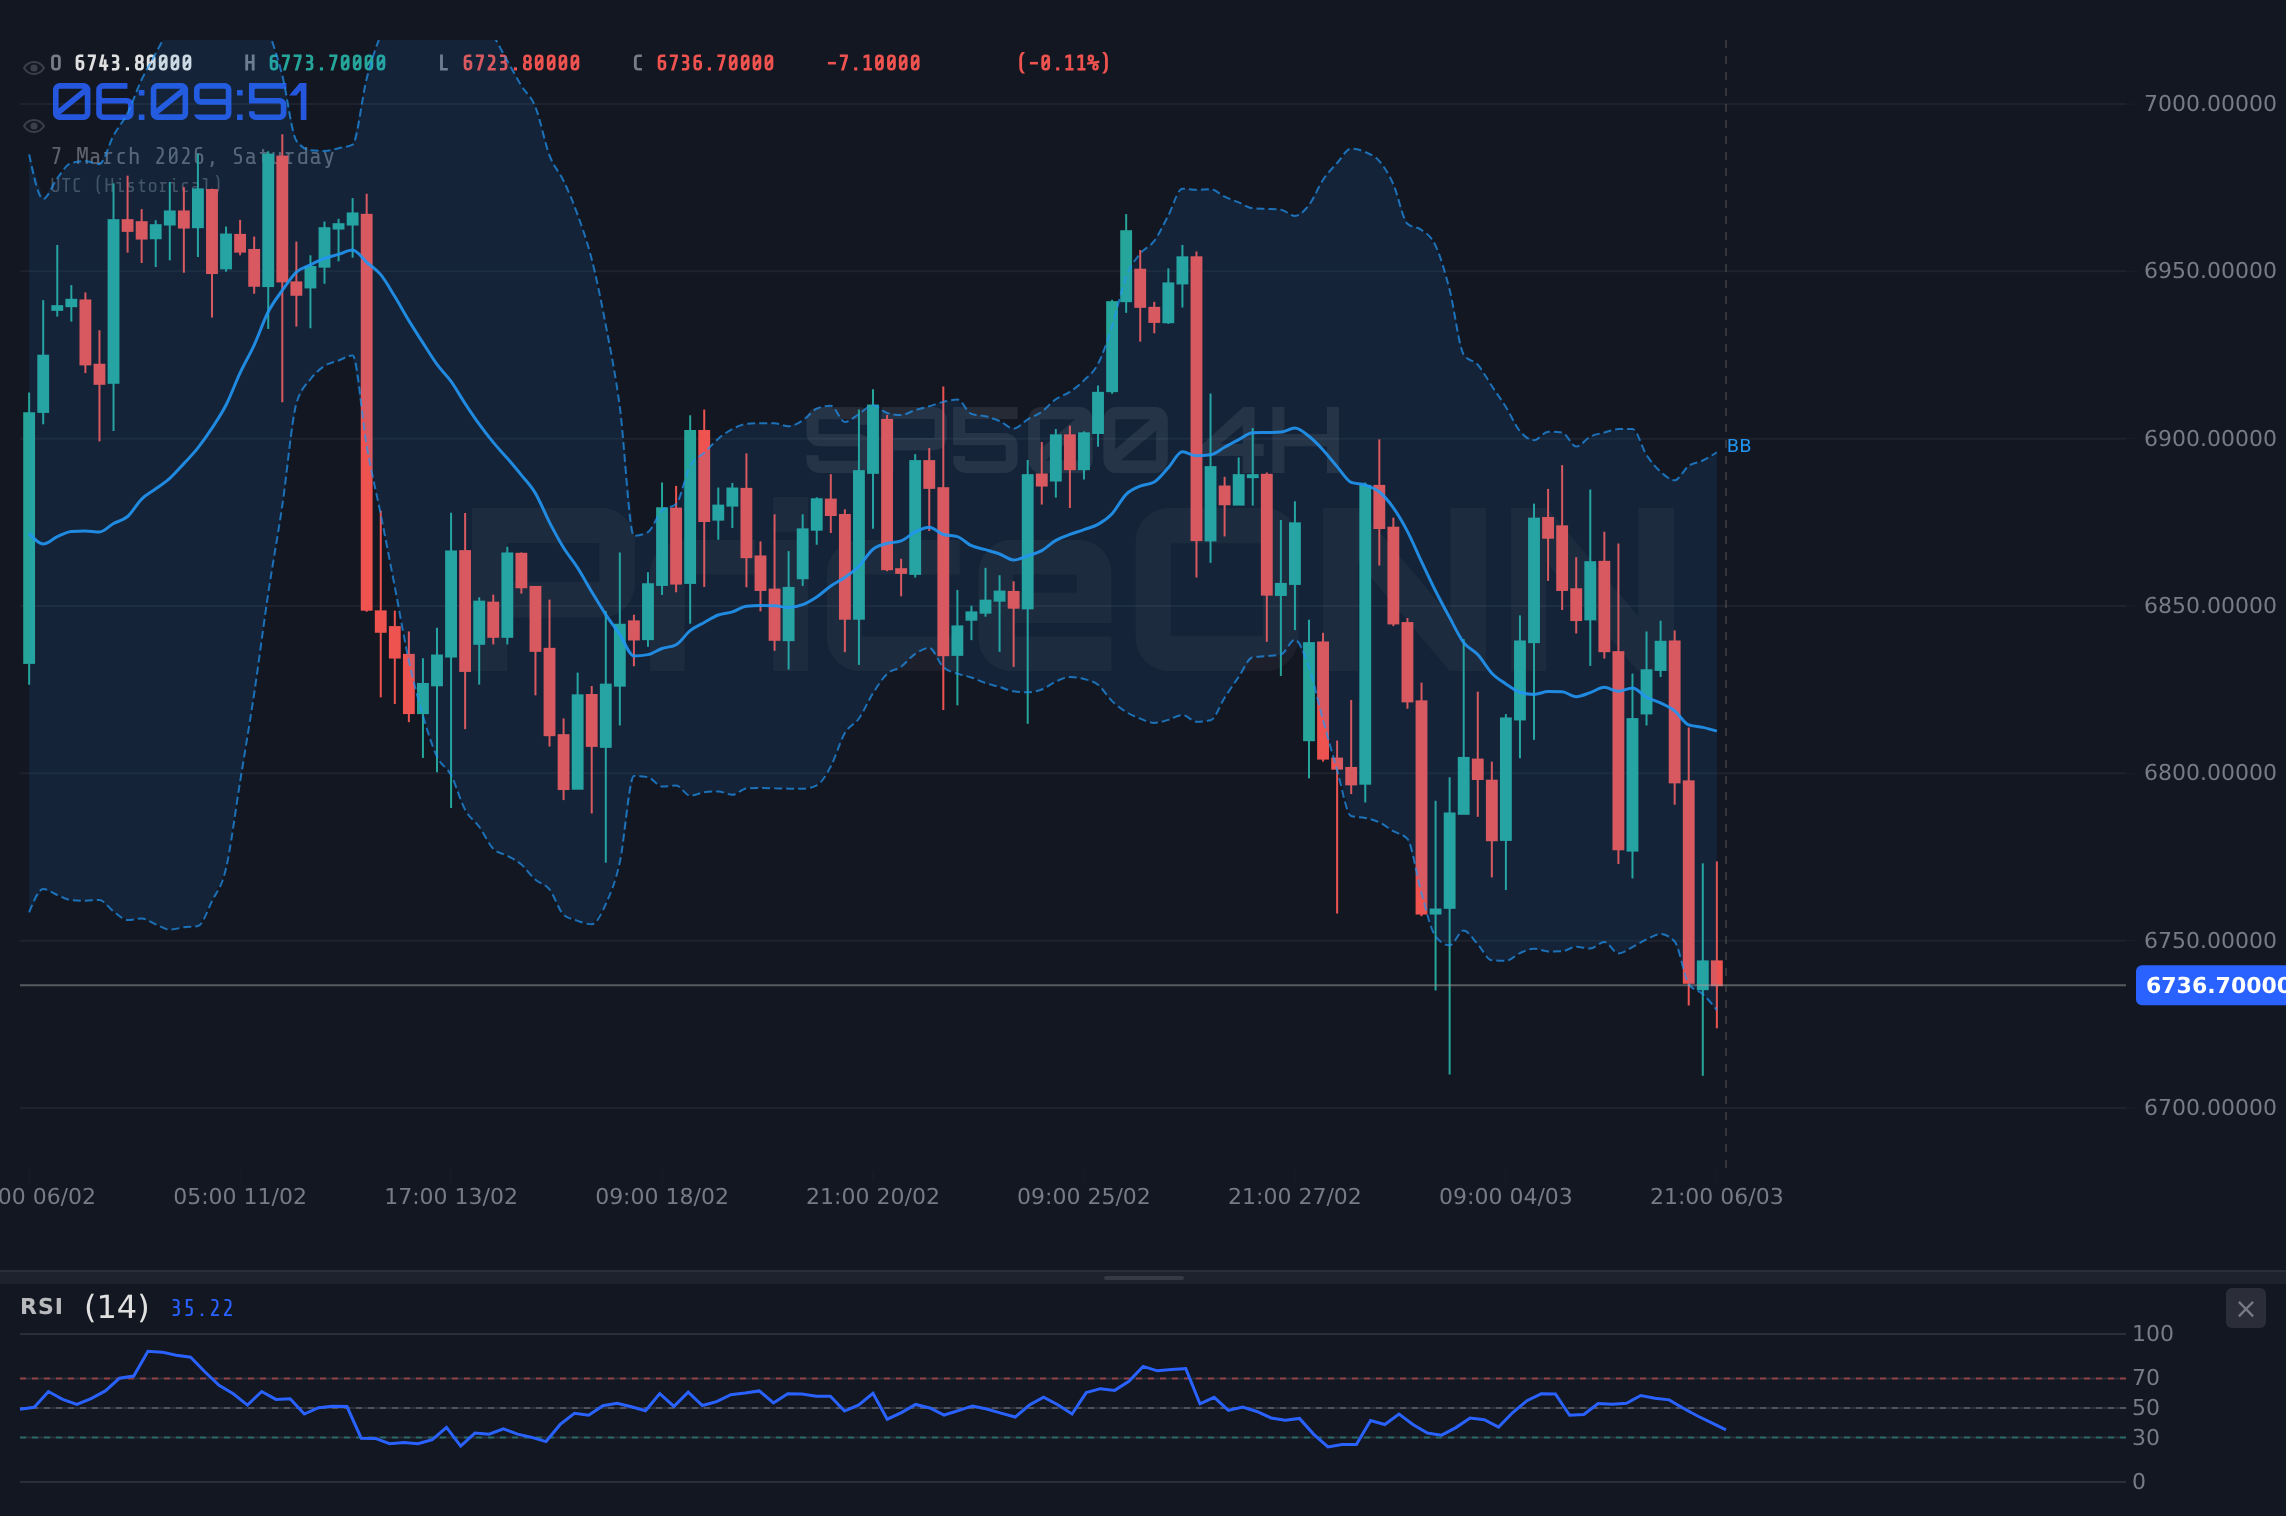
From a technical perspective, the hourly chart shows Stochastic K=32.42 crossing above D=26.71, which might suggest a short-term bounce. However, the overall trend remains bearish, and any rally is likely to be capped by resistance at $6,770.40. The 4H RSI is at 37.37, which is not yet oversold, so we may see more downside before any significant recovery.
The "sp500 earnings season impact" is always a key factor, and while earnings have been mixed, overall results haven't been disastrous enough to warrant a major correction. Some argue that the market has already priced in potential headwinds, and any positive surprises could trigger a swift rebound. The fact that the 1D RSI is at 39.22, which isn't yet oversold, leaves room for further downside before a reversal. The next few days will be critical to see if the bulls can defend key support levels.
The Bear Case: A Deeper Correction Looms
The bearish argument centers on concerns about slowing economic growth, persistent inflation, and the potential for further interest rate hikes from the Federal Reserve. The recent negative jobs report, as highlighted by PriceONN's weekly news, added fuel to these concerns. A weak labor market could signal a broader economic slowdown, which would inevitably weigh on corporate earnings and stock prices. The recent surge in oil prices, with WTI at $90.81, driven by Middle East tensions, further complicates the picture, raising concerns about inflationary pressures.
Technically, the SP500's daily chart paints a concerning picture. The index is trading below its 50-day moving average, and the MACD histogram shows negative momentum. The strong downtrend on the 1H chart, with ADX at 29.03, suggests the bears are firmly in control. Key support levels to watch include $6,707.43 and $6,677.47. A break below these levels could trigger a more significant sell-off towards $6,624.33.
Moreover, the DXY (Dollar Index) is currently at 98.71. The dollar index strengthens, putting pressure on the SP500. The SP500 trend analysis indicates a potential for further declines. The general sentiment for SP500 market sentiment is risk off, which would mean downward pressure for the SP500. The SP500 breakout scanner hasn't shown any bullish signals, further supporting the bear case.
Technicals as Tiebreaker: Which Way Will the SP500 Break?
Multi-timeframe analysis is key here. On the hourly chart, the SP500 shows some signs of a potential bounce, with Stochastic K at 32.42 crossing above D at 26.71. However, the overall trend remains bearish, and any rally is likely to be short-lived. The 4-hour chart is more clearly bearish, with the ADX at 19.71, indicating a weak trend, but the RSI at 37.37 suggests there's still room for further downside before oversold conditions are reached.
The daily chart offers a longer-term perspective. The RSI is at 39.22, indicating further downside potential. The MACD histogram is negative, confirming bearish momentum. Key support levels to watch include $6,707.43 and $6,677.47. A break below these levels would open the door for a test of $6,624.33. The SP500 weekly outlook will be heavily influenced by the upcoming jobs data.
As for AI technical analysis, it is important to note that the AI's data is from the past. Therefore, the current data is key. In the 1H chart, the RSI is at 35.86, which is neither overbought nor oversold. Given the current bearish pressure, if the RSI continues toward the oversold territory, it could indicate an opportunity for the bulls to step in. If the RSI fails to break below 30, it would signal a possible consolidation before another leg down.
Trade Recommendation: Watch Zone
Given the conflicting signals and the high level of uncertainty, our recommendation is to remain in a watch zone. A daily close above $6,770.40 would open the door for a retest of $6,843.67, while a break below $6,707.43 would likely lead to a test of $6,624.33. Until the market provides a clearer signal, patience is warranted.
Trading involves risk. The SP500 is currently exhibiting high volatility, and unexpected news events could trigger sharp price swings. Always manage your risk and use stop-loss orders to protect your capital.
Frequently Asked Questions: SP500 Analysis
Is SP500 a good buy right now?
At $6,737.10, the SP500 is in a precarious position. A buy signal would require a break and hold above $6,770.40, but until then, caution is advised.
What is the SP500 price forecast for this week?
The SP500 price forecast for this week is highly dependent on the upcoming jobs data. A strong report could send the index higher towards $6,843.67, while a weak report could trigger a sell-off towards $6,624.33.
What are the key support and resistance levels for SP500?
Key support levels for the SP500 are $6,707.43 and $6,677.47. Key resistance levels are $6,770.40 and $6,843.67.
Why is SP500 moving today?
The SP500 is moving lower today due to concerns about slowing economic growth and the potential for further interest rate hikes from the Federal Reserve, coupled with a negative initial reaction to the pending jobs data from last week.
According to Reuters, the Fed officials have shown concern about the job data to be released. The forex market awaits US Jobs Data, which will greatly affect the SP500.
Technical Outlook Summary
| Indicator | Value | Signal |
|---|---|---|
| RSI (14) | 39.22 | Neutral |
| MACD Histogram | Negative | Bearish |
| Stochastic | 38.12/51.81 | Bearish |
| ADX | 30.18 | Strong Trend |
| Bollinger | Lower Band | Watch |
Key Levels
Support Levels
Resistance Levels
Track markets in real-time
AI-powered analysis, technical indicators and real-time price data.
Join Our Telegram Channel
Breaking market news, AI analysis and trading signals instantly.
Join Channel