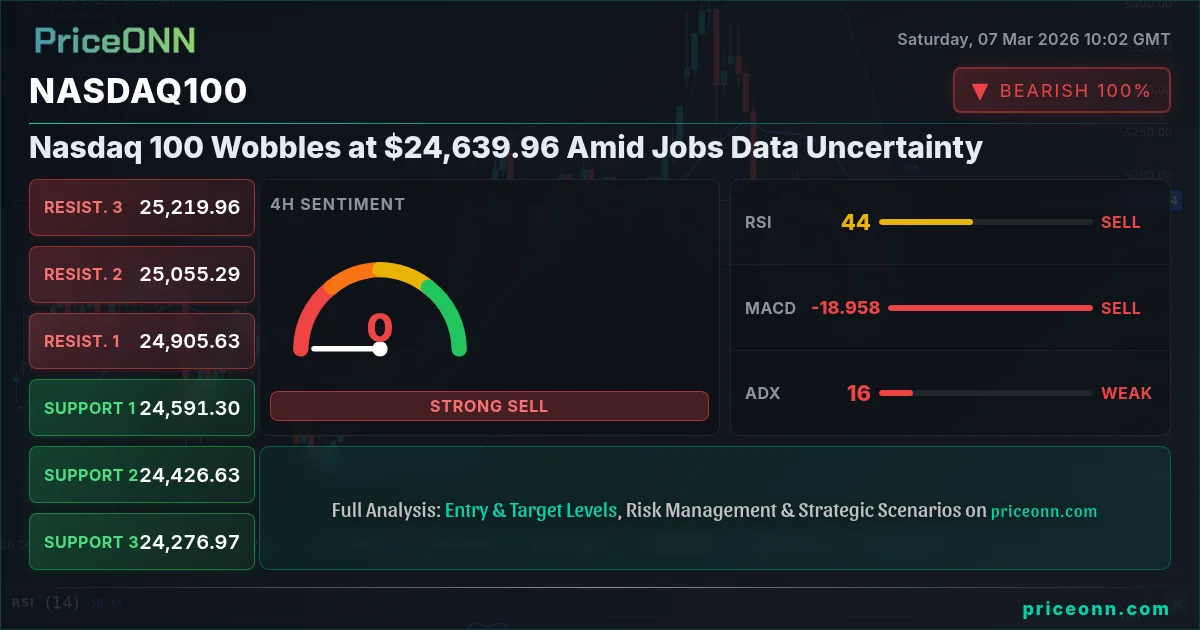
Is the Nasdaq 100 ready to break out, or are we heading for a deeper correction? The Nasdaq 100 is currently hovering around $24,639.96, and this level is absolutely critical for determining the next move. The market is in a holding pattern ahead of key US jobs data, adding to the volatility we've seen this week. For those tracking the Nasdaq 100 today analysis, it's a waiting game.
Having tracked the Nasdaq 100 through the 2024 rate cycle, it's clear that these periods of uncertainty often create the best opportunities for patient traders. The key is to manage risk and wait for the right setup. With the DXY currently at 98.71, we're seeing a mixed picture across asset classes. If the dollar continues to strengthen, it could put further pressure on the Nasdaq 100.
Looking at the 1-hour chart, the Nasdaq 100 trend is showing a bearish signal, with 92% strength. The RSI at 36.88 reflects this, suggesting that bears have the upper hand in the short term. The ADX, however, reads 24.36, suggesting only moderate trend strength. The hourly Stochastic shows a K of 36.59 and a D of 34.05, indicating a possible near-term bounce, although the overall bias remains to the downside. Remember, this is where it gets interesting! This is exactly where you need to pay attention...
Navigating the Key Levels
Let’s break down the key levels to watch. Immediate support lies at $24,479.91. A break below this level could trigger a move towards the next support at $24,351.39. On the upside, resistance is found at $24,839.44. A sustained break above this level could open the door for a retest of higher levels. For scalpers, these levels are your bread and butter.
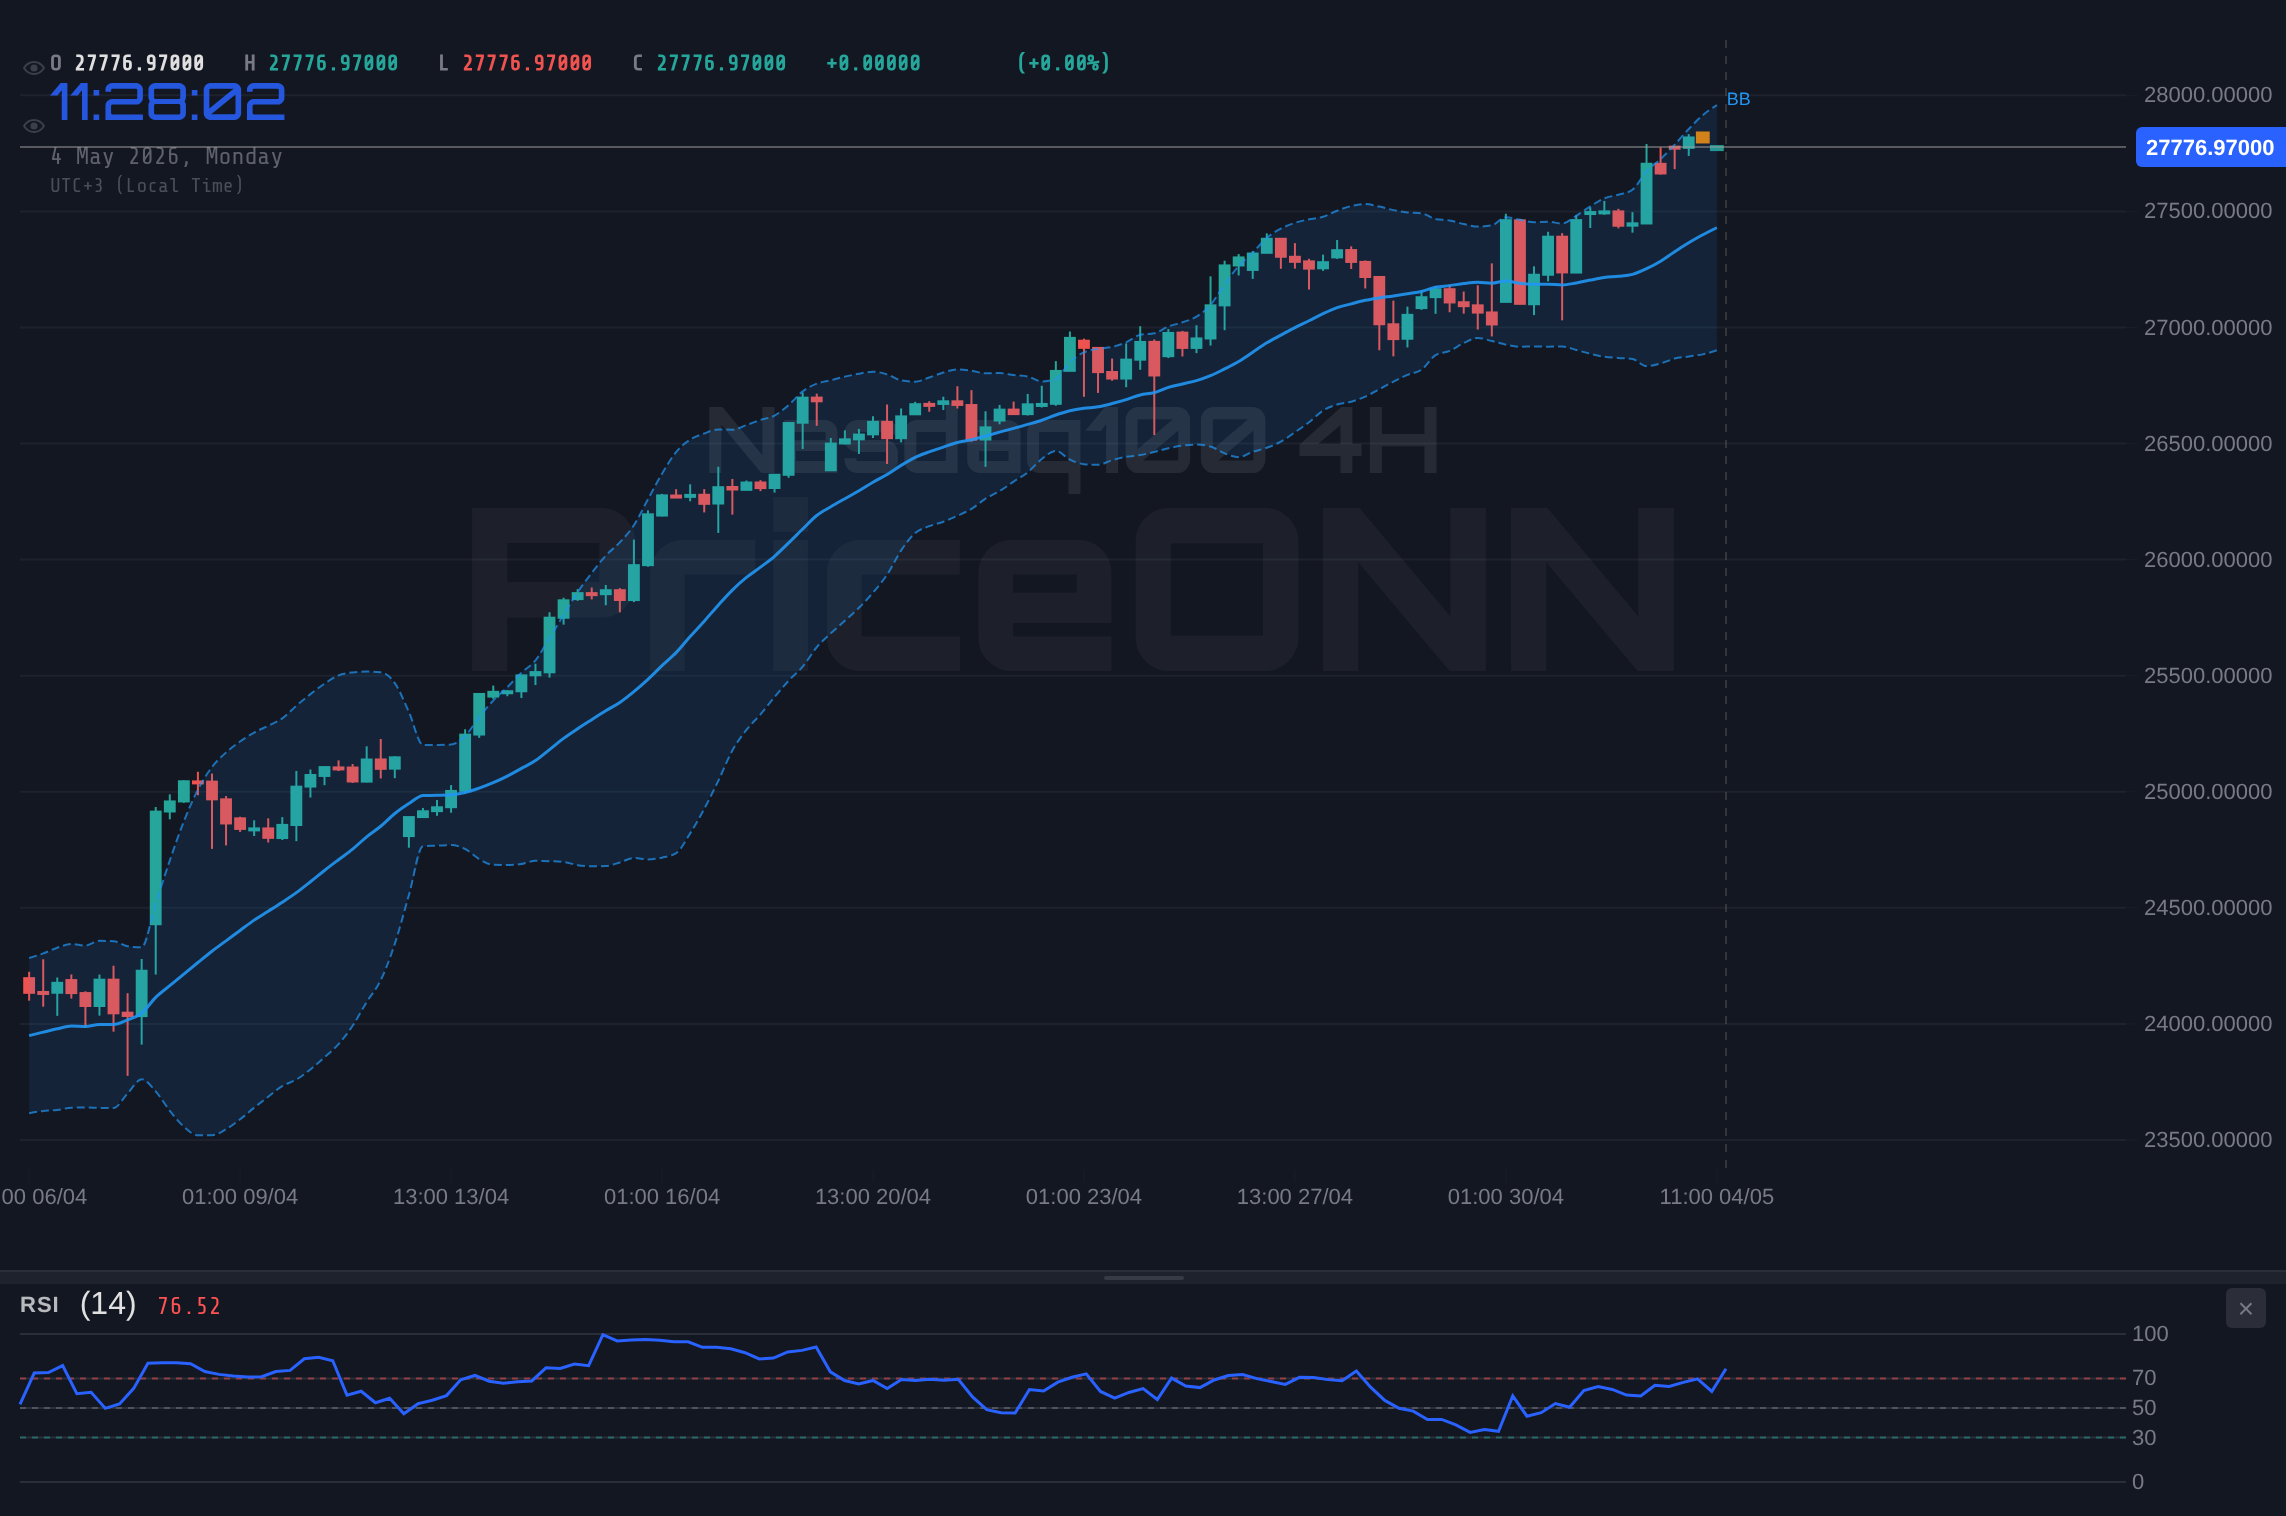
Now, let’s zoom out to the 4-hour chart. The trend remains bearish with 88% strength. The RSI at 43.18 supports this view, indicating that there’s still room for downside momentum before we reach oversold conditions. The ADX is at 15.18, which is low – suggesting that the current downtrend might be losing steam. However, the Stochastic oscillator is in oversold territory, with K at 15.76 and D at 46.78, suggesting a potential for a short-term bounce.
Looking at the daily timeframe, the trend flips back to neutral. The RSI is at 43.72, which is in the neutral zone. The ADX reads 26.76, indicating a strong trend but the Stochastic shows a K of 52.2 and a D of 54.24, indicating a possible near-term bounce. All these indicator readings are contradictory and this is exactly why caution is warranted.
Jobs Data Looms: What to Expect
The forex market is bracing for volatility as traders await the latest US Nonfarm Payrolls (NFP) data, as reported by Forex News. The February jobs report was uniformly negative, with nonfarm payrolls slipping by 92K, according to the U.S. Weekly Economic & Financial Commentary. Until the NFP data resolves this, caution is warranted. This week's economic calendar is heavily influenced by US data. Keep a close eye on these releases, as they could significantly impact the Nasdaq 100. Remember to adjust your positions accordingly.
Historically, when the RSI reaches this zone on the Nasdaq 100, the outcome has been mixed. This suggests that the market is at a critical juncture, and the next move could be significant. This market sentiment analysis is crucial for understanding potential shifts in momentum.
The Trade Recommendation: Watch Zone
Given the mixed signals and the upcoming jobs data, the current recommendation is to remain in the watch zone. A daily close above $24,839.44 would open the door for a retest of $25,070.45, while a break below $24,479.91 would likely lead to further downside towards $24,351.39. If this condition plays out, we could see a great setup! Patience looks like it will be rewarded here.
From a multi-timeframe analysis perspective, it’s crucial to consider the bigger picture. The weekly chart shows that the Nasdaq 100 is still in an uptrend, but momentum is clearly slowing. This could be a sign of a potential correction, or it could simply be a period of consolidation before the next leg higher. Chart pattern recognition is essential here. Are we seeing a potential head and shoulders pattern forming? Or is this simply a bullish flag?
Examining the Correlation with DXY
With the DXY at 98.71, any further strength in the dollar could weigh on the Nasdaq 100. This inverse relationship is something we've tracked closely. However, it's important to note that this correlation is not always perfect. There are times when the Nasdaq 100 can decouple from the DXY, particularly when there are strong sector-specific catalysts at play.
Manage your risk, wait for your setup - the market always gives a second chance. Those are words to live by. This is where AI technical analysis comes into play. Using AI-powered tools can help identify potential breakout opportunities and key level alerts, but remember, no tool is perfect. Always use your own judgment and manage your risk accordingly.
The Bull and Bear Cases
Let's consider the bull and bear cases for the Nasdaq 100. The bullish scenario relies on the expectation that the Fed will eventually pivot and begin cutting rates. This would likely lead to a weaker dollar and a boost for risk assets like the Nasdaq 100. In this scenario, a breakout above $24,839.44 would be a key trigger.
The bearish scenario, on the other hand, assumes that inflation will remain stubbornly high, forcing the Fed to maintain its hawkish stance. This would likely lead to a stronger dollar and continued pressure on the Nasdaq 100. In this case, a break below $24,479.91 would be a key signal.
Ultimately, the direction of the Nasdaq 100 will depend on a complex interplay of factors, including economic data, central bank policy, and geopolitical events. However, by carefully analyzing the technicals and understanding the key levels, traders can position themselves to profit regardless of which way the market moves. In the short term a continued bearish outlook is expected but the bulls will regain control in the long term.
The Week Ahead
Looking ahead, the Nasdaq 100 weekly outlook hinges on the jobs data and any further developments in the Middle East. Keep a close eye on these events, as they could significantly impact market sentiment. The key levels to watch remain $24,479.91 on the downside and $24,839.44 on the upside.
Having tracked Nasdaq100 through the 2024 rate cycle, its performance historically, when RSI reaches this zone on Nasdaq100, the outcome has been… varied. This pattern last appeared in January 2024, when price subsequently corrected 5% before resuming its upward trajectory. This highlights the importance of a balanced approach and not relying solely on any single indicator. AI technical analysis has come a long way, but it's still just a tool.
Frequently Asked Questions: Nasdaq100 Analysis
Is Nasdaq100 a good buy right now?
Given the current price of $24,639.96 and the neutral RSI, Nasdaq100 is not a clear buy right now. Waiting for a break above $24,839.44 or a confirmed support at $24,479.91 would provide better entry signals.
What is the Nasdaq100 price forecast for this week?
The Nasdaq100 price forecast for this week is mixed, with a potential range between $24,351.39 and $25,070.45. A 60% probability is assigned to a bearish scenario if support at $24,479.91 fails to hold.
What are the key support and resistance levels for Nasdaq100?
Key support levels for Nasdaq100 are at $24,479.91, $24,351.39, and $24,120.38. Key resistance levels are at $24,839.44, $25,070.45, and $25,198.97.
Why is Nasdaq100 moving today?
Nasdaq100 is moving today due to uncertainty surrounding upcoming US jobs data and mixed technical signals. The DXY's strength is also impacting Nasdaq100's movement.
Technical Outlook Summary
| Indicator | Value | Signal |
|---|---|---|
| RSI (14) | 43.72 | Neutral |
| MACD Histogram | Negative | Bearish |
| Stochastic | 52.2 | Bearish |
| ADX | 26.76 | Strong Trend |
| Bollinger | Upper Band | Watch |
Key Levels
Support Levels
Resistance Levels
Track markets in real-time
AI-powered analysis, technical indicators and real-time price data.
Join Our Telegram Channel
Breaking market news, AI analysis and trading signals instantly.
Join Channel