BRENT Oil Eyes $65.73 as Middle East Tensions Fuel Bullish Sentiment
BRENT oil is trading around $65.73 amid rising Middle East tensions, prompting Ecopetrol to consider output hikes. Will geopolitical risks sustain this bullish momentum?
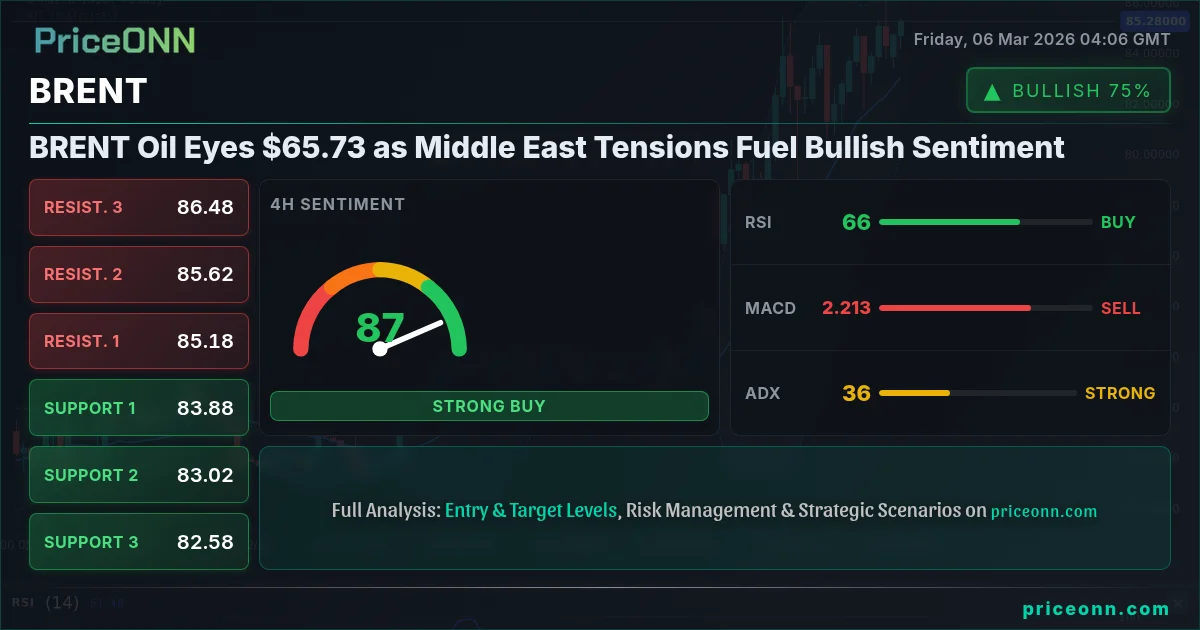
With BRENT oil currently trading at $65.73, market participants are closely monitoring escalating tensions in the Middle East, particularly involving Iran. These tensions are injecting a significant dose of volatility into the energy market, raising concerns about potential supply disruptions and prompting key producers like Ecopetrol to consider boosting output. The question now is whether these geopolitical risks will continue to buoy prices and sustain the bullish sentiment surrounding BRENT oil.
- RSI at 71.16 on the 1H chart indicates overbought conditions, suggesting a potential pullback in the short term.
- Key resistance level to watch is $65.42, a break above which could signal further upside.
- The 1D MACD histogram shows positive momentum, supporting a bullish outlook despite short-term overbought signals.
- Geopolitical risks in the Middle East and potential supply disruptions are major drivers of BRENT's correlation with DXY.
BRENT Oil Bullish Bearish Signals Today: Navigating Middle East Uncertainty
The current landscape for BRENT oil is painted with a mix of bullish and bearish signals, demanding a careful evaluation of both technical and fundamental factors. The price of $65.73 reflects a delicate balance between rising geopolitical risks and potential supply adjustments. A deeper dive into the technical indicators reveals a nuanced picture, while recent news events add another layer of complexity to the overall outlook. This analysis aims to provide a comprehensive understanding of the forces shaping BRENT's price action and offer insights into potential trading strategies.
Analyzing the Technical Indicators: A Multi-Timeframe Perspective
A multi-timeframe analysis reveals a complex picture for BRENT oil. On the 1-hour chart, the RSI stands at 71.16, signaling overbought conditions. This suggests that the recent upward momentum may be unsustainable in the very short term, potentially leading to a pullback. However, the MACD on the same timeframe shows positive momentum, indicating that buyers are still present in the market. The Stochastic, with K=90.49 and D=81.87, also confirms overbought territory. The ADX, however, is at a weak 19.03, suggesting the trend is not strong on the hourly timeframe. This conflicting set of signals calls for caution among short-term traders.
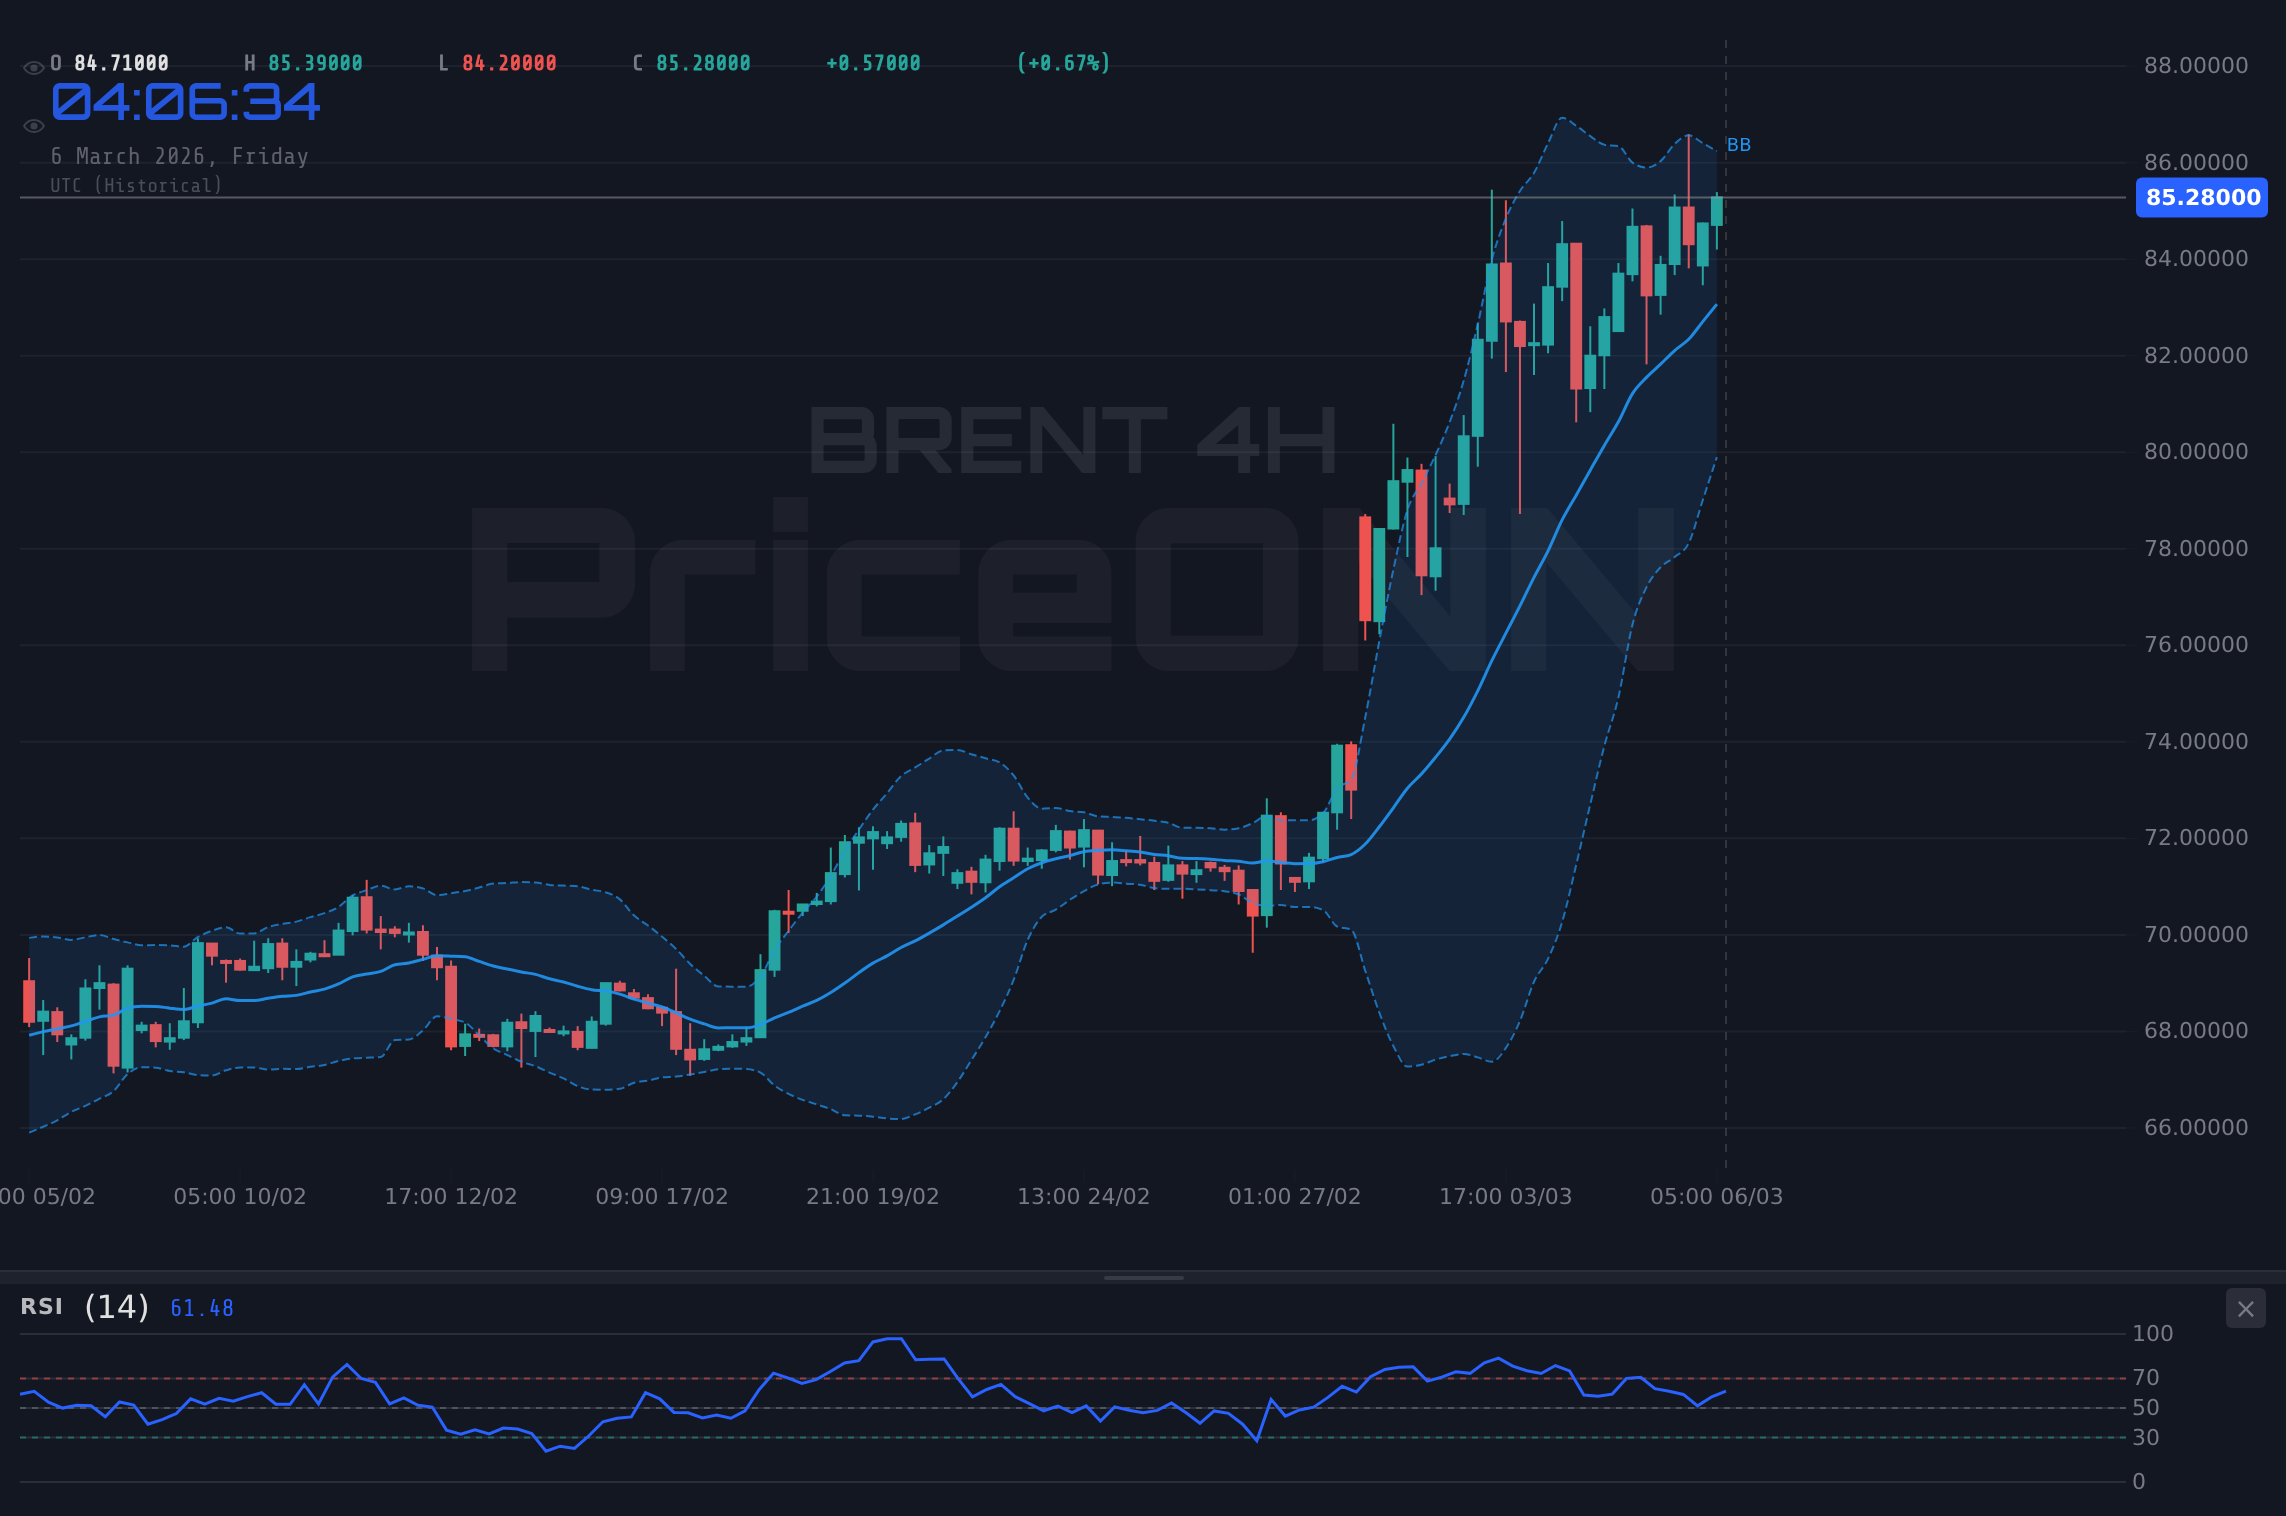
Stepping up to the 4-hour timeframe, a more bullish picture emerges. The RSI is at 62.33, still in neutral territory but trending upward. The MACD maintains its positive momentum, reinforcing the bullish sentiment. The Stochastic, with K=68.29 and D=44.75, further supports this upward trajectory. The ADX is at 13.59, suggesting a weak trend. This suggests that the bullish move has some legs, but it is not particularly strong. This timeframe is leaning towards bullishness, but the weak trend tempers expectations.
Looking at the daily chart, the RSI is at 59.99, also in neutral territory. The MACD is positive, and the Stochastic is at 54.52, D=58.52, indicating a recent bearish crossover. The ADX reads 28.64, indicating a strong trend. This timeframe shows a bullish trend that is losing momentum, but the trend is still strong. This long-term perspective reinforces the overall bullish outlook, although it also suggests that the market may be due for a period of consolidation or correction.
The convergence of these technical indicators across multiple timeframes suggests that while BRENT oil may experience short-term pullbacks due to overbought conditions, the underlying trend remains bullish. Traders should, therefore, exercise caution in the short term but maintain a positive outlook for the medium to long term.
Key Price Levels: Support and Resistance Zones
Identifying key support and resistance levels is crucial for developing a sound trading strategy. Based on the current market data, immediate support on the 1-hour timeframe lies at $65.20, followed by $65.10 and $64.99. These levels could act as potential buying opportunities if the price experiences a short-term pullback. On the resistance side, immediate resistance is found at $65.41, with subsequent levels at $65.52 and $65.62. A decisive break above these resistance levels could pave the way for further upside.
On the 4-hour chart, stronger support levels are identified at $64.50, $64.20, and $63.99. These levels represent more significant areas of demand and could provide robust support in case of a deeper correction. Key resistance levels on this timeframe are $65.01, $65.22, and $65.52. Breaking above these levels would confirm the bullish trend and open the door for a test of higher targets.
The daily chart reveals even more significant support and resistance zones. Major support lies at $63.61, followed by $62.74 and $61.80. These levels represent long-term areas of demand and could provide substantial support in the event of a major market downturn. Key resistance levels on the daily chart are $65.42, $66.36, and $67.23. A sustained break above these levels would signal a strong bullish trend and potentially lead to a significant rally.
Geopolitical Risks: The Middle East Factor
Escalating tensions in the Middle East are a major driver of the current bullish sentiment surrounding BRENT oil. Recent news reports indicate heightened concerns about potential supply disruptions, particularly in key oil-producing regions. The news that LNG shipping rates have exploded 650% amid Middle East tensions underscores the severity of the situation. This has prompted Ecopetrol to consider output hikes to stabilize markets. These factors are creating a perfect storm for higher oil prices.
The market's sensitivity to geopolitical risks is further amplified by the ongoing conflict in Ukraine and the potential for further disruptions to global energy supplies. These factors, combined with the robust demand for oil from emerging economies, are creating a supply-demand imbalance that is likely to support higher prices in the medium term. As the USD gains ground due to these geopolitical tensions, it is important to keep an eye on how these events correlate to the price of crude oil.
Economic Calendar and Market Sentiment
The economic calendar also plays a crucial role in shaping market sentiment and influencing BRENT oil prices. Market participants are closely monitoring key economic data releases, such as inflation figures, employment numbers, and GDP growth rates. The recent USD data release, though past, is still being factored into the current price. These data points provide insights into the overall health of the global economy and can impact the demand for oil. The key to understanding market sentiment is to weigh the information carefully.
Upcoming economic data releases will be closely watched for further clues about the direction of the global economy. Any signs of weakness in economic growth could dampen demand for oil and put downward pressure on prices. Conversely, strong economic data could reinforce the bullish sentiment and support higher prices. Traders should, therefore, stay informed about the latest economic developments and adjust their trading strategies accordingly.
Trading Recommendation: Navigating the Uncertainty
Given the conflicting signals and the heightened uncertainty surrounding BRENT oil, a conservative approach is warranted. While the overall trend appears bullish, short-term pullbacks are possible. Therefore, a WATCH_ZONE strategy is recommended. A daily close above $65.42 would open the door for a test of the next resistance level at $65.52. The market will likely remain volatile in the short term due to geopolitical factors.
Frequently Asked Questions: BRENT Analysis
Is BRENT a good buy right now?
BRENT presents a mixed picture. While the 1D trend is bullish, the 1H RSI at 71.16 indicates overbought conditions. A daily close above $65.42 might signal a buying opportunity, but caution is advised.
What is the BRENT price forecast for this week?
The BRENT price forecast hinges on Middle East tensions. A sustained break above $65.42 could target $66.36, while failure to hold support at $65.20 could lead to a test of $63.61. Probability is approximately 55% bullish.
What are the key support and resistance levels for BRENT?
Key support levels for BRENT are $65.20, $65.10, and $64.99 on the 1H chart. Resistance levels to watch are $65.41, $65.52, and $65.62. These levels represent potential areas of buying and selling pressure.
Why is BRENT moving today?
BRENT is moving today primarily due to escalating tensions in the Middle East, particularly involving Iran, which are raising concerns about potential supply disruptions. These geopolitical factors are the main drivers.
The Outlook: Navigating Volatility and Seeking Opportunity
Looking ahead, BRENT oil prices are likely to remain highly sensitive to geopolitical developments and economic data releases. Traders should closely monitor news headlines and economic indicators to anticipate potential market movements. The key to success in this environment is to remain flexible, manage risk effectively, and be prepared to adapt to changing market conditions. The overall trend seems bullish, but it is prudent to be wary.
While volatility creates challenges, it also presents opportunities for astute traders. By carefully analyzing technical indicators, monitoring key price levels, and staying informed about fundamental drivers, investors can identify potential trading setups and capitalize on market fluctuations. The key is to remain patient, disciplined, and focused on long-term goals. With disciplined risk management, these choppy waters can be navigated safely.
Technical Outlook Summary
| Indicator | Value | Signal |
|---|---|---|
| RSI (14) | 59.99 | Neutral |
| MACD Histogram | Positive | Bullish |
| Stochastic | 54.52/58.52 | Bearish |
| ADX | 28.64 | Strong |
| Bollinger | Upper Band | Watch |
Track markets in real-time
AI-powered analysis, technical indicators and real-time price data.
Join Our Telegram Channel
Breaking market news, AI analysis and trading signals instantly.
Join Channel