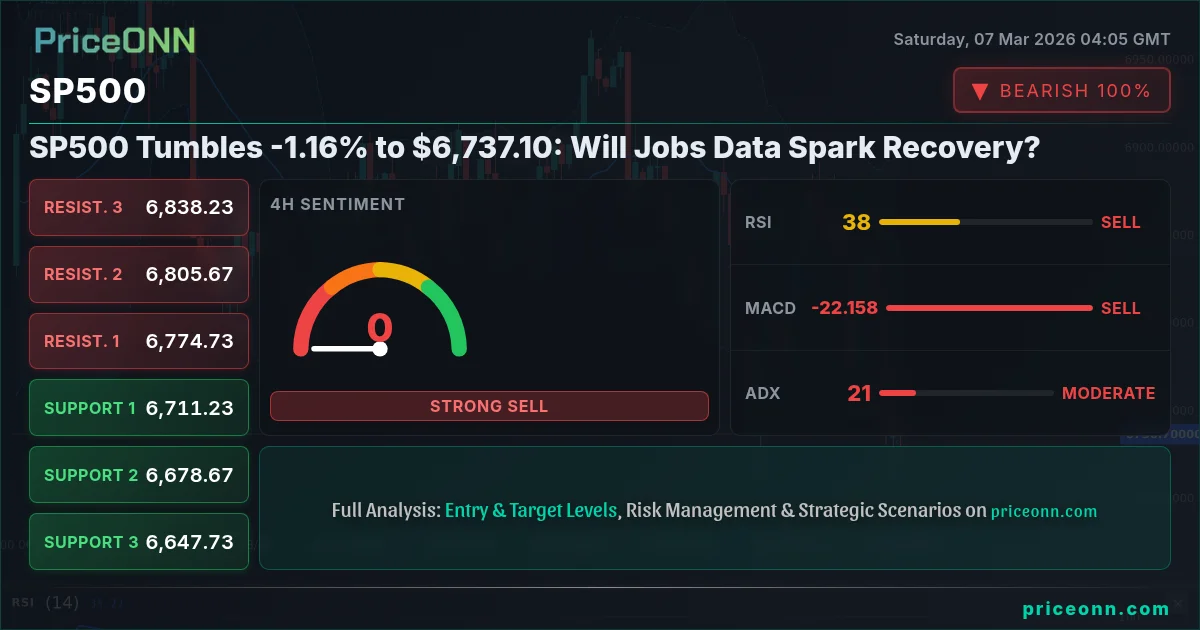
Have you ever felt like the market is a battlefield, with bulls and bears constantly vying for control? That's precisely the tension we're seeing now in the SP500, which closed last Friday at $6,737.10, down -1.16% for the day. The question on every trader's mind is: why is sp500 falling today, and can it recover? The struggle is real, and understanding the forces at play is crucial for navigating these choppy waters.
- SP500 closed at $6,737.10, a -1.16% drop, signaling potential bearish pressure.
- Key support level to watch is $6,707.43; a break below could trigger further declines.
- RSI at 37.37 on the 4-hour chart indicates oversold conditions, but not yet a strong buy signal.
- Upcoming jobs data next week will be a critical catalyst, influencing Fed policy and market sentiment.
The Bullish Case for SP500: A Rebound on the Horizon?
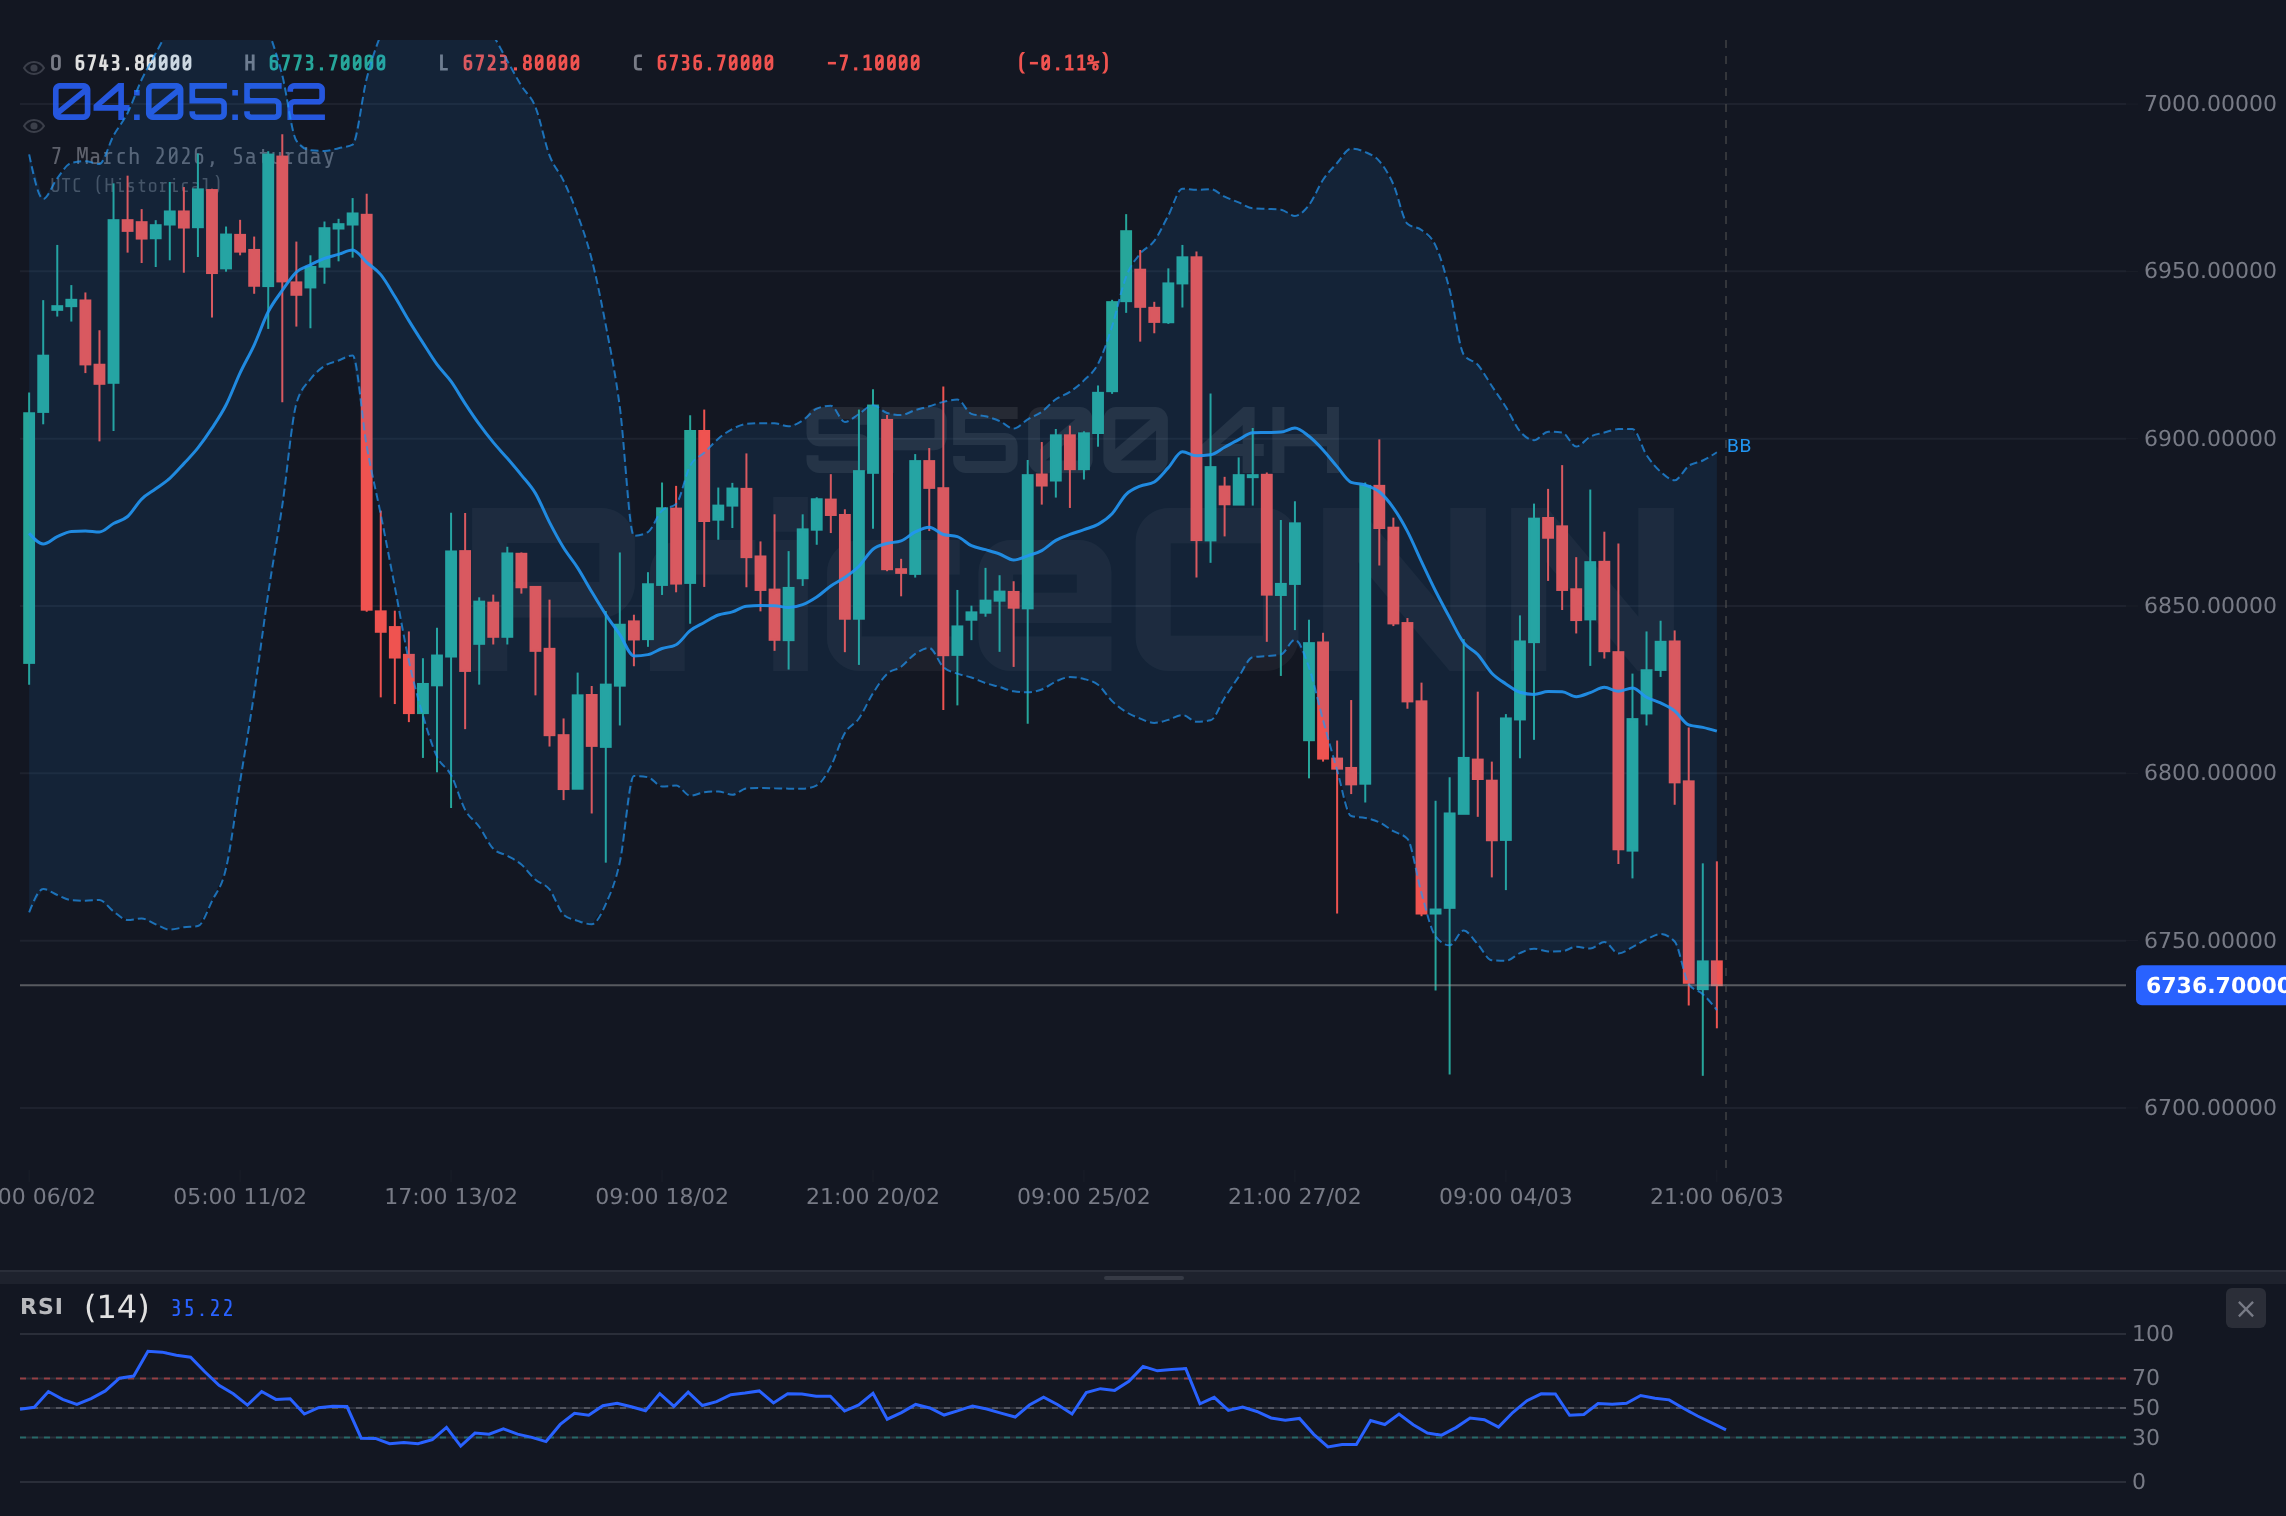
Let's start by examining the bullish arguments. Despite the recent dip, there are reasons to believe the SP500 could stage a recovery. One key factor is the Relative Strength Index (RSI) on the 4-hour chart, which sits at 37.37. While not yet deeply oversold, it suggests that the selling pressure may be easing. Historically, when the RSI approaches these levels, we often see a bounce as buyers step in to take advantage of discounted prices. Couple this with the Stochastic oscillator at 14.45 on the 4H chart, signaling oversold conditions, and the potential for a short-term bounce increases. Scalpers could look for quick long opportunities if the SP500 can hold above the immediate support at $6,739.5. Furthermore, the daily chart shows the SP500 holding above the 6,759.17 level, which is key to watch for a bounce.
Another bullish factor stems from the overall economic picture. While the recent jobs report may have been disappointing, it's crucial to remember that one data point doesn't make a trend. The US economy has shown remarkable resilience, and there's still a strong underlying growth narrative. If next week's jobs data is better than expected, it could reignite bullish sentiment and push the SP500 higher. Long-term investors may see this dip as a buying opportunity, adding to their positions at lower prices. The key for the bulls is to defend the $6,707.43 level and push the price back above the $6,770.4 resistance. A successful breakout above this resistance could open the door for a move towards the $6,800 level and beyond. From a historical perspective, we've seen similar pullbacks in the SP500 followed by strong rallies, demonstrating the market's ability to recover.
The energy sector, with WTI crude oil surging 15.21% to $90.81, also presents a mixed bag. While rising oil prices can fuel inflation concerns, they also reflect strong economic activity and demand. For swing traders, monitoring the energy sector's performance alongside the SP500 could provide valuable insights into the overall market direction. Moreover, the fact that the DXY (Dollar Index) is showing mixed signals, currently at 98.71 with a slight downward bias on the hourly chart, suggests that the SP500 isn't facing overwhelming pressure from a strengthening dollar. Therefore, the bulls have a fighting chance if they can capitalize on these factors.
The Bearish Case for SP500: A Deeper Correction Ahead?
Now, let's turn to the bear side of the argument. The -1.16% drop to $6,737.10 is not just a blip on the radar; it could be the start of a deeper correction. One of the most concerning signals is the Moving Average Convergence Divergence (MACD) on the daily chart, which shows negative momentum. This suggests that the selling pressure is not just a short-term phenomenon but could persist for a longer period. Furthermore, the daily ADX (Average Directional Index) at 30.18 indicates a strong downward trend, implying that the bears are firmly in control. A break below the $6,707.43 support could trigger a cascade of selling, pushing the SP500 towards the next support level at $6,677.47 and potentially lower. Swing traders should be cautious about initiating long positions until the bearish momentum subsides. The fact that Nasdaq100 is down -1.31% shows that the weakness is broad based, not just isolated to one sector.
From a fundamental perspective, the disappointing jobs report raises concerns about the health of the US economy. While the unemployment rate remains low, a slowdown in job creation could signal a weakening labor market, which could weigh on consumer spending and economic growth. This is why the market is focused on the upcoming jobs data. If the data continues to disappoint, it could reinforce the bearish narrative and lead to further declines in the SP500. News outlets have been reporting on the potential impact of rising oil prices on central bank policy. Crude Oil Near $85: Will Rising Prices Force Central Bank Action? The potential for central banks to tighten monetary policy in response to rising inflation could further dampen risk appetite and pressure the SP500.
Furthermore, the 1-hour chart shows a strong downward trend, with the SP500 consistently making lower highs and lower lows. The RSI at 35.86 on the hourly chart, while approaching oversold territory, is not yet at a level that would typically trigger a strong reversal. Scalpers should be looking for short opportunities on any rallies, as the path of least resistance appears to be to the downside. The overall market sentiment appears to be shifting towards caution, with investors becoming increasingly concerned about the potential for a recession. The weakness in the DowJones30, down -0.83%, further supports this view.
Technicals as the Tiebreaker: What Happens Next?
So, which scenario is more likely? The technical indicators paint a mixed picture, making it difficult to definitively call the market direction. On the one hand, the oversold conditions on the short-term charts suggest that a bounce is possible. On the other hand, the negative momentum and strong downward trend on the daily charts indicate that the bears are in control. The Stochastic K at 32.42 on the hourly chart signals a potential upside move. The key level to watch is $6,707.43. A sustained break below this level would likely confirm the bearish scenario and open the door for further declines. Conversely, a successful defense of this level and a breakout above the $6,770.4 resistance would favor the bullish scenario.
For those employing chart pattern recognition, the SP500 appears to be forming a descending triangle on the 4-hour chart, which is typically a bearish pattern. If the price breaks below the lower trendline of the triangle, it could trigger a sharp sell-off. Multi-timeframe analysis reveals that while the short-term charts show oversold conditions, the longer-term charts still point to downside risk. Price action analysis suggests that the bears are aggressively defending the resistance levels, making it difficult for the bulls to gain any traction. Market sentiment analysis indicates that fear is starting to creep into the market, which could further exacerbate the selling pressure. The volatility analysis suggests that we could see increased price swings in the coming days, making it crucial to manage risk carefully. If this continues, we can expect a further move towards the bottom of the current range.
Traders should also pay close attention to the DXY (Dollar Index), which is currently at 98.71. A strengthening dollar could put further pressure on the SP500, while a weakening dollar could provide some relief. The correlation between the SP500 and bond yields is also worth monitoring. Rising bond yields could signal concerns about inflation and economic growth, which could weigh on the SP500. The upcoming economic data releases, particularly the jobs data, will be critical in determining the market's direction. If the data is strong, it could support the bullish scenario. If the data is weak, it could reinforce the bearish narrative. The market awaits US Jobs Data as USD/JPY Eyes 158.00, EUR/USD Under Pressure. Therefore, patience and discipline are key in this environment. Wait for clear signals and manage your risk carefully.
A Word from Zeynep Arslan
As a trading psychologist, I understand the emotional challenges that traders face during periods of market uncertainty. It's easy to get caught up in the fear and greed, but it's crucial to remain calm and rational. Remember that markets are cyclical, and every downturn presents opportunities for those who are prepared. Don't let your emotions dictate your trading decisions. Stick to your plan, manage your risk, and stay focused on your long-term goals. We all know that there will be times when the market tests our resolve. It's during these times that our mental fortitude is most important. Remember, successful trading is 80% psychology and 20% strategy. Focus on developing your mental game, and you'll be well-equipped to navigate any market conditions.
Frequently Asked Questions: SP500 Analysis
Is SP500 a good buy right now?
Given the current downtrend and mixed signals, SP500 isn't a clear buy right now. A break above $6,770.4 might signal a bullish opportunity, but caution is advised. Wait for confirmation before entering long positions.
What is the SP500 price forecast for this week?
The SP500 price forecast for this week is highly dependent on the upcoming jobs data. A positive surprise could push the SP500 towards $6,800, while a negative surprise could lead to a test of the $6,707.43 support.
What are the key support and resistance levels for SP500?
Key support levels for SP500 are $6,707.43, $6,677.47, and $6,624.33. Key resistance levels are $6,770.4, $6,787.5, and $6,801.3. These levels are crucial for identifying potential entry and exit points.
Why is SP500 moving today?
SP500 is moving today due to a combination of factors, including disappointing jobs data and rising oil prices. These factors have dampened market sentiment and increased concerns about economic growth.
Key Levels
Support Levels
Resistance Levels
Given the current market conditions and the conflicting signals from the technical indicators, the trade recommendation is WATCH_ZONE. A daily close above $6,770.4 would open the door for a bullish setup, targeting $6,800 and potentially higher. Conversely, a break below $6,707.43 would signal a bearish setup, targeting $6,677.47 and potentially lower. Until a clear breakout or breakdown occurs, it's best to remain on the sidelines and wait for confirmation.
Track markets in real-time
AI-powered analysis, technical indicators and real-time price data.
Join Our Telegram Channel
Breaking market news, AI analysis and trading signals instantly.
Join Channel