BRENT Bullish: Mideast Risk Fuels Oil Surge to $65.73
BRENT crude surges to $65.73 amid escalating Middle East tensions. Japan's refiners request strategic oil release, adding upward pressure. Is this the start of a sustained rally?
Escalating tensions in the Middle East, coupled with Japan's refiners urging their government to release strategic oil reserves, have propelled BRENT crude to $65.73. The disruptions in the Strait of Hormuz, a critical chokepoint for global energy supply, are creating heightened volatility, leaving traders wondering if this is the beginning of a sustained surge.
- BRENT crude surged to $65.73 driven by Middle East tensions and potential supply disruptions.
- Key support level to watch at $65.20, a break below could signal a reversal.
- RSI at 71.16 on the 1H chart indicates overbought conditions, suggesting a possible pullback.
- DXY strength continues to exert downward pressure on commodity prices, creating a tug-of-war.
The market's immediate reaction is a reflection of the precarious geopolitical landscape. The US Senate's decision regarding military action in the region, as reported by Forex News, adds another layer of uncertainty. All eyes are on potential disruptions in the Strait of Hormuz, which could significantly impact global energy supplies.
Amid these concerns, Japan's refiners are requesting strategic oil releases. This action underscores the immediate pressure on supply chains and further validates the current bullish momentum. However, the rising US Dollar index (DXY), currently at 98.69, presents a counter-narrative. Historically, a strengthening dollar exerts downward pressure on commodity prices, including BRENT crude.
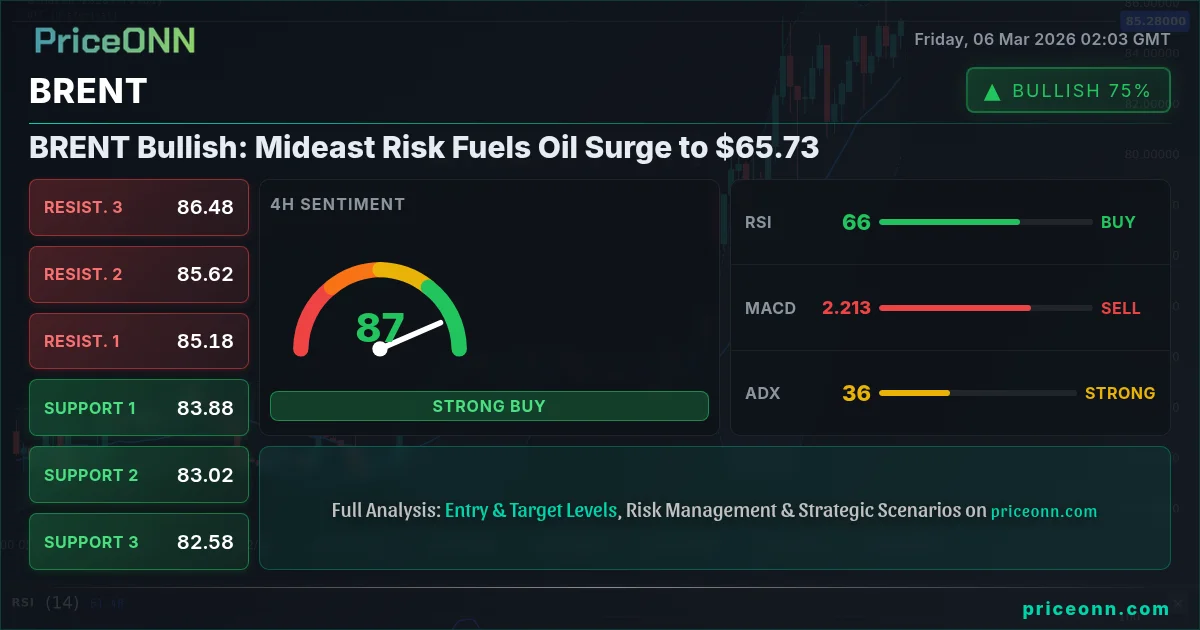
From a technical standpoint, the 1-hour chart reveals that BRENT is trading in neutral trend. The Relative Strength Index (RSI) on the 1H timeframe is at 71.16, indicating overbought conditions. This suggests that the current rally might be due for a short-term pullback. The MACD shows positive momentum above the signal line, but the Stochastic Oscillator is showing overbought at K=90.49 and D=81.87, further suggesting a possible short-term correction. The ADX is weak at 19.03, indicating a weak trend.
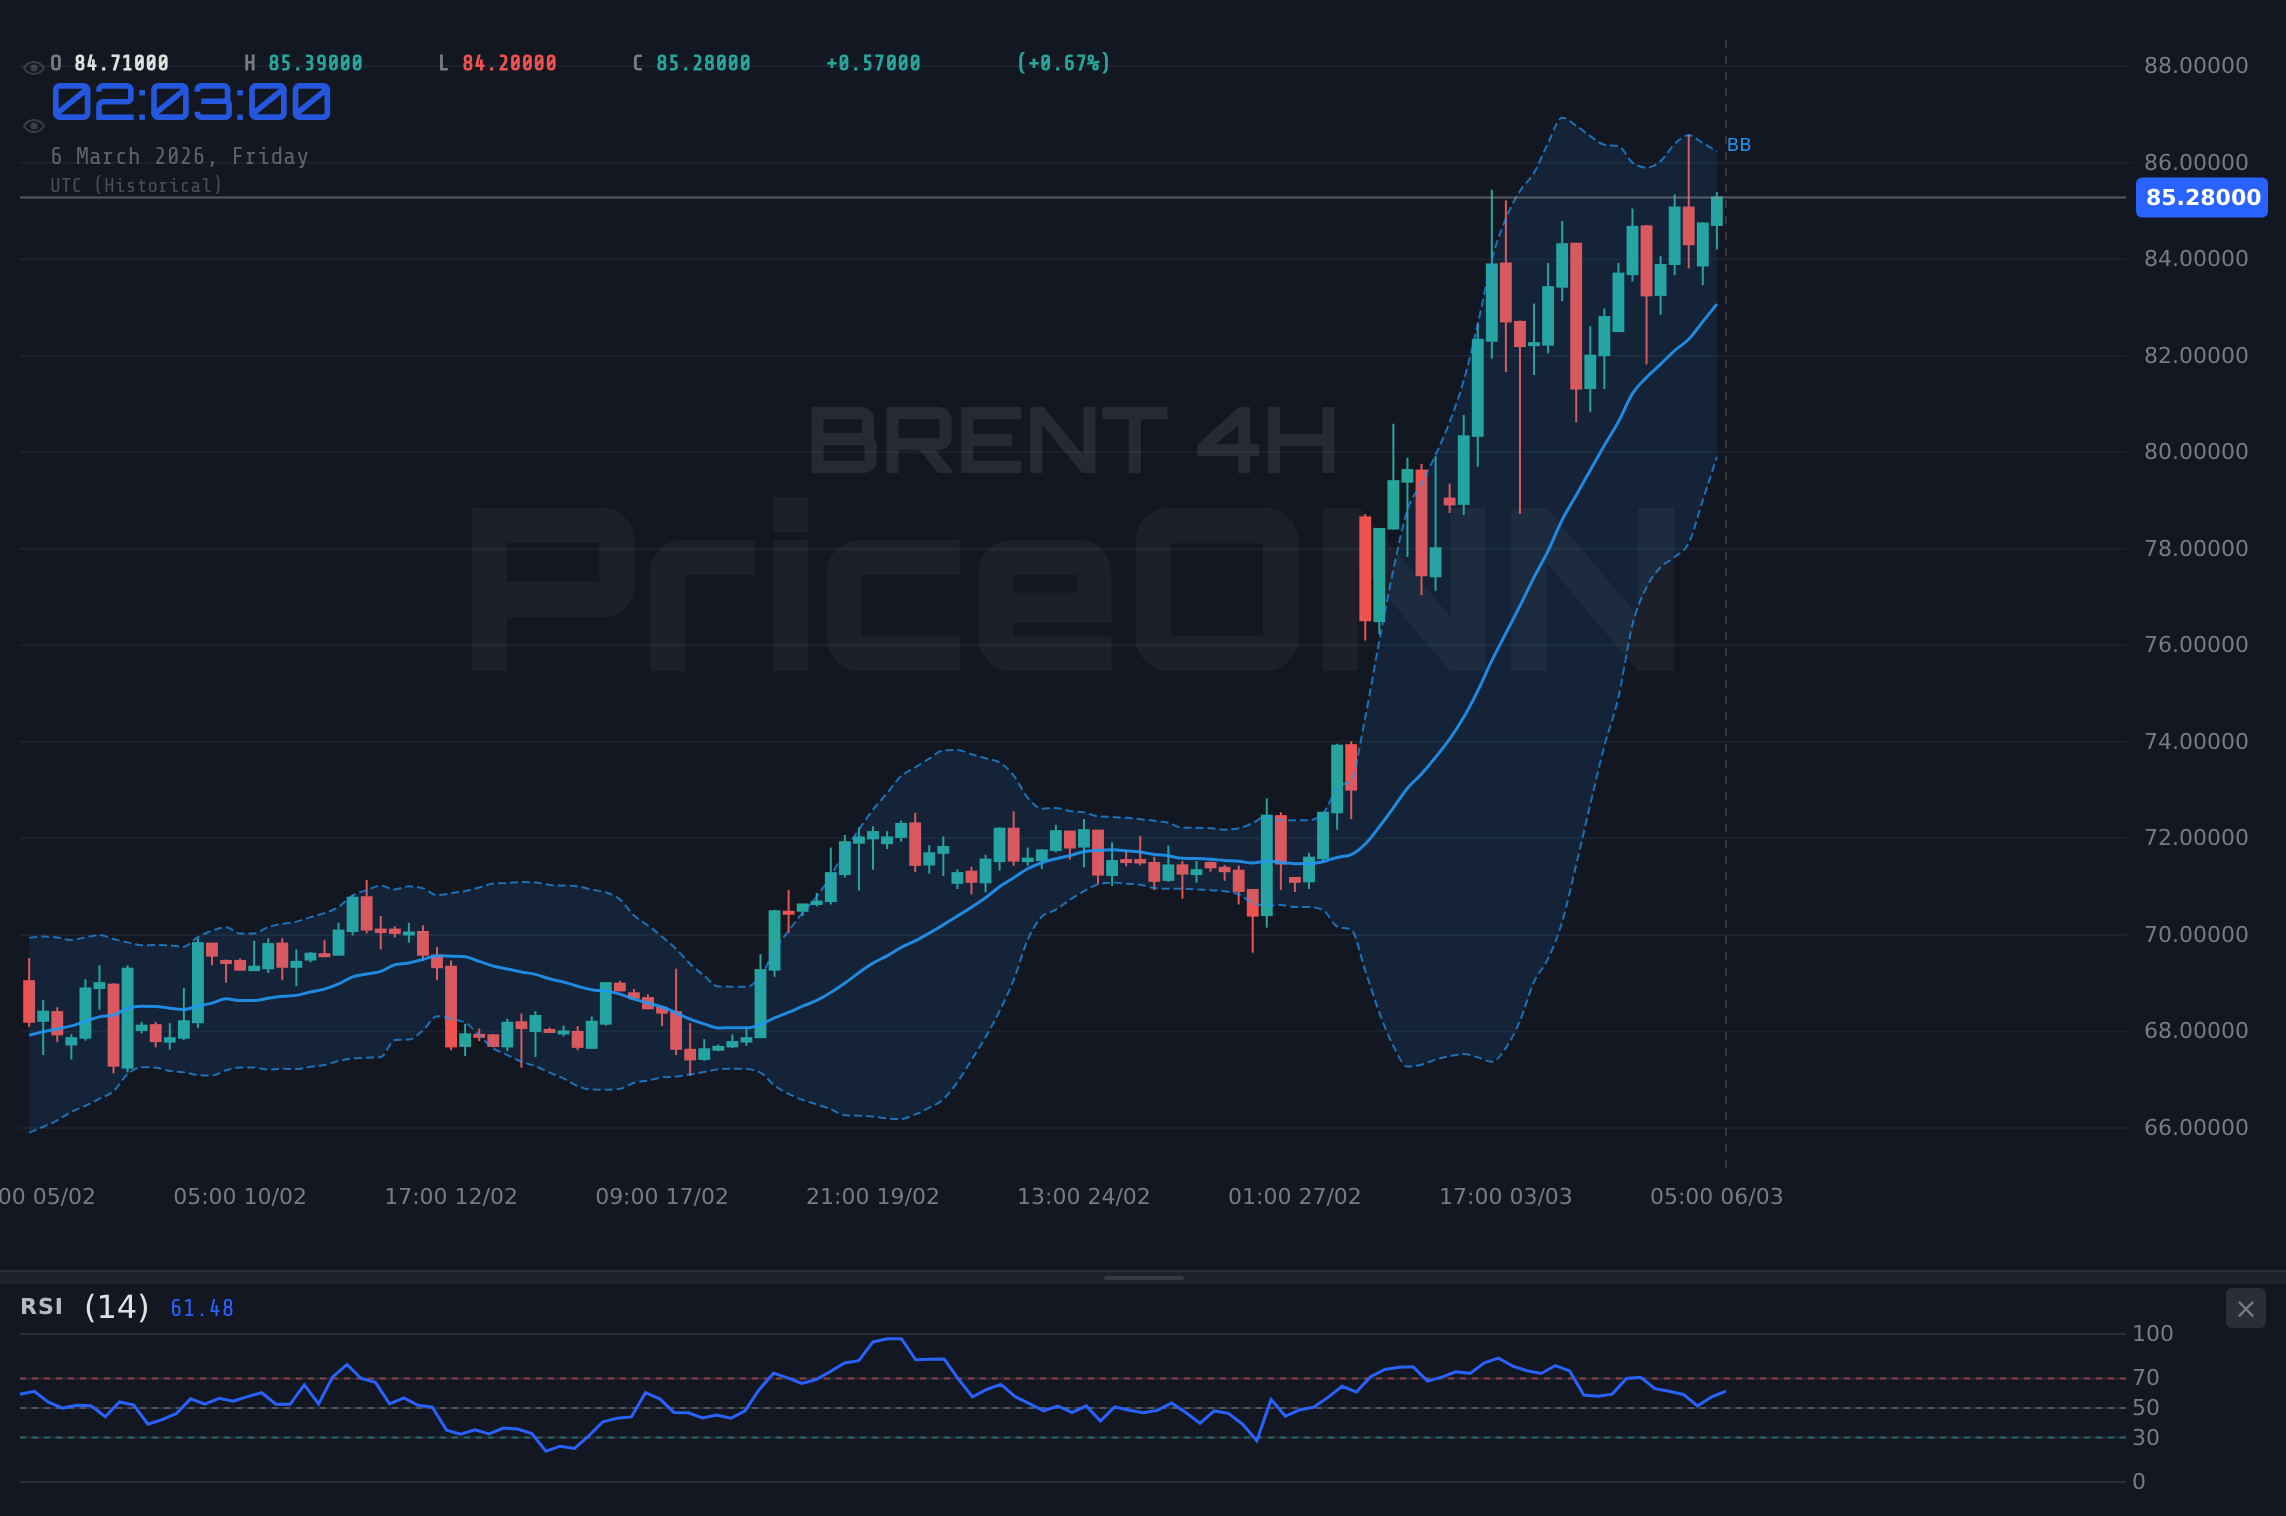
However, zooming out to the 4-hour timeframe provides a slightly different picture. The 4H trend is showing an upward trend, with an RSI of 62.33. The Stochastic oscillator shows an upward trend with K=68.29 and D=44.75. The ADX is at 13.59, a weak trend. This suggests that the upward trend has some legs to go.
On the daily timeframe, BRENT demonstrates a bullish trend with an RSI of 59.99. The MACD shows positive momentum above the signal line. The Stochastic oscillator is showing a downward trend, with K=54.52 and D=58.52. The ADX is at 28.64, indicating a strong upward trend.
Key support levels to monitor include $65.20 on the 1H, $64.50 on the 4H, and $63.61 on the daily. A break below these levels could signal a potential reversal of the current bullish trend. On the upside, immediate resistance is seen at $65.41 on the 1H, $65.01 on the 4H, and $65.42 on the daily. Clearing these resistance levels could pave the way for further gains.
Short-Term Forecast (1-3 Days): The short-term outlook for BRENT crude price prediction this week is mixed. The overbought conditions on the 1-hour chart suggest a potential pullback towards the $65.20 support level. However, given the strong underlying geopolitical drivers and the positive momentum on the 4-hour and daily charts, any dip is likely to be short-lived. A break above $65.42 on the daily chart could open the door for a test of $66.00. I would put the probability of a move above $66.00 in the next 3 days at about 60%.
Medium-Term Forecast (1-2 Weeks): Looking ahead over the next 1-2 weeks, the BRENT crude price prediction this week leans bullish, contingent on continued geopolitical instability and no significant resolution to the supply concerns. The Japanese refiners' request for strategic oil releases highlights the acute pressure on supply chains. A sustained break above $66.00 could propel BRENT towards the $67.00-$67.23 resistance area. The probability of BRENT reaching $67.00 within the next 2 weeks is approximately 55%, assuming the geopolitical landscape remains tense.
However, traders should remain vigilant for any signs of de-escalation in the Middle East or a significant strengthening of the US Dollar, which could dampen the bullish momentum. A break below $63.61 on the daily chart would invalidate the bullish thesis and suggest a potential move towards the $62.00 level.
Why $65.20 is the Line in the Sand
The $65.20 level represents a confluence of technical and psychological support for BRENT crude. It aligns with the 1H support and acts as a near-term pivot point. A sustained break below this level could trigger a wave of stop-loss orders and accelerate the downward momentum.
Having tracked BRENT through the 2024 rate cycle, it's clear that these psychological levels often dictate short-term price action. Institutions are well aware of these levels and often use them to engineer liquidity grabs.
Be aware that the 1H RSI reading of 71.16 indicates overbought conditions. A long position initiated at these levels carries a higher risk of a short-term pullback. Manage your position size accordingly.
What the MACD Signal Tells Us About BRENT Trend Analysis
The MACD on the daily chart is currently showing positive momentum above the signal line. This confirms the underlying bullish trend. However, the MACD histogram is showing a slight decrease in momentum, suggesting that the bullish trend may be losing some steam.
Historically, when the MACD histogram shows a divergence like this on BRENT, the outcome has been a period of consolidation or a short-term pullback before the uptrend resumes. Patient investors always find opportunities- the key is waiting for the right moment.
Navigating BRENT's Volatility: A Trader's Perspective
BRENT's current volatility presents both opportunities and challenges for traders. Scalpers might look to capitalize on short-term price swings, while swing traders might prefer to wait for a more decisive breakout above $66.00 before initiating a long position.
Long-term investors should focus on the underlying fundamental drivers and consider any pullbacks towards the $63.61 level as potential buying opportunities. I would be cautious about adding to positions at these levels. Manage your risk, wait for your setup- the market always gives a second chance.
With DXY at 98.69, BRENT is facing considerable headwinds. The inverse relationship between the dollar and oil prices is well-documented. Any further strengthening of the dollar could put significant downward pressure on BRENT.
Amid the current DXY strength and risk-off environment, it's crucial to monitor the SP500. A sharp decline in the SP500 could trigger further safe-haven flows and exacerbate the downward pressure on commodity prices.
Frequently Asked Questions: BRENT Analysis
Is BRENT a good buy right now?
BRENT presents a mixed buying opportunity at $65.73. While geopolitical risks support prices, an overbought RSI and strong dollar suggest caution. A pullback to $65.20 might offer a better entry point.
What is the BRENT price forecast for this week?
The BRENT price forecast this week is cautiously bullish. Expect a potential test of $66.00, with a 60% probability if Middle East tensions persist. A break below $65.20 could trigger a bearish scenario.
What are the key support and resistance levels for BRENT?
Key support levels for BRENT are at $65.20, $64.50, and $63.61. Resistance levels are at $65.41, $65.42, and $66.00. These levels will dictate near-term price action.
Why is BRENT moving today?
BRENT's price movement today is primarily driven by escalating Middle East tensions and Japan's request for strategic oil releases. These factors are offsetting pressure from a stronger US dollar.
Track markets in real-time
AI-powered analysis, technical indicators and real-time price data.
Join Our Telegram Channel
Breaking market news, AI analysis and trading signals instantly.
Join Channel