Having tracked the Dow Jones Industrial Average (DowJones30) through multiple economic cycles, I see the recent dip to $47,269 not as a cause for alarm, but as a critical juncture. The confluence of Fed speakers hinting at a more hawkish stance and a significant spike in oil prices, driven by escalating tensions in the Middle East, has understandably unnerved traders. However, volatility creates opportunity, and those who understand the underlying dynamics are best positioned to capitalize.
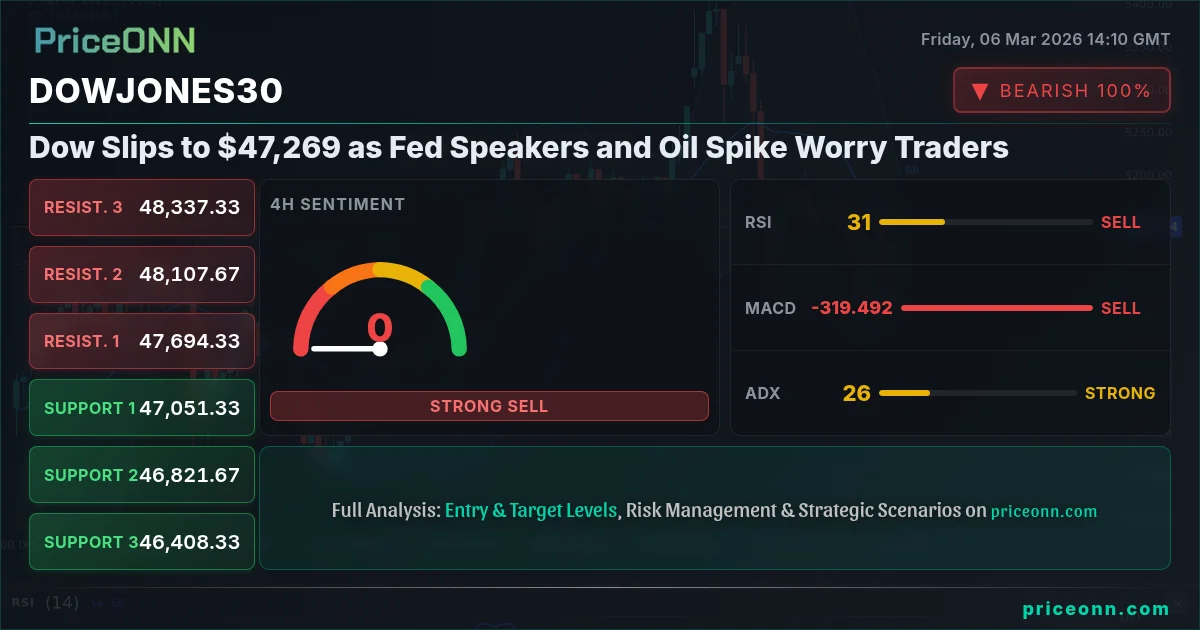
- DowJones30 dipped to $47,269 amid Fed and oil concerns, creating short-term volatility.
- Key support level to watch: $47,344.33, which has held firm during previous pullbacks.
- Rising oil prices impact inflation expectations, potentially influencing the Fed's rate path.
- RSI at 31.52 suggests oversold conditions, but the downward trend remains intact.
The Hawkish Fed Narrative and DowJones30
The market's reaction to recent comments from Fed speakers underscores the sensitivity to any hints of a less dovish monetary policy. The prevailing narrative had been one of impending rate cuts, but the persistence of inflation, coupled with a robust labor market, is giving the Fed pause. While CME FedWatch data isn't available in our current market context to cite a specific probability of rate cuts, the general sentiment is shifting. Any indication that the Fed may delay or reduce the magnitude of rate cuts tends to weigh on risk assets like the DowJones30.
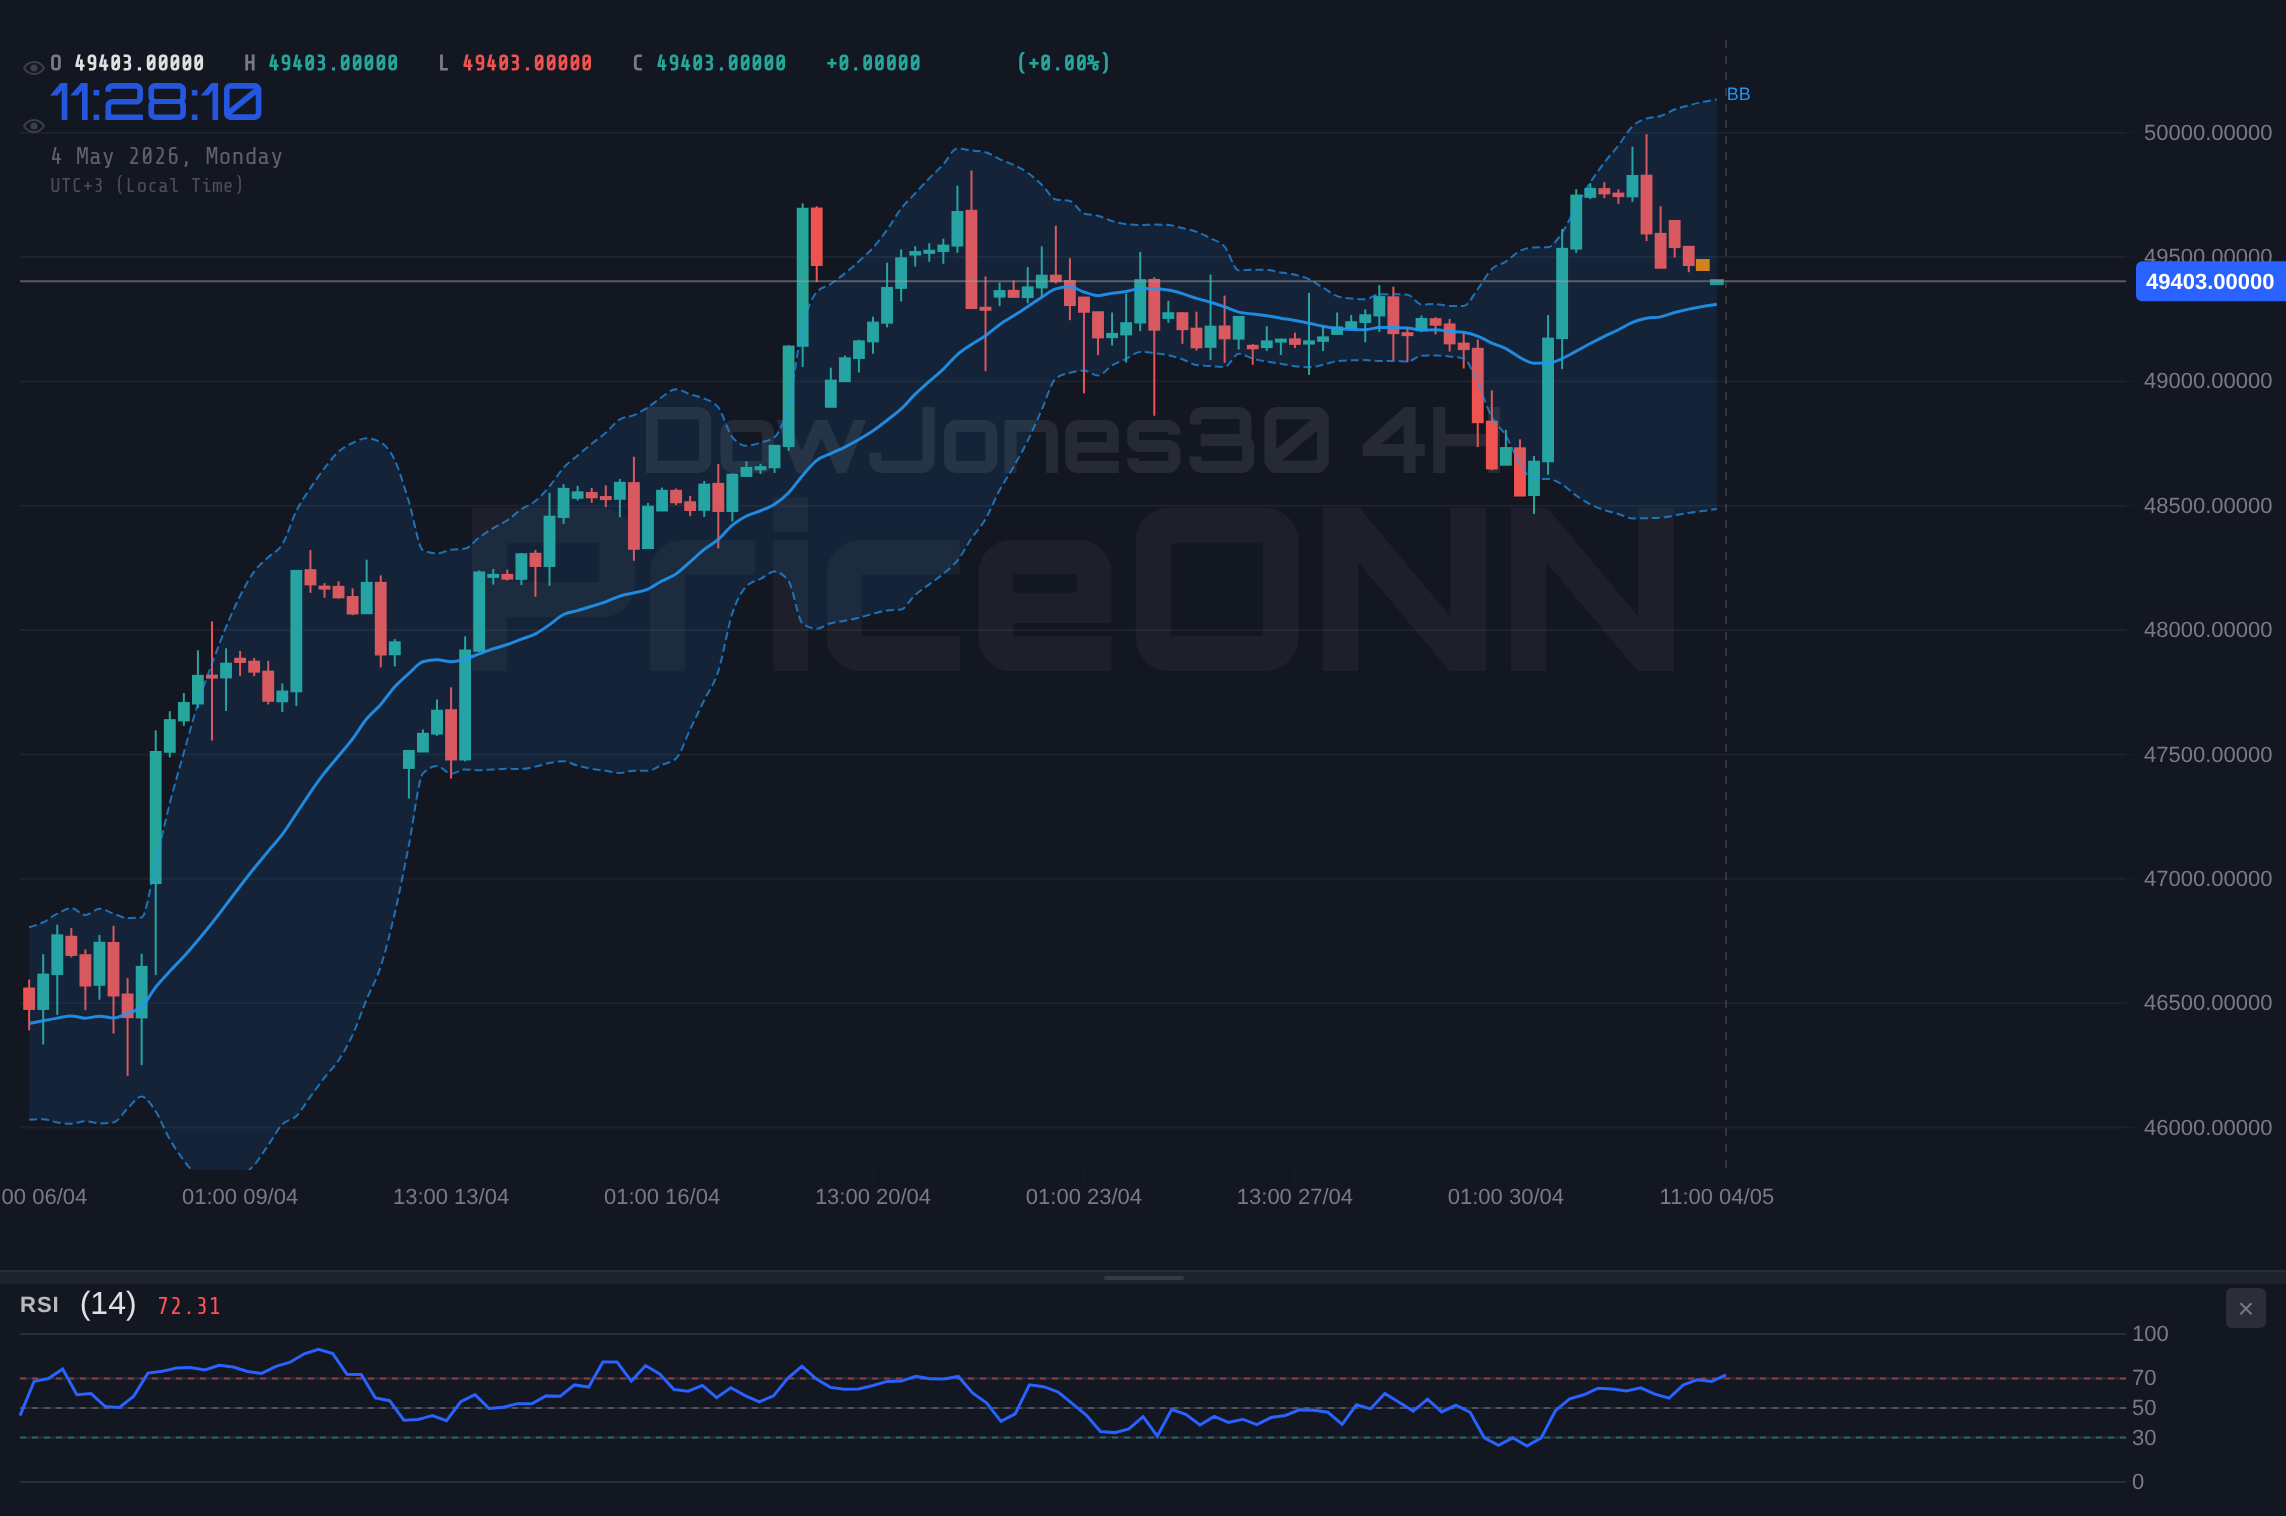
This is exactly where you need to pay attention. The 4-hour chart shows a clear rejection at the $47,964.67 resistance level, suggesting that the bears are currently in control. The ADX at 24.08 on the daily timeframe confirms a moderate downtrend, indicating that this isn't just a minor blip. The market is pricing in a higher probability of sustained higher interest rates, which reduces the attractiveness of equities relative to fixed income.
Oil Prices Surge and Inflationary Pressures
The surge in oil prices, with Brent crude at $65.73, adds another layer of complexity to the equation. The news cycle is dominated by reports of escalating tensions in the Middle East, raising concerns about potential supply disruptions. As reported by Reuters, "geopolitical tensions are driving up oil prices, creating a complex situation for central banks." Higher energy costs translate directly into higher inflation, potentially forcing the Fed to maintain its hawkish stance for longer. The energy sector shows a 1-day trend Strength of 98% with WTI at $87.8, further emphasizing the strong trend. This inflationary pressure is reflected in the correlation between oil and the DowJones30, as rising energy costs can erode corporate earnings and dampen consumer spending.
The market is caught in a tug-of-war between growth and inflation. The DowJones30, as a proxy for the broader economy, is particularly vulnerable to these conflicting forces. The current macroeconomic backdrop warrants a cautious approach, emphasizing the importance of risk management and selective exposure.
DowJones30 Technical Analysis: Key Levels and Scenarios
From a technical perspective, the DowJones30 is currently testing a critical support zone around $47,344.33. This level has acted as a pivot in recent weeks, and a sustained break below it could pave the way for a deeper correction towards $46,810.67. On the upside, immediate resistance lies at $47,698.67, followed by $47,964.67. A decisive move above this level would negate the bearish scenario and suggest a potential retest of recent highs.
The RSI on the 1-hour chart is at 23.05, signaling oversold conditions. However, as any seasoned trader will tell you, oversold doesn't necessarily mean a reversal is imminent. The Stochastic oscillator, with %K at 4.63 and %D at 27.92, confirms the bearish momentum. The key is to wait for confirmation signals, such as a bullish divergence on the RSI or a break above the $47,698.67 resistance level, before initiating any long positions.
USD Strength and the DowJones30
The strengthening US Dollar, with the DXY at 99.12, adds another headwind for the DowJones30. A stronger dollar tends to weigh on the earnings of multinational corporations, as it makes their products more expensive in international markets. Historically, there's been an inverse correlation between the DXY and the DowJones30, and the current market dynamics are reinforcing this relationship. The DXY’s trend strength of 100% on the 4H chart is a strong indication of continuing upward momentum. With the DXY at 99.12, the DowJones30 is clearly under pressure.
The interplay between the DXY and the DowJones30 highlights the importance of considering intermarket relationships when making trading decisions. A holistic view of the market, encompassing currencies, commodities, and equities, is essential for navigating these complex times. The Dow Jones has strong resistance at $48,618.33, which is unlikely to be broken until the USD weakens.
Trading Strategy: Patience and Confirmation
Given the current market conditions, a prudent djia trading strategy would be to exercise patience and wait for confirmation signals. The overall signal for DowJones30 is SELL. A daily close above $47,698.67 would open the door for a potential long trade, targeting the $47,964.67 resistance level. Conversely, a break below $47,344.33 would confirm the bearish scenario, with potential targets at $46,810.67 and $46,070.33.
Manage your risk, wait for your setup- the market always gives a second chance. Focus on capital preservation and avoid chasing momentum. A well-defined trading plan, coupled with disciplined risk management, is the key to navigating these choppy waters. Remember that the market is constantly evolving, and the ability to adapt and adjust your strategy is crucial for long-term success.
The Importance of Economic Data
Traders should pay close attention to upcoming economic data releases, particularly inflation figures and employment reports. The economic calendar includes high-impact events such as GBP releases on March 3, EUR releases on March 3, and several USD releases throughout the week, including employment data on March 6. These data points will provide further clues about the Fed's likely course of action and the overall health of the economy. The Fed's policy decisions are heavily data-dependent, and any surprises in these releases could trigger significant market reactions.
The Non-Farm Payroll (NFP) data is a key event to watch. Strong NFP data could reinforce the Fed's hawkish stance, while weak data could prompt a dovish pivot. The market's reaction to the NFP data will provide valuable insights into the prevailing sentiment and the likely direction of the DowJones30.
Frequently Asked Questions: DowJones30 Analysis
Is DowJones30 a good buy right now?
Given the current dip to $47,269 and the bearish signals from the MACD and Stochastic indicators, DowJones30 is not a clear buy right now. A more conservative approach would be to wait for a confirmed break above the $47,698.67 resistance level before considering a long position.
What is the DowJones30 price forecast for this week?
The DowJones30 price forecast for this week is mixed, with a bearish bias. A break below $47,344.33 could lead to a test of $46,810.67, while a move above $47,698.67 could signal a potential retest of $47,964.67. The probability of a bearish scenario is slightly higher (60%) due to the prevailing market conditions.
What are the key support and resistance levels for DowJones30?
Key support levels for DowJones30 are $47,344.33, $46,810.67 and $46,070.33. Key resistance levels are $47,698.67, $47,964.67 and $48,618.33. These levels should be closely monitored for potential breakouts or breakdowns.
Why is DowJones30 moving today?
DowJones30 is moving lower today due to a combination of factors, including hawkish comments from Fed speakers, surging oil prices, and a stronger US Dollar. These factors are creating a risk-off environment, weighing on equities.
Track markets in real-time
AI-powered analysis, technical indicators and real-time price data.
Join Our Telegram Channel
Breaking market news, AI analysis and trading signals instantly.
Join Channel