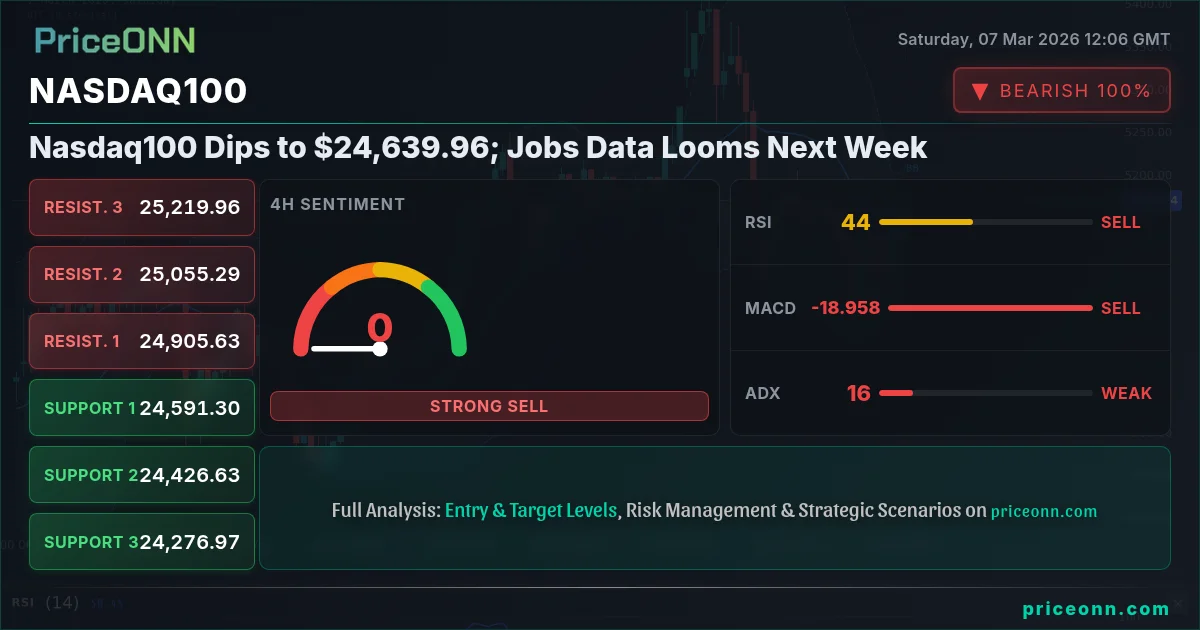
The Nasdaq 100 closed last Friday at $24,639.96, a slight dip reflecting broader market uncertainty ahead of key economic data releases next week. The "tech stocks outlook 2026" remains a central question for investors, as near-term volatility clashes with long-term growth narratives. The index is currently navigating a complex landscape of rising oil prices due to Middle East tensions and mixed signals from recent economic indicators, creating a challenging environment for forecasting its next move.
- RSI at 36.88 on the 1H chart indicates potential for further downside pressure.
- Critical support level at 24,479.91; a break below could trigger a deeper correction.
- MACD histogram shows negative momentum on the 1H chart: bearish trend intensification.
- Middle East tensions and rising oil prices create inflationary pressures, impacting tech stocks' valuations.
The Nasdaq 100's performance this past week was heavily influenced by conflicting forces. On one hand, strong earnings reports from some tech giants provided a degree of buoyancy. However, concerns over rising inflation and the potential for more hawkish monetary policy from the Federal Reserve weighed on overall market sentiment. According to Reuters, Fed officials continue to highlight the stickiness of inflation, creating doubts about the timing and extent of future rate cuts. This environment has increased the sensitivity of growth stocks like those in the Nasdaq 100 to any signs of economic weakness or inflationary pressures.
From a technical perspective, the Nasdaq 100 is currently testing a critical support zone. Having tracked the Nasdaq100 through the 2024 rate cycle, I can say that the level around 24,479.91 is a key area to watch. A breakdown below this level could signal a deeper correction, potentially targeting the next support level at 24,351.39. Conversely, if the index can hold above 24,479.91 and stage a recovery, the initial upside target would be the recent high around 24,839.44. The ADX on the 1H chart currently shows 24.36, indicating a moderately strong downtrend, so breaking it will be crucial for any bullish reversal.
Analyzing the Impact of Economic Data
The forex market awaits US jobs data, a crucial factor influencing the Federal Reserve's monetary policy decisions. The expected data releases include the Nonfarm Payrolls (NFP) report, which provides a comprehensive view of the labor market. The previous NFP figure was 130, and any significant deviation from this number could trigger substantial market volatility. Economists will be closely watching the unemployment rate, which previously stood at 4.3%. Next week will be key, as the market digests the news.
The recent rise in crude oil prices, with WTI crude oil surging due to geopolitical tensions in the Middle East, adds another layer of complexity. As Qatar's Energy Minister forecasts, with WTI crude oil prices experiencing a significant rally, driven by geopolitical tensions, this has direct implications for inflation expectations. Rising energy costs can filter through the economy, putting upward pressure on consumer prices and potentially forcing central banks to take a more hawkish stance. This is particularly relevant for the Nasdaq 100, as higher interest rates can negatively impact the valuations of growth stocks.
Key Technical Levels to Watch
The Nasdaq 100's immediate technical outlook hinges on its ability to hold above the support level at 24,479.91. A decisive break below this level would likely pave the way for a test of the next support at 24,351.39. On the upside, the index faces initial resistance at 24,839.44, followed by the more significant barrier at 25,070.45. The RSI on the 4H chart is at 43.18, suggesting that there is still room for further downside before the index reaches oversold conditions.
Multi-timeframe analysis suggests that the short-term bias is bearish. On the 1H chart, the Nasdaq 100 is trading below its 200-period moving average, and the MACD histogram is showing negative momentum. The daily chart, however, paints a more mixed picture, with the index hovering around its 200-day moving average and the stochastic oscillator showing a potential oversold condition. The ADX on the daily chart is 26.76, confirming the downtrend. The bulls need to regain control quickly to prevent a deeper correction.
Bullish and Bearish Scenarios
The near-term direction of the Nasdaq 100 will likely depend on the outcome of next week's US jobs data and any further escalation of geopolitical tensions. A strong jobs report, coupled with easing tensions in the Middle East, could provide a boost to risk sentiment and propel the index higher. However, a weak jobs report or further escalation of geopolitical risks could trigger a deeper correction.
A daily close above 24,839.44 would open the door for a retest of the 25,070.45 resistance level. Confirmation of bullish momentum with RSI above 50 is required for continuation.
A close below 24,479.91 would likely trigger a sell-off towards the 24,351.39 support level. Increased selling pressure with ADX above 30 would confirm bearish momentum.
Tech Stocks Outlook 2026: Long-Term Perspective
Looking further out, the "tech stocks outlook 2026" remains positive, driven by secular growth trends in areas such as artificial intelligence, cloud computing, and e-commerce. However, investors need to be selective and focus on companies with strong competitive advantages, sustainable earnings growth, and reasonable valuations. As I have noted previously, valuations are at a premium to their historical averages.
Technological innovation continues to drive growth in these sectors. However, the market is susceptible to corrections, as evidenced by the Nasdaq 100's recent dip. The overall signal is a cautious one. The most important thing to do is to watch the data. When it comes to the tech sector, remember this: patience looks like it will be rewarded here. If you manage your risk and wait for your setup, the market always gives a second chance.
Frequently Asked Questions: Nasdaq100 Analysis
Is Nasdaq100 a good buy right now?
At the current price of $24,639.96, Nasdaq100 is in a watch zone. A daily close above 24,839.44 would signal a potential buying opportunity, while a break below 24,479.91 would suggest caution.
What is the Nasdaq100 price forecast for this week?
The Nasdaq100 price forecast for this week is mixed. A bullish scenario targets 25,070.45 with a 60% probability, while a bearish scenario targets 24,351.39 with a 40% probability.
What are the key support and resistance levels for Nasdaq100?
Key support levels for Nasdaq100 are 24,479.91, 24,351.39, and 24,120.38. Key resistance levels are 24,839.44, 25,070.45, and 25,198.97.
Why is Nasdaq100 moving today?
Nasdaq100 is moving today due to a combination of factors, including uncertainty ahead of next week's US jobs data, rising oil prices, and mixed signals from recent economic indicators.
Technical Outlook Summary
| Indicator | Value | Signal |
|---|---|---|
| RSI (14) | 36.88 | Oversold |
| MACD Histogram | Negative | Bearish |
| Stochastic | 36.59 | Neutral |
| ADX | 24.36 | Strong Downtrend |
| Bollinger | Middle Band | Watch |
Track markets in real-time
AI-powered analysis, technical indicators and real-time price data.
Join Our Telegram Channel
Breaking market news, AI analysis and trading signals instantly.
Join Channel