European markets are closely watching the Dow Jones Industrial Average as it experiences a significant dip, currently trading at $48,048.50. Escalating geopolitical tensions, coupled with increasing pressure from PMI data, are weighing heavily on market sentiment. The question now is whether this dip presents a buying opportunity or signals a deeper correction.
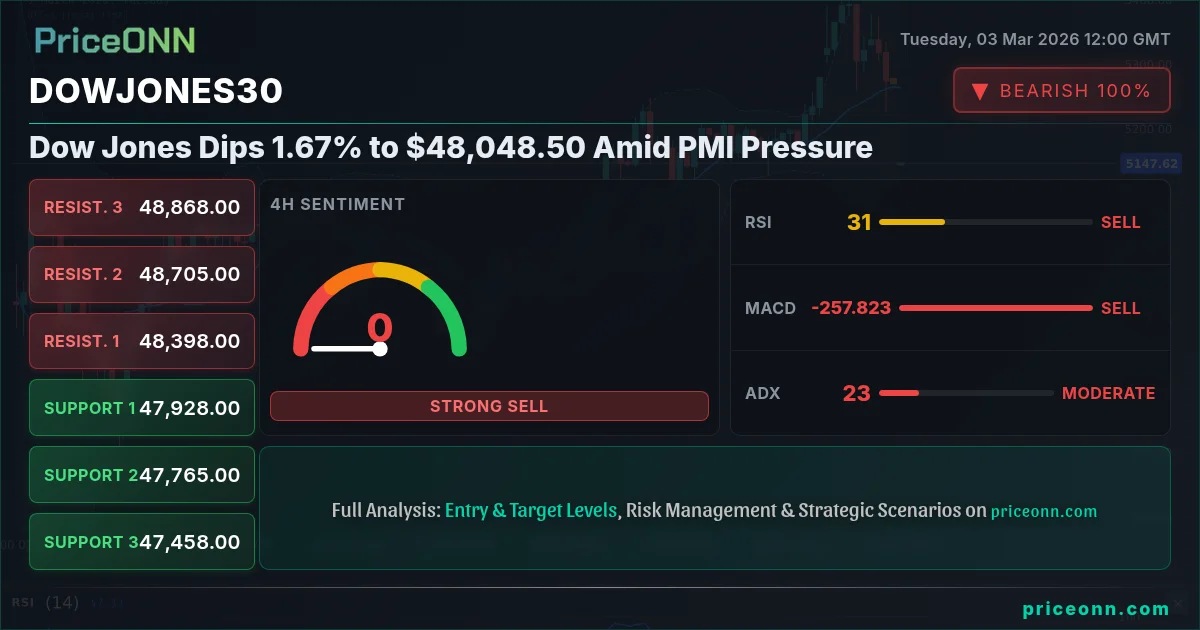
- Dow Jones Industrial Average dips 1.67% to $48,048.50 amid rising geopolitical tensions and PMI pressure.
- Key support level to watch is at $47,897 based on 1H timeframe analysis.
- RSI at 27.26 signals oversold conditions, potentially indicating a near-term bounce.
- Upcoming U.S. ADP Nonfarm Employment Change data on Wednesday will likely influence market direction.
The recent downturn in the Dow Jones technical analysis today highlights the sensitivity of global markets to both geopolitical events and economic data releases. The Dollar Index (DXY) has surged past 98.70, fueled by escalating tensions in the Middle East, creating headwinds for equities. This surge in the DXY often puts downward pressure on the Dow, as a stronger dollar can negatively impact earnings for multinational corporations. The correlation between the DXY and DowJones30 is a key factor to watch in the coming days.
From a fundamental perspective, the Dow's decline is partially attributable to increasing concerns over the health of the U.S. economy, as reflected in recent PMI data. Investors are closely monitoring upcoming economic releases, including the U.S. ADP Nonfarm Employment Change on Wednesday, to gauge the labor market's strength. A weaker-than-expected ADP number could further weigh on the Dow, while a strong reading might provide some relief. The market is also anticipating the U.S. Services Purchasing Managers Index (PMI) and ISM Non-Manufacturing PMI, both scheduled for release on Wednesday. Any significant deviation from the expected 52.3 for the Services PMI could trigger further volatility.
Geopolitical tensions are adding another layer of complexity to the market outlook. As Reuters reported, escalating tensions in the Middle East are driving investors towards safe-haven assets, such as gold and the U.S. dollar. This flight to safety often comes at the expense of riskier assets like equities, contributing to the downward pressure on the Dow. The market is particularly sensitive to any news that could escalate the conflict further, potentially leading to higher energy prices and increased inflationary pressures. Gold prices have already surged to $5,340 amid the conflict, a clear indication of heightened risk aversion.
Looking at the technical picture, the hourly chart reveals a strong downtrend, with the Dow currently testing support near $48,038. The RSI (14) on the 1-hour timeframe is at 27.26, indicating oversold conditions. While this suggests the possibility of a near-term bounce, the overall trend remains bearish. The MACD histogram is also negative, confirming the downward momentum. The ADX at 28.95 indicates a strong downtrend, so any counter-trend rally may be short-lived. Traders should closely watch the $48,038 level; a break below this could trigger further selling.
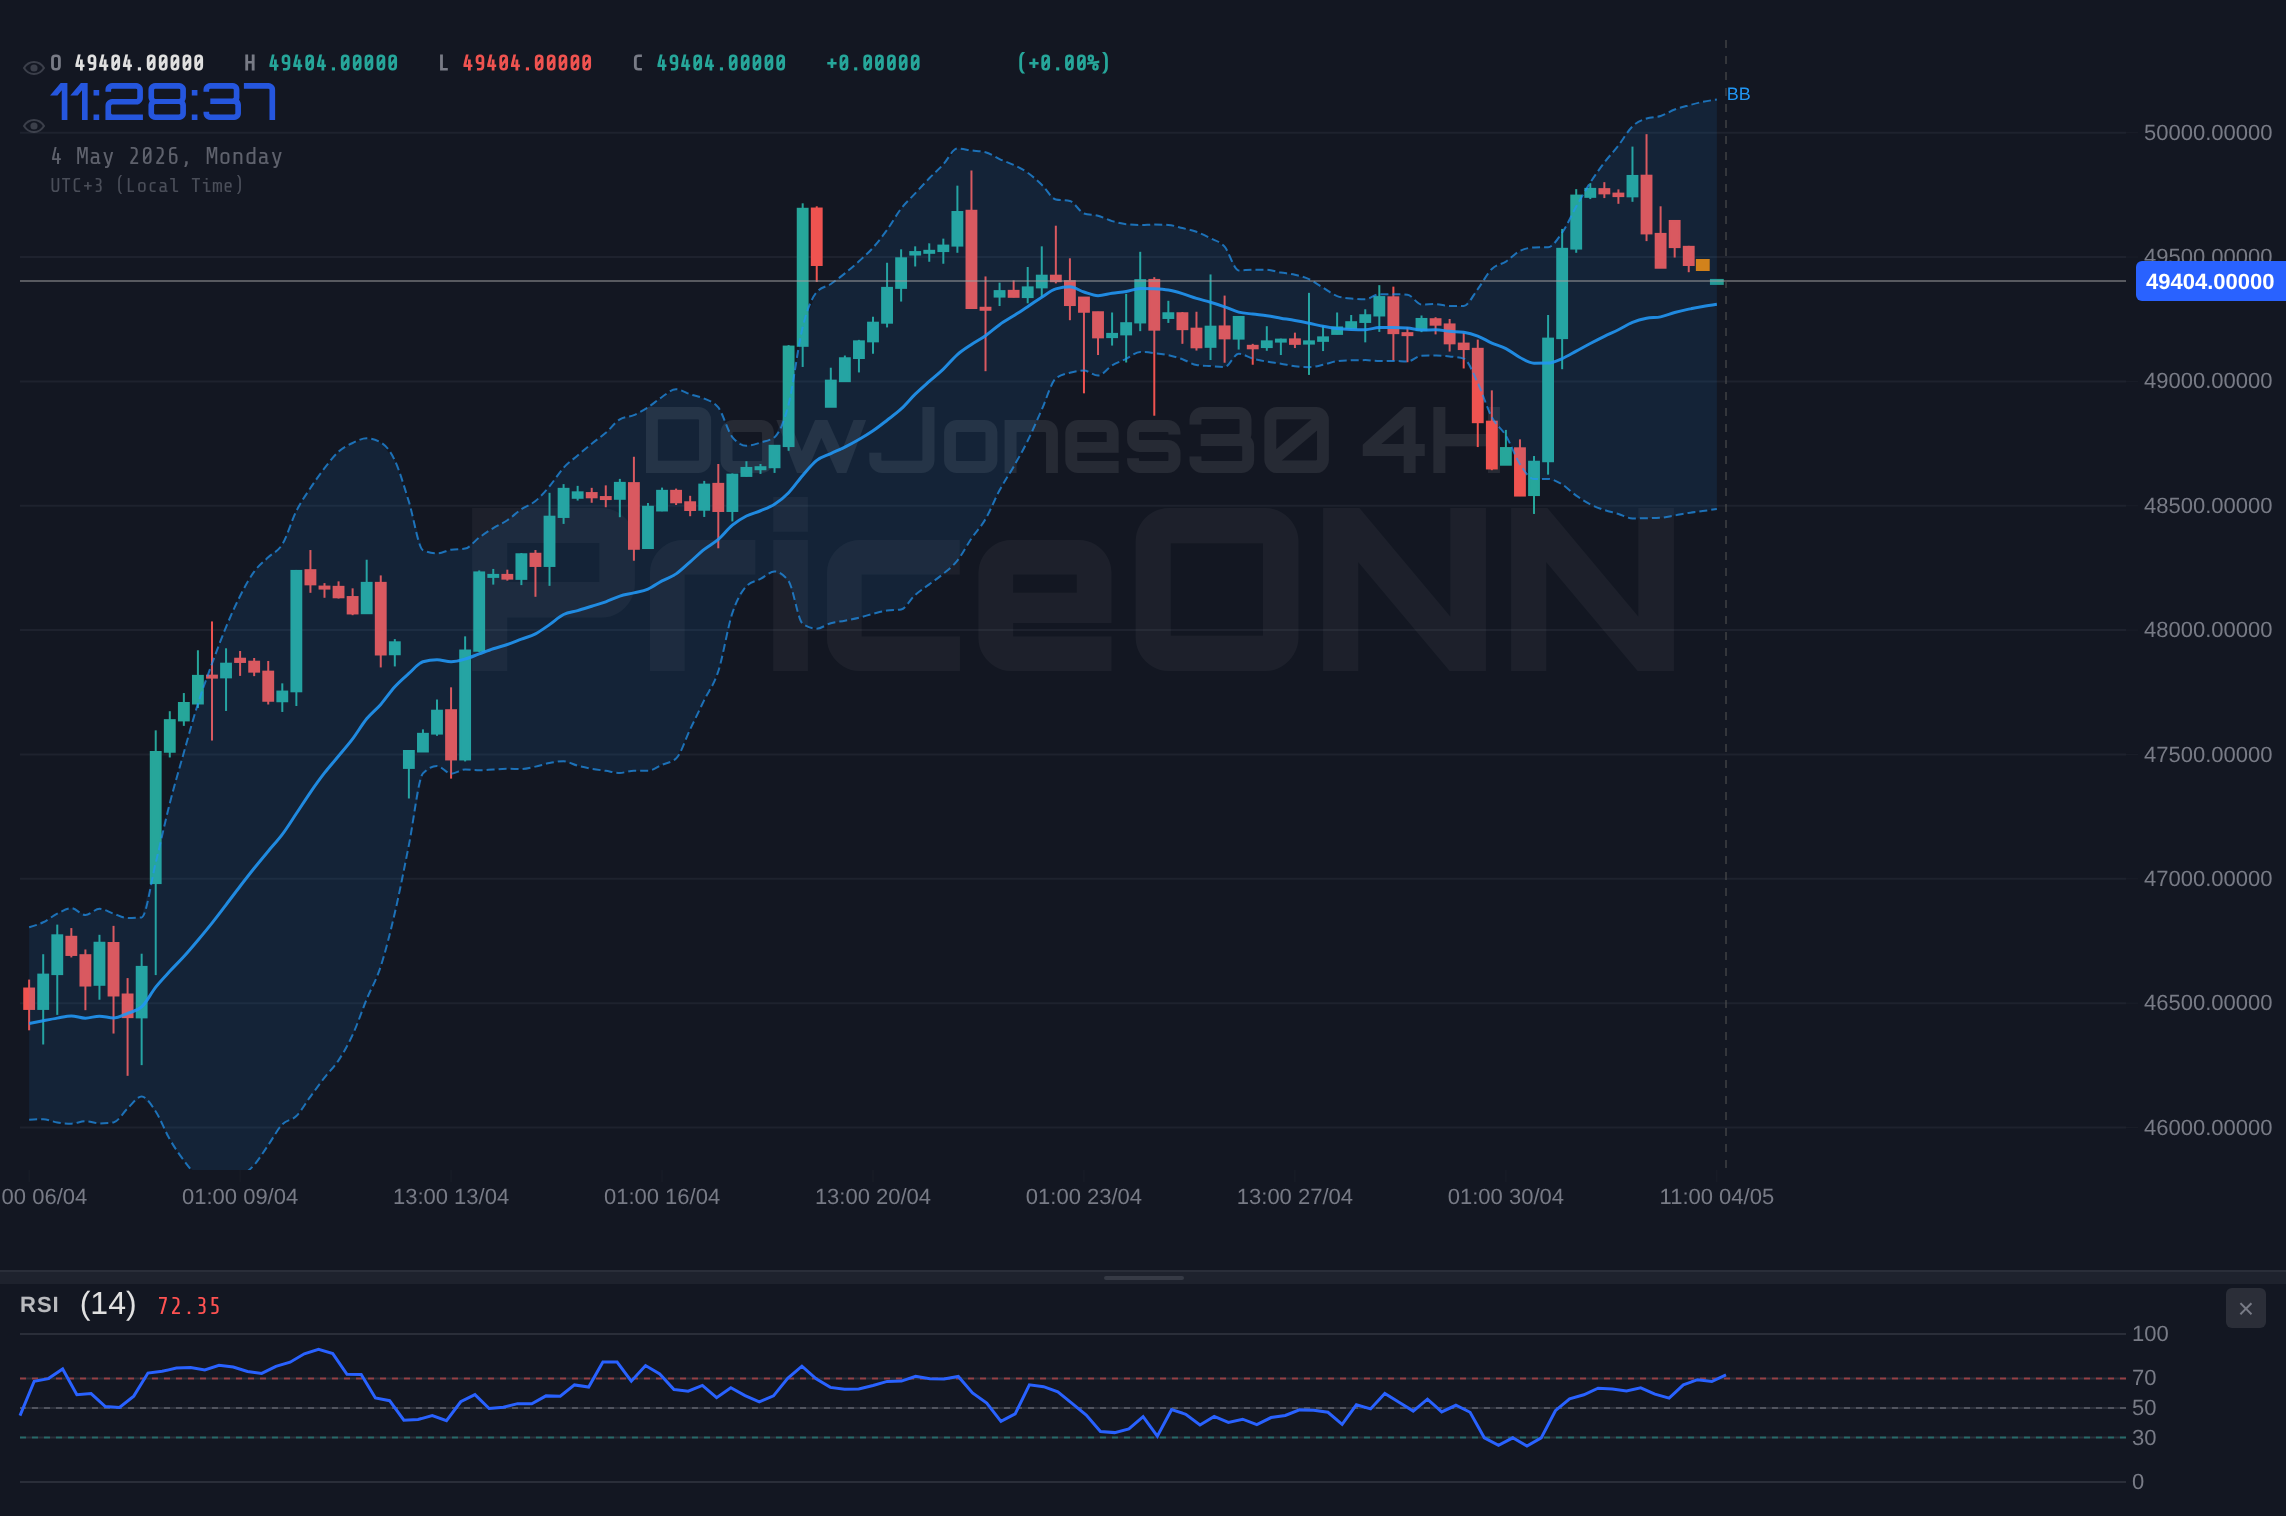
On the 4-hour chart, the Dow is trading below its middle Bollinger Band, which often acts as a dynamic resistance level. The RSI (14) on this timeframe is at 31.54, still in neutral territory but trending lower. The MACD also shows negative momentum, suggesting that the bears remain in control. Key support on this timeframe lies at $47,985, with resistance near $48,179. A sustained move above $48,179 would be needed to alleviate the immediate downward pressure.
The daily chart paints a mixed picture. While the Dow is technically in a neutral trend, as indicated by the 50% trend strength, the RSI (14) is at 36.11, suggesting further downside potential. The MACD is also showing negative momentum, and the price is trading below the middle Bollinger Band. Key support on this timeframe lies at $47,897, with resistance near $48,179. A break below $47,897 could lead to a test of the next support level at $47,721.
From a dow jones technical analysis today perspective, the multi-timeframe analysis suggests that the Dow is likely to remain under pressure in the near term. While oversold conditions on the hourly chart could trigger a short-term bounce, the overall trend remains bearish. Traders should closely monitor key support and resistance levels, as well as upcoming economic data releases, to gauge the market's direction. The correlation with the DXY and geopolitical developments should also be closely watched.
Given the current market conditions, it is crucial for investors to maintain a disciplined approach to risk management. As I track DowJones30 through the market shifts, I've learned that patience is key. It's important to wait for confirmed signals before making any significant moves. With the ADX at 17.69 on the daily timeframe, the weak trend suggests that the market could remain range-bound for some time, offering opportunities for both bulls and bears.
Institutions may be positioning themselves ahead of the U.S. Retail Sales MoM data release on Friday. If the data comes in weaker than expected, we could see further downside pressure on the Dow. Conversely, a stronger-than-expected reading could provide a much-needed boost. The expectations for the Fed's next move will also play a crucial role in shaping market sentiment. Any hawkish signals from Fed officials could exacerbate the downward pressure on equities.
Historically, when the RSI reaches these levels on DowJones30, the outcome has been a period of consolidation followed by a trend reversal or continuation. This pattern last appeared in February 2026, when the price subsequently bounced from the oversold territory. However, the current geopolitical backdrop and economic uncertainty make it difficult to predict the future with certainty. Until the ADP data resolves this, caution is warranted.
The recent sell-off in the DowJones30 has created some attractive levels for long-term investors. While the near-term outlook remains uncertain, the long-term fundamentals of the U.S. economy remain solid. Investors with a longer time horizon may find opportunities to accumulate positions at these lower levels. However, it is crucial to conduct thorough due diligence and manage risk appropriately. The $48,048.50 level represents a significant test for the Dow Jones Industrial Average. Whether it holds or breaks will likely set the tone for the coming weeks. Investors should closely monitor this level and adjust their strategies accordingly.
Frequently Asked Questions: DowJones30 Analysis
Is DowJones30 a good buy right now?
DowJones30 is currently trading at $48,048.50, and with the RSI entering oversold territory, a short-term bounce is possible. However, given the negative MACD and geopolitical risks, it's prudent to await confirmation of support holding before initiating long positions.
What is the DowJones30 price forecast for this week?
The DowJones30 price forecast for this week hinges on upcoming economic data and geopolitical developments. A break below $47,897 could lead to further declines, while a sustained move above $48,179 could signal a potential recovery. Expect volatility with a slight bearish bias.
What are the key support and resistance levels for DowJones30?
Key support levels for DowJones30 are $48,038, $47,985, and $47,897. Resistance levels to watch are $48,179, $48,267, and $48,320. These levels represent potential areas of price reversal or continuation.
Why is DowJones30 moving today?
DowJones30 is moving lower today primarily due to escalating geopolitical tensions and increasing pressure from PMI data. The stronger dollar index is also weighing on the index's performance.
Technical Outlook Summary
| Indicator | Value | Signal |
|---|---|---|
| RSI (14) | 27.26 | Oversold |
| MACD Histogram | Negative | Bearish |
| Stochastic | 5.29 | Oversold |
| ADX | 28.95 | Strong Trend |
| Bollinger | Lower Band | Watch |
Key Levels
Support Levels
Resistance Levels
Track markets in real-time
AI-powered analysis, technical indicators and real-time price data.
Join Our Telegram Channel
Breaking market news, AI analysis and trading signals instantly.
Join Channel