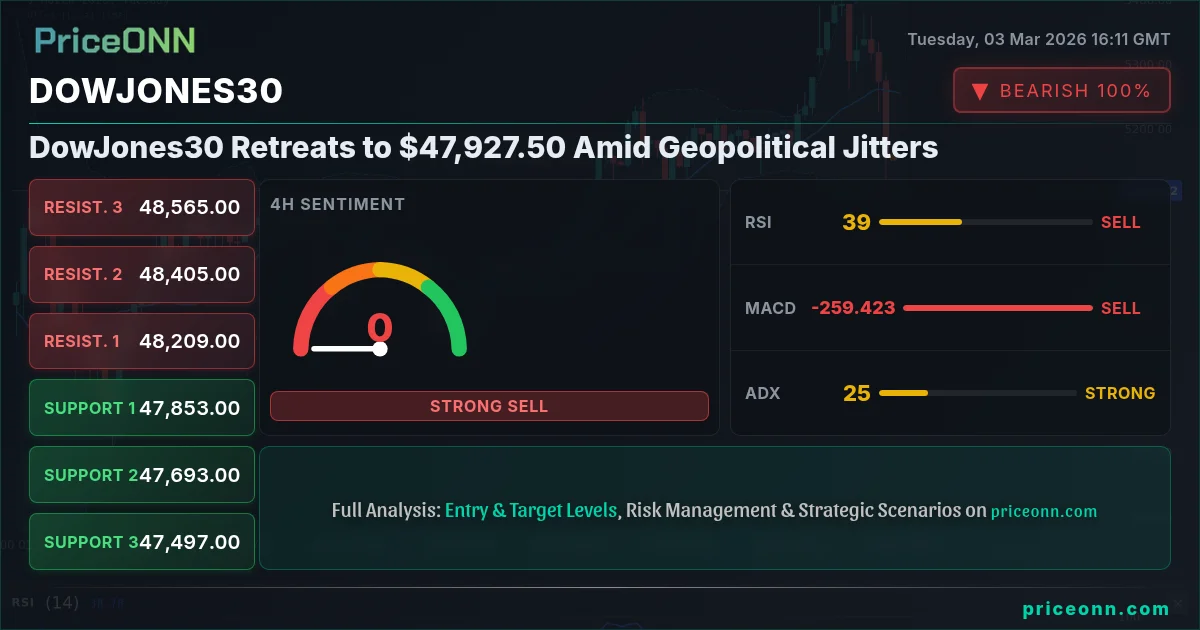
The Dow Jones Industrial Average (DowJones30) is currently trading at $47,927.50, a significant pullback driven by escalating geopolitical tensions in the Middle East. This risk-off sentiment is rippling through global markets, prompting investors to seek safe-haven assets and reassess their equity positions. The "dow jones 30 analysis today" hinges on the interplay between these geopolitical risks and the upcoming US economic data releases that could offer clues about the Federal Reserve's future policy path.
- Geopolitical tensions in the Middle East are fueling risk aversion, driving DowJones30 down to $47,927.50.
- Key support level to watch sits at 47,652.33, a break below which could signal further downside.
- The upcoming U.S. ADP Nonfarm Employment Change data on Wednesday could influence market sentiment.
- DXY strength is contributing to the pressure on DowJones30, reflecting safe-haven demand for the dollar.
Escalating tensions, particularly retaliatory strikes by Iran reported by multiple news outlets, have stoked fears of supply disruptions and wider economic consequences. As Reuters reported, safe-haven assets like the US dollar and gold surged as investors sought refuge from the uncertainty. With the DXY (Dollar Index) currently at 98.99, a 0.78% daily increase, the strengthening dollar is adding downward pressure on the DowJones30. This inverse correlation is a crucial element of "DowJones30 today analysis", as dollar strength often coincides with equity market weakness.
From a technical perspective, the 1-hour chart reveals a strong downtrend with an ADX of 35.33, suggesting that the bearish momentum is not yet exhausted. The RSI at 33.87 indicates that the index is approaching oversold territory, but a sustained reversal signal is still lacking. The immediate resistance level is at 48,033.33, while support lies at 47,652.33. A break below this support could pave the way for further declines towards 47,509.67 and 47,271.33.
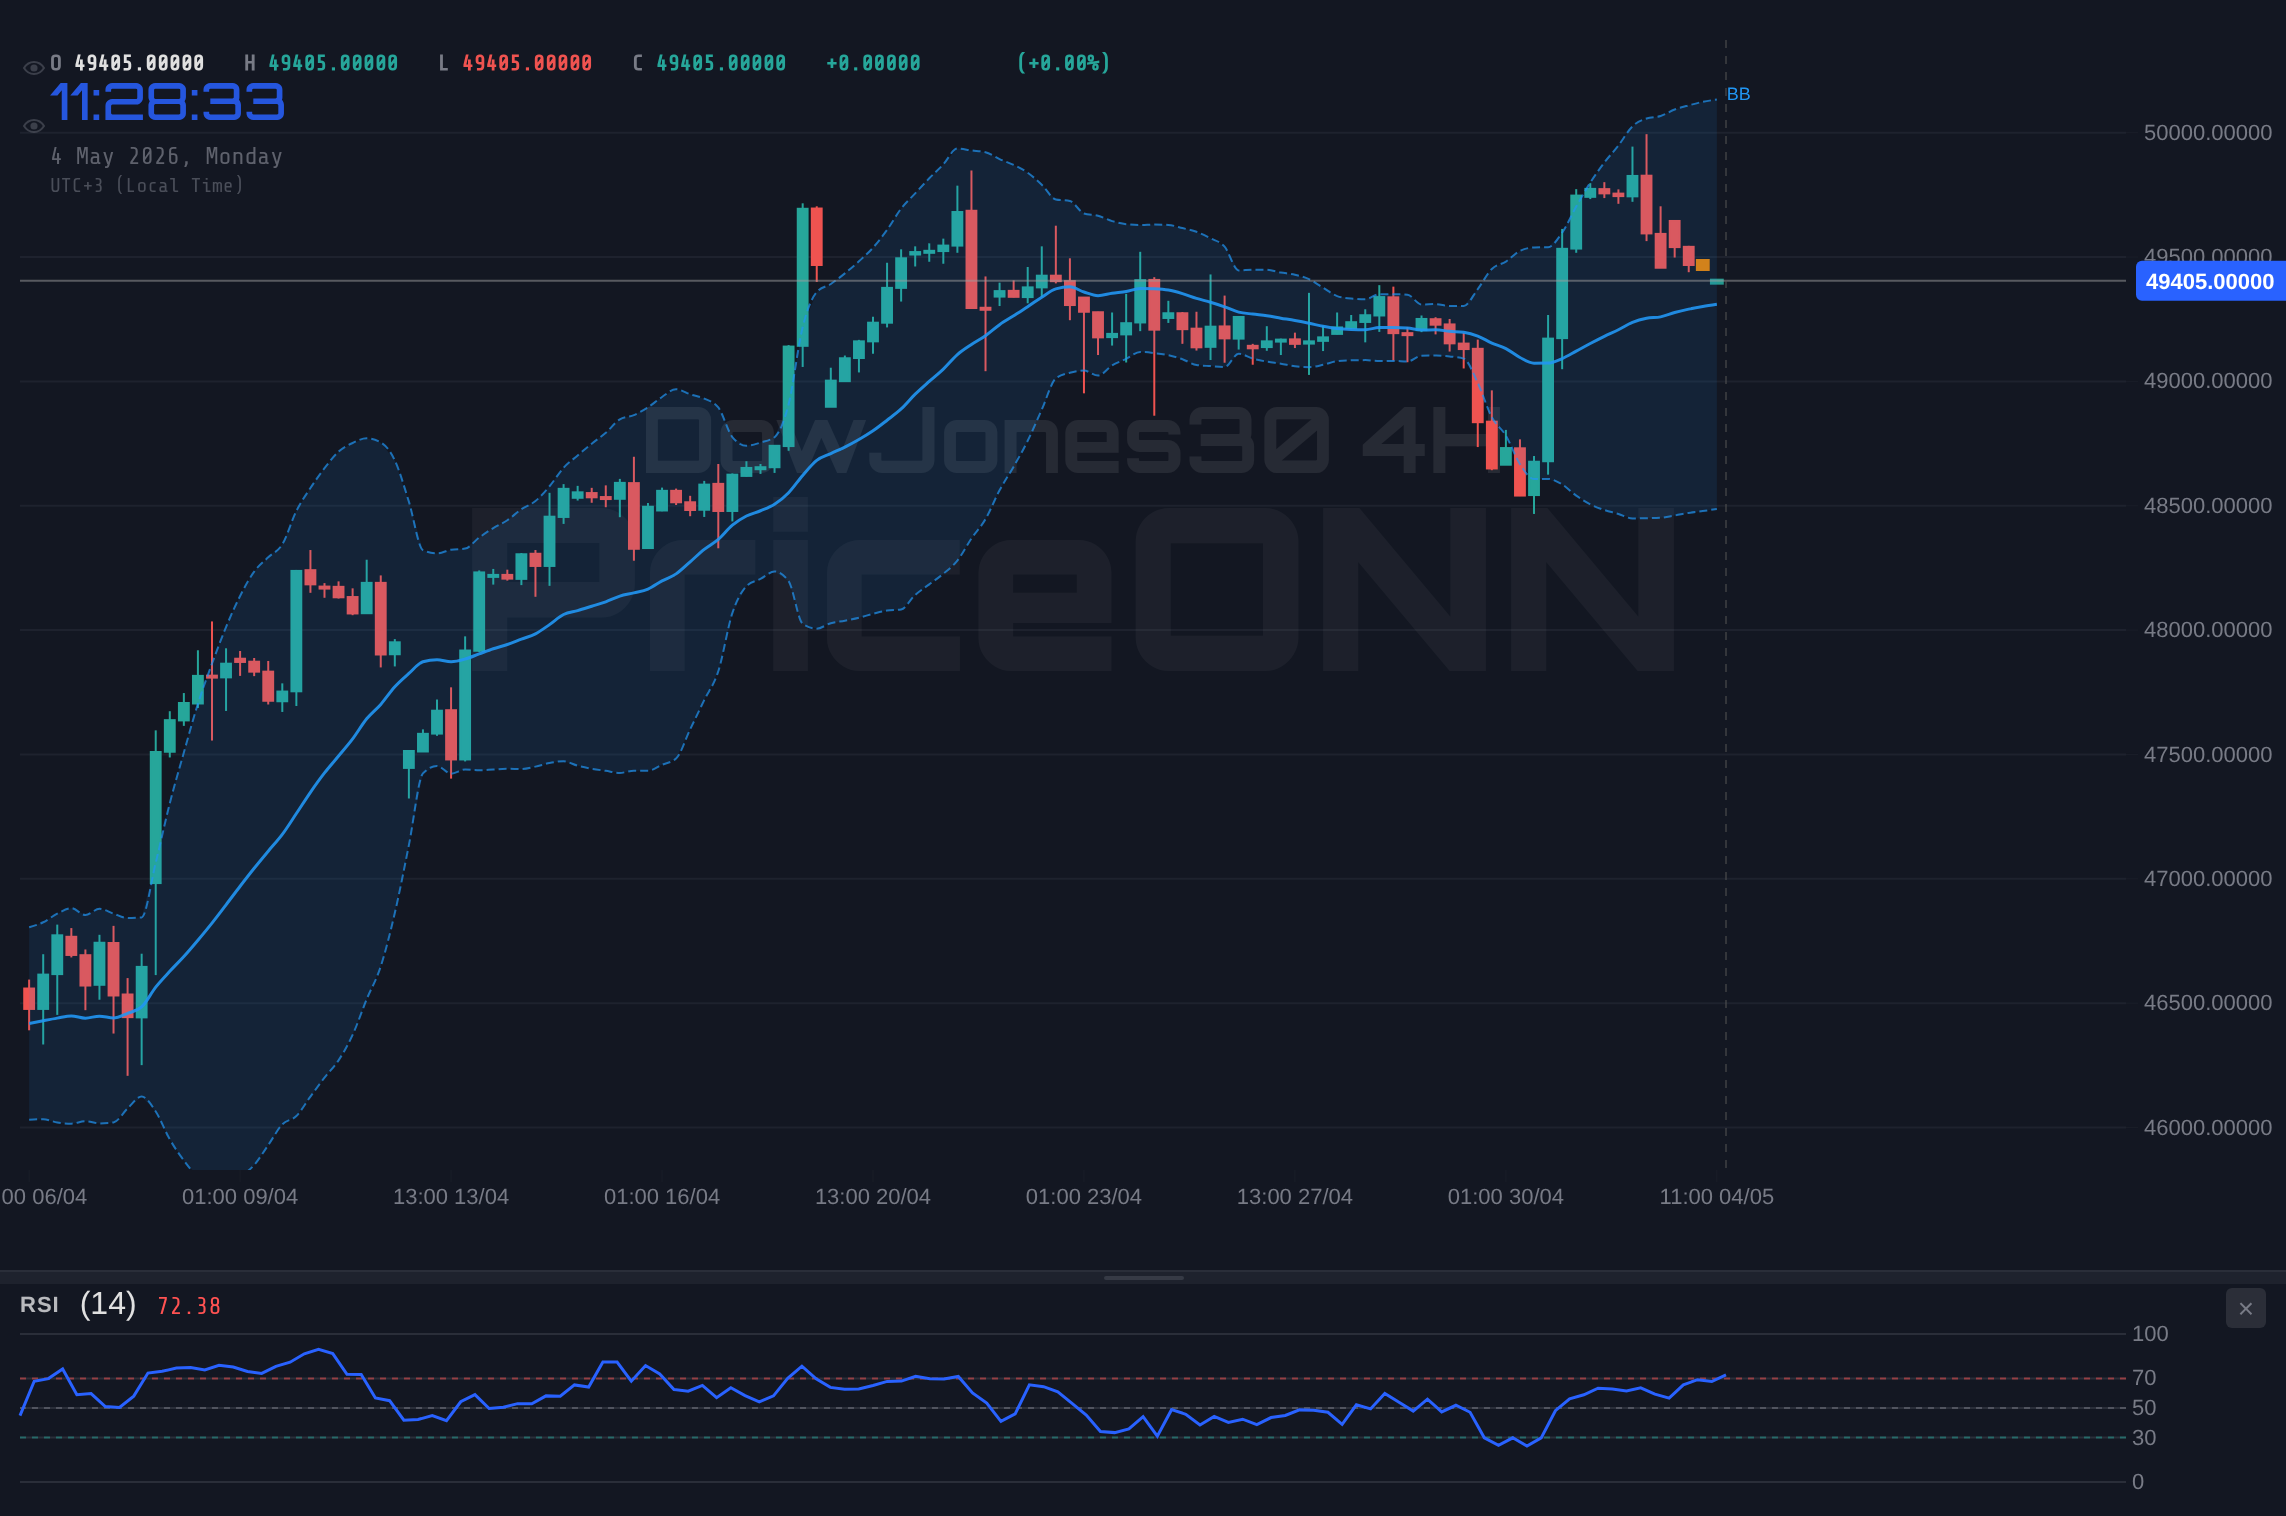
The 4-hour chart paints a similar picture, with a downtrend confirmed by an ADX of 23.47. The RSI at 29.91 signals oversold conditions, potentially setting the stage for a short-term bounce. However, the MACD histogram remains negative, suggesting that the underlying bearish momentum persists. Key levels to watch on this timeframe are resistance at 48,398 and support at 47,928. The "DowJones30 weekly outlook" hinges on whether these levels hold or give way to further selling pressure.
Looking at the daily timeframe, the trend is neutral, but the overall signal is to sell. The RSI at 35.13 indicates potential for further declines. The ADX is weak at 18, suggesting a lack of strong trend. This is important for DowJones30 trend analysis. Key support on the daily chart is found at 48,292, 47,721 and 47,338. Resistance is at 49,246, 49,629 and 50,200. The Stochastic is at 26.89, indicating a potential for a short-term bounce.
Traders should also pay close attention to the upcoming U.S. economic data releases. On Wednesday, the U.S. ADP Nonfarm Employment Change and Services Purchasing Managers Index (PMI) will provide insights into the strength of the labor market and the services sector. Any significant deviation from expectations could trigger sharp market reactions. The market will also be looking for U.S. ISM Non-Manufacturing Prices and Purchasing Managers Index to provide an overview of the manufacturing sector. Furthermore, the U.S. Crude Oil Inventories will be of importance due to the tensions in the Middle East.
Thursday's U.S. Initial Jobless Claims data will offer another glimpse into the labor market's health. On Friday, U.S. Retail Sales MoM and Core Retail Sales MoM data will shed light on consumer spending trends. These data points will be crucial in shaping market expectations for the Fed's next policy move. As the Financial Times suggests, the market is increasingly sensitive to any signals that could influence the central bank's decision-making process.
The current market environment demands a cautious approach. While the DowJones30 is showing signs of oversold conditions in the short term, the underlying geopolitical risks and the strengthening dollar continue to exert downward pressure. Investors should closely monitor the upcoming economic data releases and be prepared to adjust their positions accordingly. The "DowJones30 price forecast" is inherently uncertain in this environment, but a disciplined approach to risk management is essential.
For scalpers, the immediate support and resistance levels on the 1-hour chart provide potential trading opportunities. Swing traders should focus on the 4-hour chart and look for confirmation signals before entering or exiting positions. Long-term investors may find current levels attractive for building positions, but should be mindful of the potential for further downside risk.
DowJones30 market sentiment is currently bearish, reflecting the prevailing risk aversion. However, this sentiment could shift quickly depending on developments in the Middle East and the outcome of the upcoming economic data releases. Therefore, traders should remain flexible and adapt their strategies to the evolving market conditions.
Geopolitical risks are inherently unpredictable and can trigger sudden market movements. Always use stop-loss orders and manage your position size appropriately.
Frequently Asked Questions: DowJones30 Analysis
Is DowJones30 a good buy right now?
Given the current geopolitical tensions and downtrend, DowJones30 is not a straightforward buy. While oversold conditions exist, waiting for a confirmed reversal signal above the 48,033.33 resistance is prudent before considering long positions.
What is the DowJones30 price forecast for this week?
The DowJones30 price forecast for this week is cautiously bearish, with a potential range between 47,271.33 and 48,398. A break below 47,271.33 could trigger further downside towards 47,000. Upside potential is capped by geopolitical uncertainty.
What are the key support and resistance levels for DowJones30?
Key support levels for DowJones30 are at 47,652.33, 47,509.67, and 47,271.33. Resistance levels are at 48,033.33, 48,271.67, and 48,414.33. These levels are based on the 1-hour chart and may shift with new data.
Why is DowJones30 moving today?
DowJones30 is moving lower today primarily due to escalating tensions in the Middle East, which are boosting safe-haven demand for the US dollar and prompting investors to reduce their exposure to risk assets like equities.
While the near-term outlook is clouded by uncertainty, disciplined risk management and a patient approach will be rewarded. Markets are cyclical, and every downturn presents opportunities for those who are prepared. By carefully monitoring the key levels and economic data releases, investors can navigate these choppy waters and position themselves for future gains. The key is to wait for the right moment, manage risk, and let the market come to you.
Track markets in real-time
AI-powered analysis, technical indicators and real-time price data.
Join Our Telegram Channel
Breaking market news, AI analysis and trading signals instantly.
Join Channel