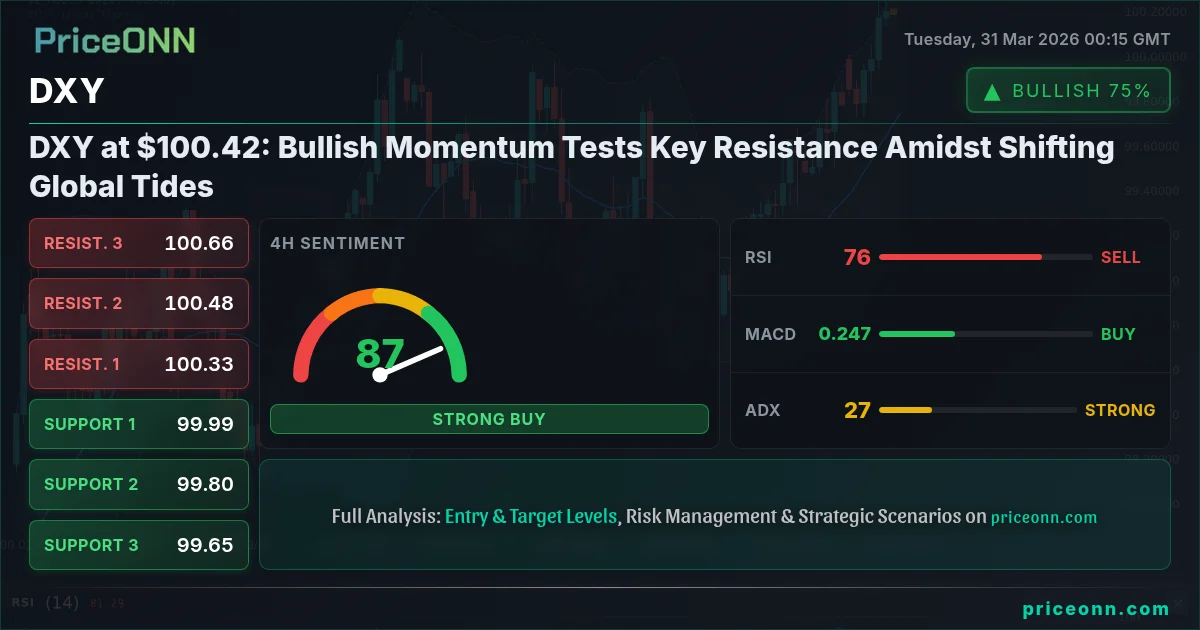
DXY at $100.42: Bullish Momentum Tests Key Resistance Amidst Shifting Global Tides
The Dollar Index (DXY) holds at $100.42, with bulls eyeing resistance near $100.66. Technicals suggest a strong uptrend, but overbought conditions and upcoming data warrant caution.
Is the Dollar Index (DXY) poised for another leg higher, or are we on the cusp of a significant pullback? This is the central question traders are grappling with as DXY hovers around the critical $100.42 mark. Having shown remarkable resilience and a clear upward trajectory, the DXY's technical indicators are flashing mixed signals, creating a fascinating battleground between bulls and bears. This analysis dives deep into the current market sentiment, historical patterns, and the crucial technical levels that will dictate the DXY's next move, aiming to provide clarity in a market environment shaped by shifting geopolitical landscapes and evolving central bank policies.
- The DXY is currently trading at $100.42, with 1-hour and 4-hour charts showing strong bullish signals, while the daily chart indicates a powerful downtrend.
- Key resistance is forming around $100.66, while crucial support lies at $99.99.
- RSI at 75.71 on the 4-hour chart signals overbought conditions, suggesting potential for a short-term pullback despite the overall bullish trend.
- Geopolitical tensions and evolving central bank expectations are key drivers, with analysts watching for any shifts that could impact the dollar's safe-haven appeal.
The narrative surrounding the US Dollar Index (DXY) is one of persistent strength, yet it's a narrative fraught with complexity. On one hand, the dollar has benefited from its safe-haven status amidst escalating global geopolitical risks and a general risk-off sentiment pervading financial markets. On the other hand, the sustainability of this strength is being questioned as the DXY flirts with overbought territory on multiple timeframes, and the market anticipates potential shifts in central bank policies. This delicate balance is creating a tug-of-war, with bulls pushing the index higher while bears look for opportunities to capitalize on potential exhaustion. Understanding the interplay between these forces is paramount for any trader looking to navigate the current FX landscape.
The Bull Case: Riding the Wave of Safe-Haven Demand
The bullish argument for the DXY is compelling, primarily anchored in the prevailing global economic and geopolitical climate. With tensions simmering in the Middle East and broader geopolitical uncertainties casting a shadow over global markets, investors are naturally gravitating towards the US dollar as a perceived safe haven. This increased demand for dollar-denominated assets, including US Treasuries, bolsters the DXY's value. The data supports this narrative: the DXY has demonstrated a strong upward trend, particularly on the daily timeframe where the ADX at 32.77 indicates a robust trend. The 1-hour and 4-hour charts also show positive momentum, with MACD positioned above its signal line and Bollinger Bands indicating an upward bias. The Stochastic Oscillator on both these timeframes is in overbought territory (K=86.33, D=81.53 on 1H; K=91.43, D=83.03 on 4H), which typically suggests a potential for a pause or reversal, but in a strong trend, it can also signal sustained buying pressure.
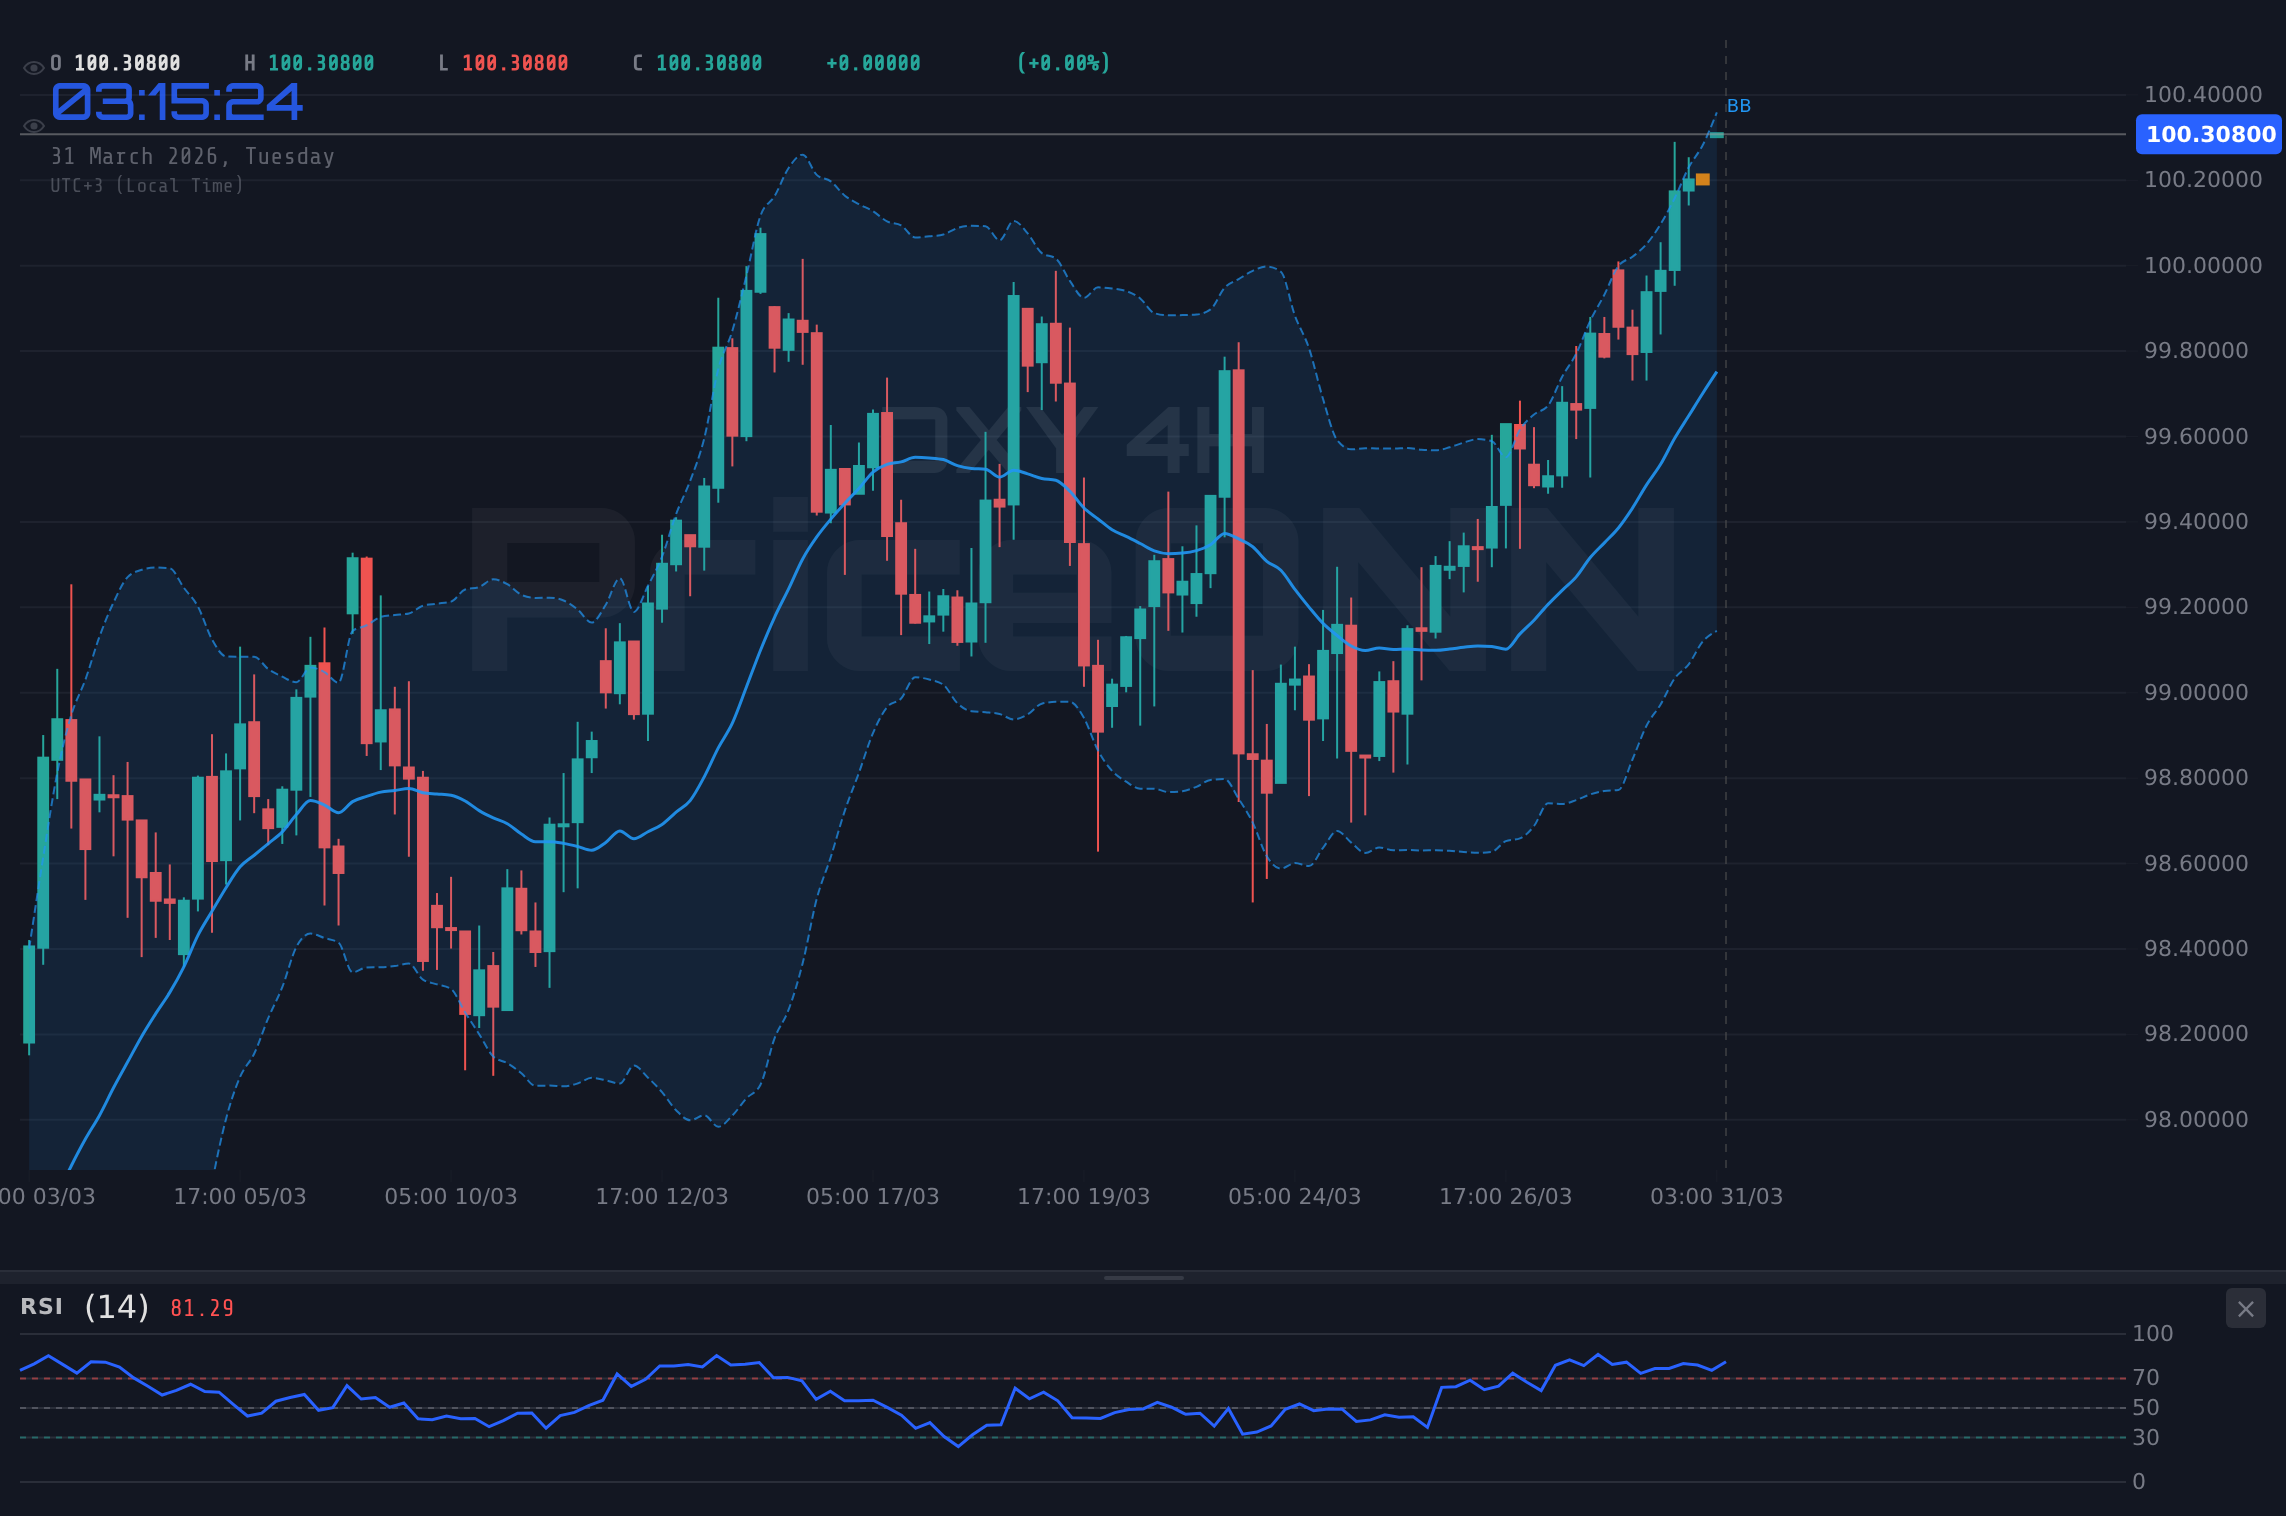
Furthermore, the divergence in monetary policy expectations between the Federal Reserve and other major central banks continues to support the dollar. While some central banks are contemplating or enacting easing cycles, the Fed has maintained a more hawkish stance, or at least a data-dependent approach that leaves room for higher-for-longer interest rates. This yield differential makes dollar-denominated investments more attractive, drawing capital into the US economy and, by extension, strengthening the DXY. The current price of $100.42 is above the 4-hour middle Bollinger Band, reinforcing the bullish sentiment on this timeframe. The RSI(14) at 75.71 on the 4-hour chart, while signaling overbought conditions, also confirms the strength of the current upward move. This confluence of factors - safe-haven demand, favorable yield differentials, and strong technical momentum on shorter timeframes - paints a picture of continued dollar strength.
Looking at the specific technicals, the DXY is currently trading at $100.42. On the 1-hour chart, the ADX at 42.43 signifies a strong trend, and the Stochastic Oscillator is in the overbought zone, indicating strong buying momentum. The MACD is above its signal line, further supporting the bullish case. On the 4-hour chart, the ADX is a bit weaker at 27.3, but still shows a strong trend. The Stochastic is also overbought, and the MACD remains positive. The daily chart, however, presents a more nuanced view. While the trend is strong (ADX 32.77), the RSI at 65.33 is in neutral territory, suggesting room for further upside before becoming overbought on this longer timeframe. The key resistance level to watch on the upside is around $100.66, with a break and hold above this level potentially opening the door for further gains towards $100.96. The ability of bulls to sustain price action above the current levels will be crucial in validating this upward trajectory.
The Bear Case: Overbought Conditions and Shifting Sands
Despite the impressive run, there are significant reasons for caution. The most glaring bearish signal comes from the overbought Stochastic readings on the 1-hour and 4-hour charts, coupled with the RSI(14) on the 4-hour chart sitting at 75.71. Extreme readings in these oscillators often precede pullbacks or consolidations as the market takes a breather. While strong trends can extend overbought conditions, they also increase the risk of sharp reversals. A failure to break decisively above the immediate resistance at $100.66 could lead to profit-taking, triggering a move back towards the support at $99.99, which has proven to be a critical pivot point. The daily chart, though showing a strong trend, has an RSI of 65.33, which, while not overbought, is approaching the upper bounds where the market can become more sensitive to negative news.
Moreover, the geopolitical landscape, while currently favoring the dollar, is inherently volatile. Any de-escalation of tensions or positive developments on the diplomatic front could rapidly diminish the safe-haven appeal of the dollar, leading to a swift unwinding of long positions. This is a classic risk-on scenario that would typically see investors rotate into riskier assets, weakening the DXY. On the fundamental side, while Fed policy remains a supportive factor, any indication from Fed officials of a less hawkish stance or a pivot towards rate cuts sooner than expected could severely impact the dollar. Market participants are constantly scrutinizing economic data - inflation figures, employment reports, and growth indicators - for clues about the Fed's future path. A weaker-than-expected US economic report could fuel speculation of earlier rate cuts, putting downward pressure on the DXY.
The MACD indicator also presents a point of concern. While it shows positive momentum on the 1-hour and 4-hour charts, it's hovering just above the signal line, suggesting that the bullish momentum might be losing steam. On the daily chart, the MACD is positive but the histogram is narrowing, which could precede a bearish crossover. The ADX, while indicating a strong trend on the daily (32.77), is not exceptionally high, meaning the trend's strength could be tested. A break below the 4-hour support level of $99.99 would be a significant bearish signal, potentially accelerating losses towards the next support at $99.80. This level is particularly important as it represents the midpoint of the daily Bollinger Bands and a psychological barrier.
Technical Crossroads: Where the Data Leads
The DXY is at a fascinating technical crossroads. On the shorter timeframes (1H and 4H), the trend is clearly bullish, supported by MACD crossovers and Stochastic oscillators in overbought territory. The ADX readings confirm a strong trend is in place. The immediate resistance at $100.66 is the key level bulls need to conquer. A decisive break above this, confirmed by increased volume and sustained price action, could propel the DXY towards $100.96. However, the daily chart paints a slightly more cautious picture. While the trend is strong, the RSI at 65.33 is not yet overbought, but it is approaching that zone. The Stochastic on the daily chart is showing a rising trend (K=85.65, D=51.98), but it’s not yet in extreme overbought territory. The critical support zone remains between $99.99 and $99.80. A daily close below $99.80 would invalidate the current bullish momentum and signal a deeper correction.
Bearish Scenario: Profit-Taking and Trend Reversal
25% ProbabilityNeutral Scenario: Consolidation Around Key Levels
35% ProbabilityBullish Scenario: Breakout Above Resistance
40% ProbabilityNavigating the Dollar's Path: A Trader's Perspective
From a trader's perspective, the current DXY setup demands a cautious yet opportunistic approach. The strong upward trend on shorter timeframes, coupled with safe-haven flows, presents a bullish bias. However, the overbought conditions on the 1H and 4H charts, especially the RSI at 75.71, signal that the market might be due for a correction or consolidation. The immediate resistance at $100.66 is the critical level to watch. A failure to break this could lead to a pullback towards $99.99. Conversely, a sustained break above $100.66, especially with a daily close, could signal the continuation of the bullish trend towards higher targets.
The correlation with other markets is also vital. A strengthening DXY typically puts pressure on gold (XAUUSD) and major currency pairs like EURUSD and GBPUSD. Currently, XAUUSD is trading around $4518.77 with mixed signals, and EURUSD is at $1.14534, showing a bearish trend on the daily. A continued rise in DXY could exacerbate these trends. Conversely, a sharp drop in the DXY could provide relief to these markets. Traders should pay close attention to upcoming economic data releases, particularly those related to inflation and Fed policy, as these could be catalysts for significant price movements. The ADX at 32.77 on the daily chart confirms a strong trend, but its moderate level suggests that the trend's conviction could be tested. Patience will be key; waiting for a clear break of either the support or resistance levels, or for confirmation from conflicting indicators, will be crucial for managing risk effectively.
The current market environment, characterized by geopolitical uncertainties and the potential for monetary policy divergence, creates a fertile ground for dollar strength. However, the technical indicators are flashing warning signs of potential exhaustion. The battle between bulls and bears at the $100.42 level will likely be decided by a combination of these fundamental drivers and technical price action. A decisive move above $100.66 could signal further upside, while a failure to do so and a subsequent break below $99.99 would suggest a near-term reversal. Traders must remain vigilant, manage their risk meticulously, and wait for clear signals before committing capital. The market always provides opportunities, but discipline and patience are the keys to capturing them.
Frequently Asked Questions: DXY Analysis
What happens if DXY breaks above the $100.66 resistance level?
A sustained break and daily close above $100.66 would invalidate the current consolidation and signal a continuation of the bullish trend. This could potentially target the next resistance at $100.96, driven by continued safe-haven demand and favorable yield differentials.
Should I buy DXY at current levels of $100.42, given the RSI at 75.71?
Buying at $100.42 with RSI at 75.71 carries significant risk due to overbought conditions on the 4-hour chart. A more prudent approach would be to wait for a pullback towards support around $99.99 or confirmation of a breakout above $100.66, offering a better risk-reward ratio.
Is the Stochastic Oscillator at 91.43 a strong sell signal for DXY on the 4-hour chart?
While Stochastic at 91.43 is in extreme overbought territory and suggests a potential reversal or consolidation, it can remain elevated in strong uptrends. It's a warning signal rather than an immediate sell signal, especially with the ADX at 27.3 indicating a strong trend. Confirmation from price action or other indicators would be needed.
How will upcoming German inflation data affect DXY this week?
Higher-than-expected German inflation could bolster the Euro, potentially weakening the DXY if it leads to expectations of tighter ECB policy. Conversely, if it fuels global inflation fears, it might paradoxically strengthen the DXY as a safe haven. Traders should monitor the actual figures closely for their impact on currency correlations.
Track markets in real-time
AI-powered analysis, technical indicators and real-time price data.
Join Our Telegram Channel
Breaking market news, AI analysis and trading signals instantly.
Join Channel