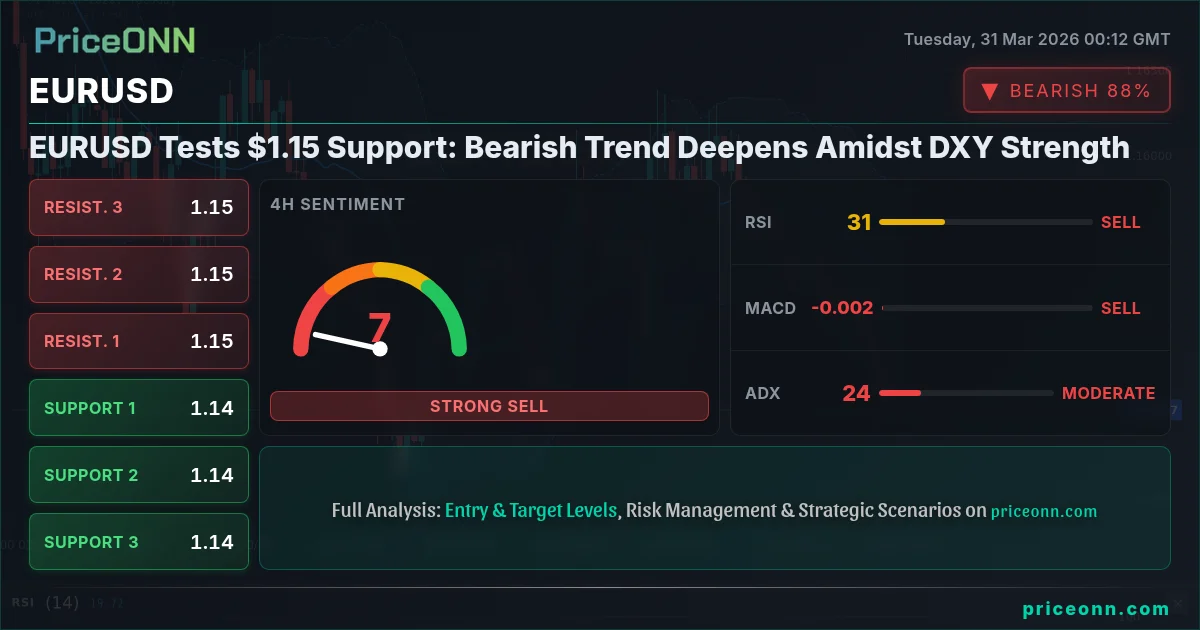
EURUSD Tests $1.15 Support: Bearish Trend Deepens Amidst DXY Strength
EURUSD is trading at $1.15, testing critical support levels. The bearish trend is intensifying as the DXY strengthens, with key indicators flashing sell signals.
EURUSD is currently trading at $1.15, a level that's increasingly coming under pressure as the broader market sentiment shifts. This move is occurring amidst a strengthening Dollar Index (DXY) and a generally risk-off environment, pushing the pair towards significant support zones. The technical picture across multiple timeframes suggests that the bearish momentum is building, making the $1.1488 level a crucial point to watch in the immediate term. Investors and traders are closely monitoring this pair as it navigates a complex macroeconomic landscape, where inflation concerns and central bank policies continue to dictate currency movements.
- EURUSD is trading at $1.15, with bearish momentum intensifying across timeframes.
- Critical support sits at $1.14565 on the 1H chart, tested multiple times.
- The RSI at 30.93 (1H) and 31.07 (4H) signals oversold conditions, but trend strength (ADX > 23) suggests further downside is possible.
- DXY strength at 100.41 is a key driver, putting pressure on the Euro.
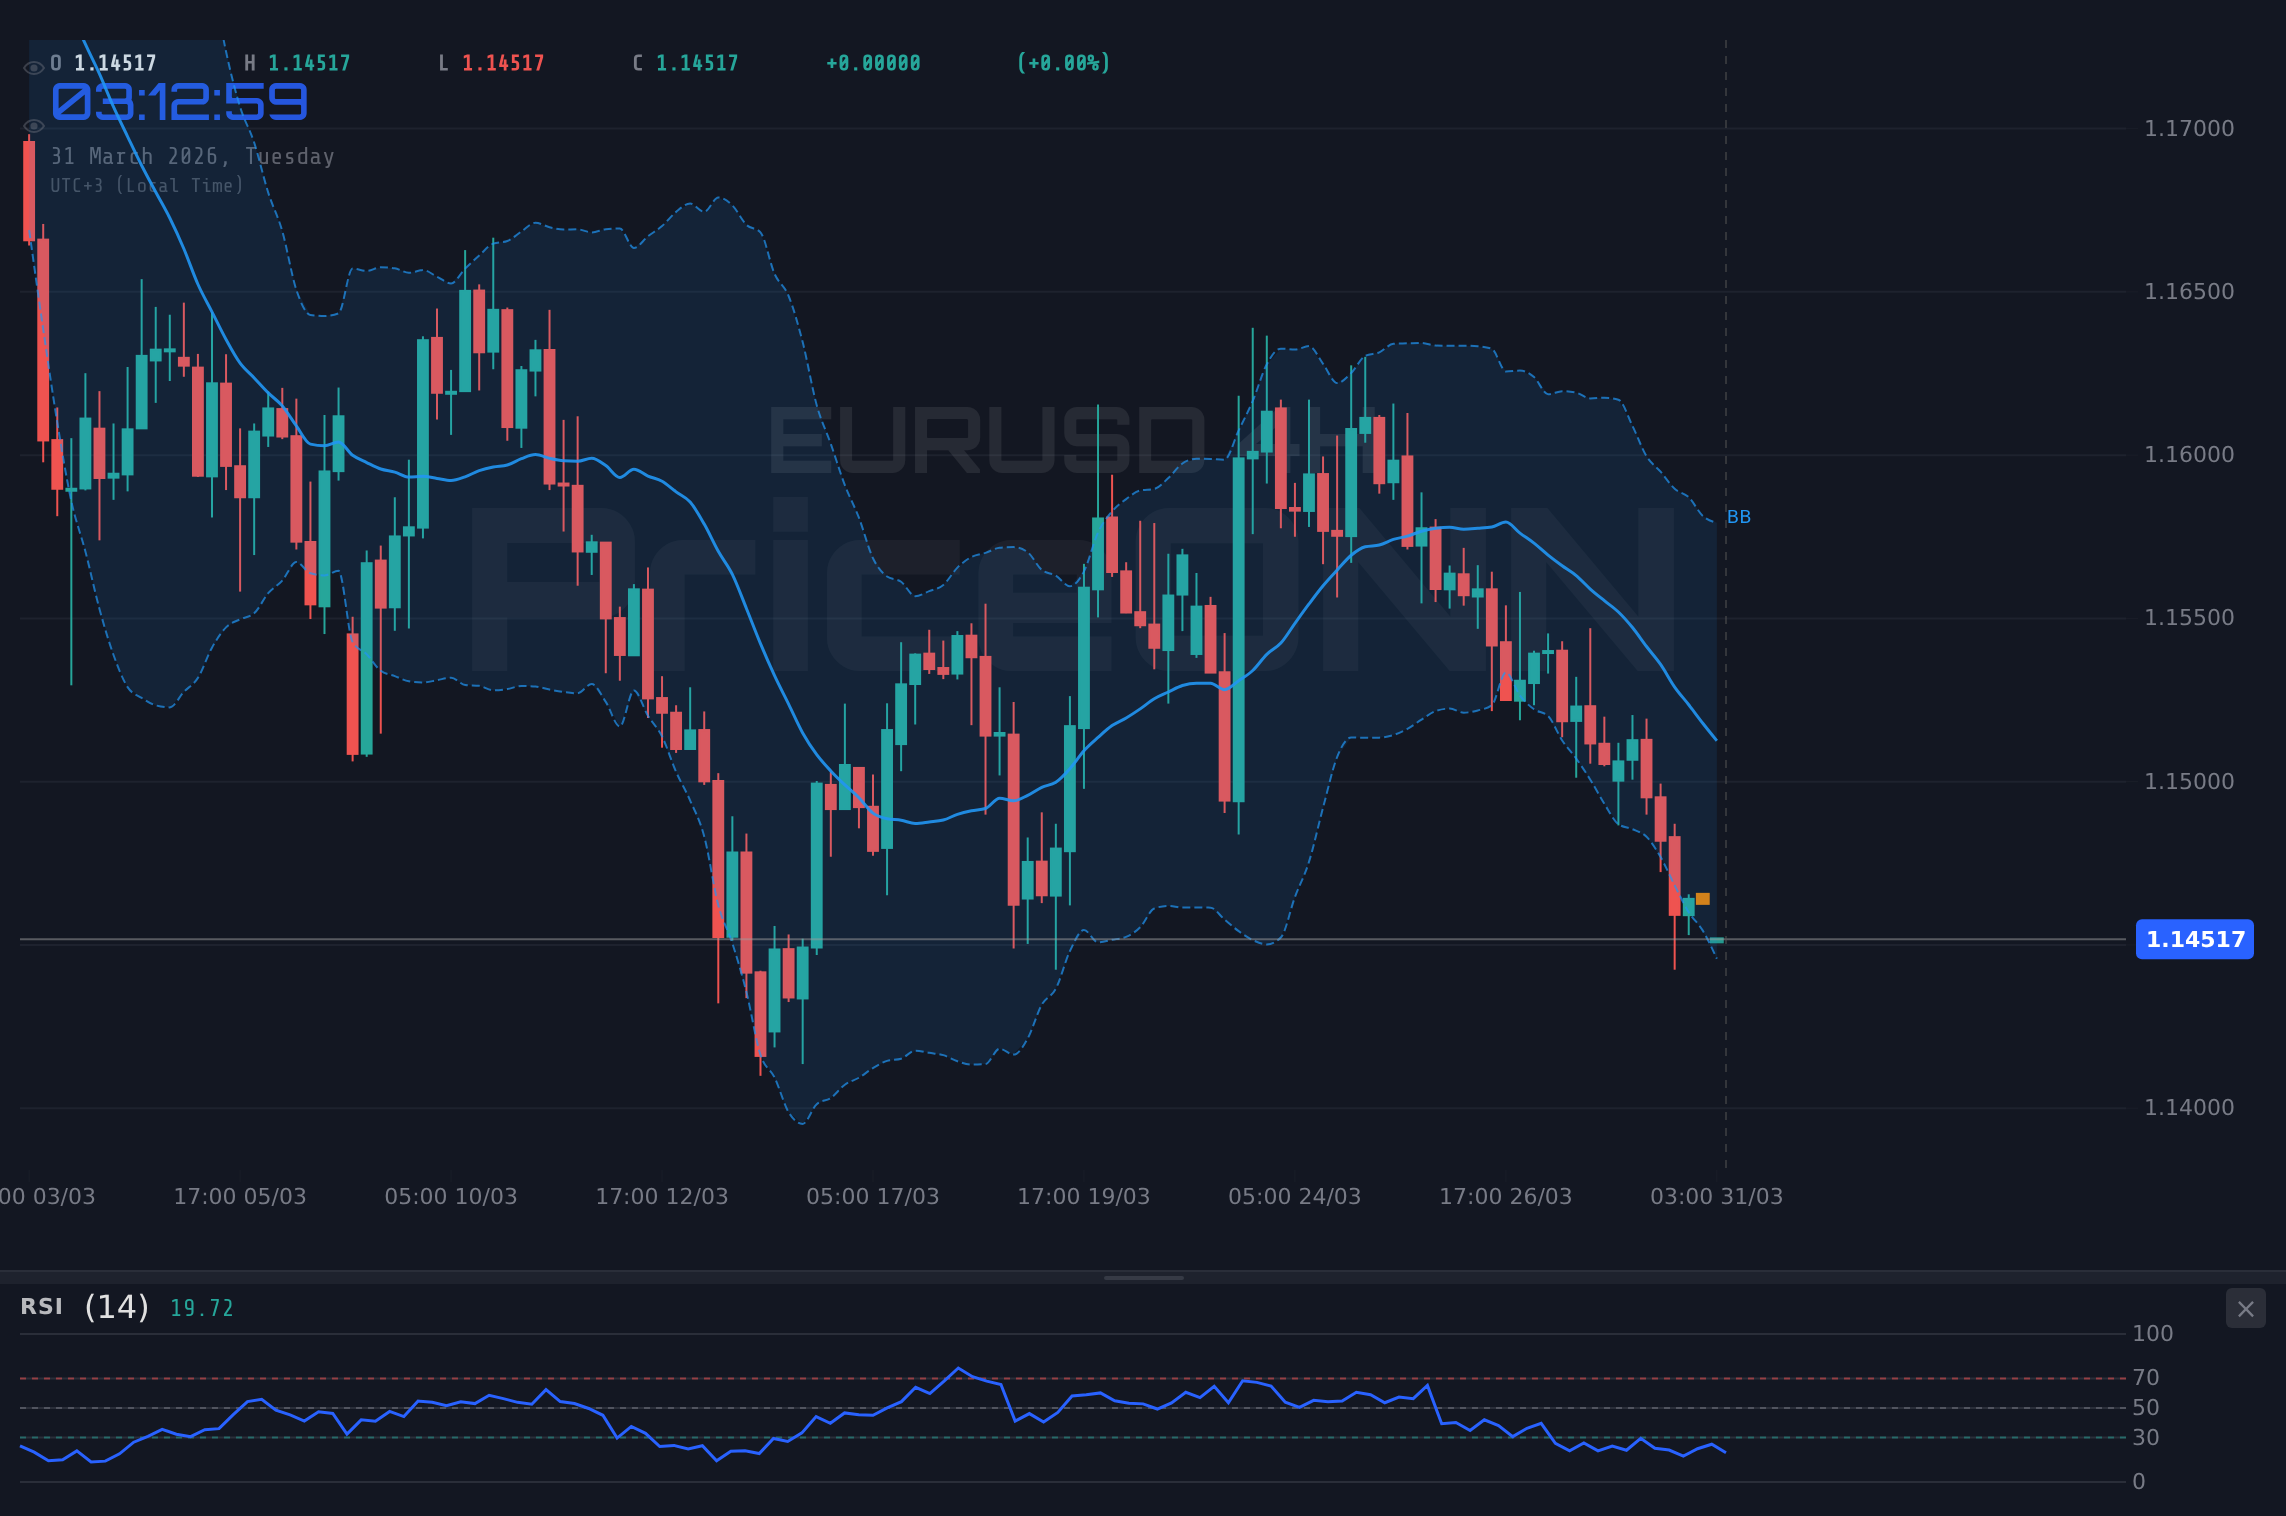
The recent action in EURUSD paints a clear picture of downward pressure. On the 1-hour chart, the pair has established a bearish trend with an ADX reading of 33.4, indicating a strong directional move is in play. The current price of $1.15 is finding initial footing near the $1.14565 support level, but the overall trend strength suggests this might be a temporary reprieve. The MACD histogram is showing negative momentum, reinforcing the bearish sentiment. While the Stochastic Oscillator is signaling a potential bounce with %K above %D, its position in the oversold territory (K=50.98, D=38.78 on 1H) needs to be viewed cautiously in the context of the prevailing downtrend. The Bollinger Bands are also positioned below the middle band, further confirming the bearish inclination on this shorter timeframe.
Drilling down to the 4-hour timeframe, the bearish narrative for EURUSD becomes even more pronounced. The ADX at 23.61, while slightly lower than the 1H, still signifies a moderate downtrend. The price is hovering precariously close to the $1.14387 support level, with the next significant floor seen at $1.14182. The RSI(14) at 31.07 is firmly in oversold territory, a reading that typically precedes a reversal. However, the MACD is currently displaying negative momentum, with the MACD line below its signal line, and the Bollinger Bands are hugging the lower band, indicating strong downward pressure and potential for further downside. The Stochastic Oscillator's %K (16.55) is below %D (19.74), reinforcing the bearish signal, though it's deep in oversold territory, suggesting sellers might be exhausted soon. This confluence of indicators on the 4-hour chart highlights the prevailing bearish bias, but also hints at a potential for a short-term bounce if key support levels manage to hold.
Looking at the daily chart, the EURUSD pair is entrenched in a strong downtrend, evidenced by the 100% trend strength and an ADX of 34.6. The current price of $1.15 is well below the key resistance levels, with the nearest significant hurdle at $1.14887. The support levels are significantly lower, with the first major floor at $1.14721 and a more robust one at $1.14429. The RSI(14) is at 37.14, suggesting room for further decline before reaching extreme oversold conditions. MACD shows positive momentum, which seems contradictory, but it's still below its signal line, indicating bearish pressure. The Bollinger Bands are below the middle band, aligning with the downtrend. The Stochastic Oscillator's %K (31.71) is below %D (63.15), confirming the bearish bias. This daily perspective underscores the dominant bearish trend, but also the potential for a relief rally if the oversold conditions on shorter timeframes begin to exert influence.
The Dollar's Ascent: A Key Driver for EURUSD
The persistent strength of the US Dollar Index (DXY) is undeniably a primary catalyst behind the EURUSD's struggles. Currently trading at 100.41, the DXY shows a strong upward trend on all analyzed timeframes, with its 1-day chart exhibiting 100% trend strength and a robust ADX of 32.76. On the 1-hour and 4-hour charts, the DXY is showing signs of overbought conditions with RSI readings above 75 and Stochastic %K above 85. This indicates that while the dollar is strong, it might be approaching short-term exhaustion, potentially offering a brief respite for EURUSD. However, the overall upward trajectory of the dollar suggests that any rallies in EURUSD might be met with renewed selling pressure as long as the DXY remains in a strong bullish trend. The correlation between a strengthening dollar and a weakening EURUSD is a well-established market dynamic, and it's currently playing out with significant force.
This dollar strength is not happening in a vacuum. It's underpinned by a combination of factors, including relative interest rate differentials and a global appetite for safe-haven assets. While specific Fed rate hike expectations aren't explicitly detailed in the provided market data, the general trend of dollar appreciation often aligns with expectations of tighter monetary policy or a 'higher for longer' interest rate environment. Traders are constantly assessing the Fed's stance, and any hints of hawkishness tend to bolster the dollar. Conversely, signs of economic weakness or geopolitical instability often drive capital towards the perceived safety of the US dollar, further pressuring pairs like EURUSD. The current market data shows the DXY is in a strong bullish trend, and until this trend shows clear signs of reversal, EURUSD will likely face headwinds.
The implication of a strong DXY for EURUSD is direct and often pronounced. As the dollar strengthens, it requires more Euros to purchase the same amount of dollars, thereby pushing the EURUSD exchange rate lower. This relationship is crucial for anyone trading the Euro or the US dollar. When we see the DXY pushing towards higher levels, as it is now at 100.41, it's a signal to anticipate potential weakness in EURUSD. The fact that the DXY is showing overbought signals on shorter timeframes (1H and 4H) suggests that the dollar's ascent might pause or even retrace slightly. However, the daily chart's bullish trend and strong ADX indicate that the underlying strength remains intact. Any significant pullback in the DXY would be a prerequisite for a sustained recovery in EURUSD, and traders are keenly watching for such shifts.
Navigating the Technical Landscape: Key Levels and Indicators
The technical indicators on EURUSD present a mixed but predominantly bearish outlook. On the 1-hour chart, the RSI at 30.93 is deep in oversold territory, suggesting a potential short-term bounce. However, this is countered by the ADX of 33.4, which signals a strong trend, implying that oversold conditions might persist longer than usual in a trending market. The MACD is negative, and the Stochastic Oscillator's %K is above %D, but both are in oversold zones. The situation on the 4-hour chart is similar, with RSI at 31.07 also in oversold territory, yet the ADX at 23.61 still indicates a moderate downtrend. The MACD is negative, and the Stochastic is showing a bearish crossover in oversold conditions. The daily chart, however, paints the clearest picture: a strong downtrend (ADX: 34.6) with RSI at 37.14 and Stochastic %K below %D, confirming the bearish bias. The confluence of these indicators, particularly the strong ADX across timeframes, suggests that while oversold conditions might tempt buyers, the path of least resistance remains to the downside.
The price action itself is telling a crucial story. On the 1-hour chart, EURUSD is testing support around $1.14565. A break below this level could quickly lead to a retest of $1.14543 and potentially $1.14501. Resistance on this timeframe is capped around $1.14629. The 4-hour chart shows support at $1.14387, $1.14182, and $1.13940. Resistance is seen higher up, around $1.14834 and $1.15076. On the daily chart, the critical support levels are $1.14887, $1.14721, and $1.14429. The resistance levels are higher, starting at $1.15345. The current price of $1.15 is sitting just above the immediate 1-hour support, but within the larger daily support zone. A decisive break below the $1.14565 level on the 1H chart would be a significant bearish signal, potentially triggering further liquidation towards the daily support levels. Conversely, a sustained move back above $1.14834 on the 4H chart would be the first sign of a potential reversal, targeting higher resistance.
The divergence in signals between oscillators like Stochastic and trend strength indicators like ADX is a key point of analysis. For instance, Stochastic on the 1-hour chart shows a bullish signal (%K > %D) and is in oversold territory, which might suggest a buying opportunity. However, the strong ADX of 33.4 and the bearish MACD momentum override this short-term bullish signal. This is where experienced traders differentiate themselves; they don't blindly follow one indicator but assess the confluence of signals and the prevailing trend. The fact that the daily chart clearly shows a strong downtrend with an ADX of 34.6 is the dominant factor. Therefore, any oversold signals on shorter timeframes should be treated as potential temporary pauses in the downtrend rather than definitive reversal signals, unless confirmed by price action breaking key resistance levels.
Trade Scenarios and Probabilities
Bearish Scenario: Downward Momentum Continues
65% ProbabilityNeutral Scenario: Consolidation and Range-Bound Trading
25% ProbabilityBullish Scenario: Short-Term Reversal Attempt
10% ProbabilityThe current market conditions, particularly the strong downtrend on the daily chart and the persistent strength of the DXY, favor the bearish scenario. However, the oversold readings on shorter timeframes introduce a non-negligible probability for consolidation or a short-lived bounce. Traders should pay close attention to the price action around the $1.14565 and $1.14834 levels, as these will likely dictate the immediate direction of EURUSD. The macroeconomic calendar also plays a role; upcoming data releases could provide the catalyst needed to break out of the current range or confirm the prevailing trend.
Macroeconomic Context: What's Driving the Dollar?
While the technicals provide a clear roadmap, understanding the underlying macroeconomic drivers is essential for a comprehensive EURUSD analysis. The provided economic calendar highlights a relatively quiet period for high-impact events today, March 31st, 2026. However, the recent news feed indicates potential volatility ahead. A Reuters report on March 30th mentioned that the Euro might face turbulence ahead of crucial German inflation data, projected to surge. This is a critical development. German inflation figures, being a major component of Eurozone inflation, could significantly influence the European Central Bank's (ECB) monetary policy outlook. If inflation indeed surges, it could lead to expectations of a more hawkish ECB stance, potentially bolstering the Euro. However, this must be weighed against the current strong dollar trend.
The market is constantly digesting information related to inflation and central bank policies. The strong DXY at 100.41 is a testament to the current market's pricing of relative economic strength and monetary policy expectations. While specific Fed futures data isn't provided, the general trend suggests the market might be anticipating a hawkish stance from the Fed, or at least a 'higher for longer' rate environment, which supports the dollar. On the other hand, if upcoming Eurozone inflation data suggests a more persistent inflationary environment, it could theoretically lead to expectations of tighter ECB policy. This would be a bullish factor for the Euro. However, the immediate technical picture and the current DXY strength are overpowering these potential fundamental shifts, keeping EURUSD under pressure.
The interplay between inflation data and central bank responses is a delicate dance. A surge in German inflation, as hinted at by the news, could complicate the ECB's decision-making. While higher inflation might normally lead to hawkish policy expectations, the broader economic growth outlook and the need to maintain competitiveness against a strong dollar also factor in. Traders will be dissecting any German inflation report for clues about the ECB's next move. If the data leads to increased expectations of ECB tightening, it could provide a much-needed tailwind for EURUSD, potentially challenging the current bearish trend and invalidating the bearish scenario outlined above. Until then, the dominant narrative remains one of dollar strength and Euro weakness, driven by the current technical setup and macroeconomic undercurrents.
FAQ: Understanding the EURUSD Outlook
What happens if EURUSD breaks below the $1.14565 support level?
A decisive break below the 1-hour support at $1.14565, especially with increased volume, would likely confirm the continuation of the bearish trend. This could trigger further selling pressure, targeting the next significant support levels at $1.14387 and potentially $1.14182 on the 4-hour chart, as per our bearish scenario.
Should I consider buying EURUSD at current levels around $1.15 given the oversold RSI readings?
While the RSI is in oversold territory on shorter timeframes (1H and 4H), the strong daily downtrend (ADX 34.6) suggests caution. A contrarian buy at these levels would be risky unless confirmed by a clear break of resistance above $1.14834 and a shift in overall market sentiment, carrying only a 10% probability in our analysis.
Is the MACD signal at -0.0015 a sell signal for EURUSD right now?
The negative MACD histogram and line below the signal line on multiple timeframes, particularly the 1H and 4H charts, do indicate bearish momentum. While not a standalone sell signal, it aligns with the overall bearish trend and supports the view that further downside is more probable than a significant rally at this juncture.
How will potential surging German inflation affect EURUSD this week?
Surging German inflation could lead to expectations of a more hawkish ECB stance. If this materializes and is strong enough to outweigh the current DXY strength, it could provide a catalyst for EURUSD to break its bearish trend and target higher resistance levels around $1.15076. However, the market's reaction will depend heavily on the magnitude of the data and the ECB's subsequent communication.
| Indicator | Value | Signal | Interpretation |
|---|---|---|---|
| RSI (14) | 30.93 | Oversold | Potential bounce, but trend is strong |
| MACD Histogram | -0.0015 | Negative Momentum | Selling pressure continues |
| Stochastic (%K) | 50.98 | Mid Zone | Crossover suggests potential shift, but needs confirmation |
| ADX | 33.4 | Strong Trend | Directional move is dominant |
| Bollinger Bands | Below Middle | Bearish | Price below average, indicating downward pressure |
The EURUSD pair remains under significant bearish pressure, with the current price of $1.15 testing key support levels. The dominant trend on the daily chart, coupled with a strong DXY, points towards further downside potential. However, oversold conditions on shorter timeframes present a possibility for a short-term technical bounce or consolidation. Traders should remain vigilant, paying close attention to the $1.14565 support and $1.14834 resistance levels. Confirmation through price action and volume will be crucial in determining the next significant move. The upcoming German inflation data could be a wildcard, potentially shifting the narrative if it significantly alters expectations for ECB policy. Always prioritize risk management and wait for clear setups.
Track markets in real-time
AI-powered analysis, technical indicators and real-time price data.
Join Our Telegram Channel
Breaking market news, AI analysis and trading signals instantly.
Join Channel