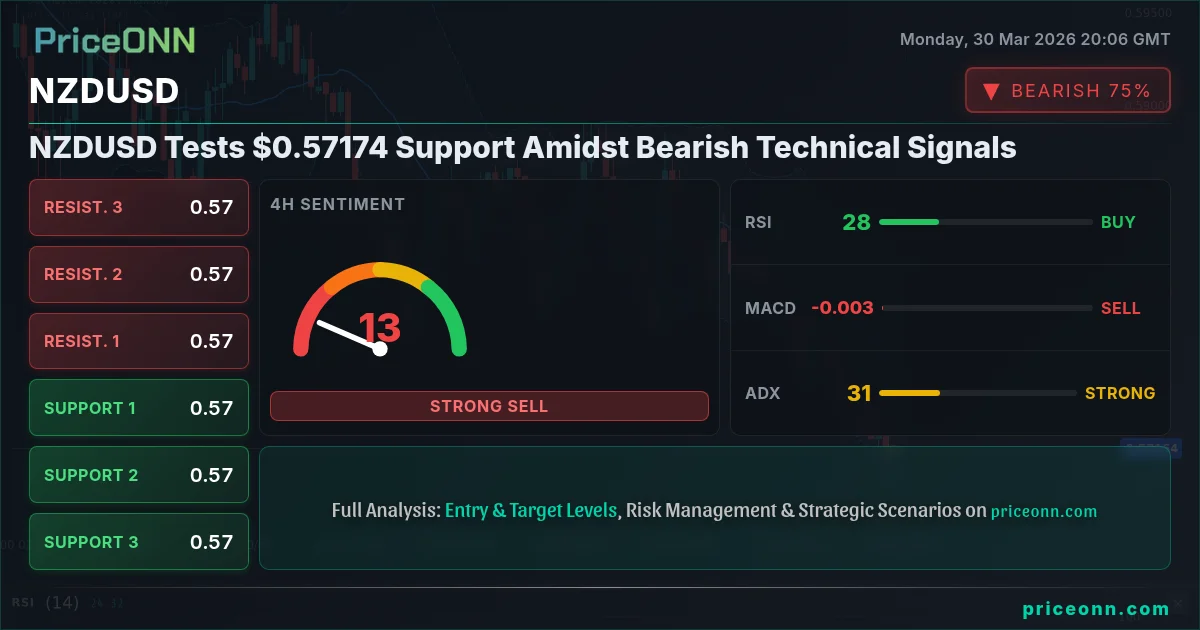
NZDUSD Tests $0.57174 Support Amidst Bearish Technical Signals
NZDUSD hovers near $0.57174, with a bearish outlook reinforced by RSI divergence and MACD weakness. Key support at $0.57149 faces pressure.
The New Zealand Dollar against the US Dollar (NZDUSD) is currently navigating a critical juncture, trading at precisely $0.57174. This level is not just a number; it represents a confluence of technical indicators and market sentiment that paints a decidedly bearish picture in the short to medium term. Having fallen from recent highs, the pair is now testing crucial support levels, and the evidence from multiple timeframes suggests the bears might be gaining the upper hand. The question on every trader's mind is whether this bearish bias will hold, or if a bounce is imminent.
- NZDUSD is trading at $0.57174, with a bearish bias indicated across multiple timeframes.
- Key support sits at $0.57149, tested by the current price action, with further levels at $0.57073 and $0.57003.
- RSI readings are bearish: 36.61 (1H), 32.3 (4H), and 35.3 (1D), indicating downward momentum.
- MACD histogram on 1H shows positive momentum, but overall trend signals lean bearish, especially on Daily.
- The DXY's strength near 100.32 is a significant headwind for NZDUSD.
Navigating the Bearish Tide: A Multi-Timeframe Perspective
The 1-hour chart for NZDUSD presents a picture of immediate bearish pressure. The trend is firmly established as downwards, with a strength of 85% and an ADX reading of 28.33, indicating a robust downward trend. The RSI(14) at 36.61 is firmly in neutral territory but leaning towards oversold conditions, suggesting potential for a short-term bounce, yet the overall momentum is downwards. Stochastic K(56.11) crossing D(42) offers a tentative bullish signal, but this is overshadowed by the broader bearish context. The MACD histogram, while showing positive momentum, is still below the signal line, adding to the mixed signals on this timeframe. However, the overall signal leans heavily towards a 'SELL' (Al: 2, Sat: 6, Nötr: 0), reflecting the prevailing sentiment.
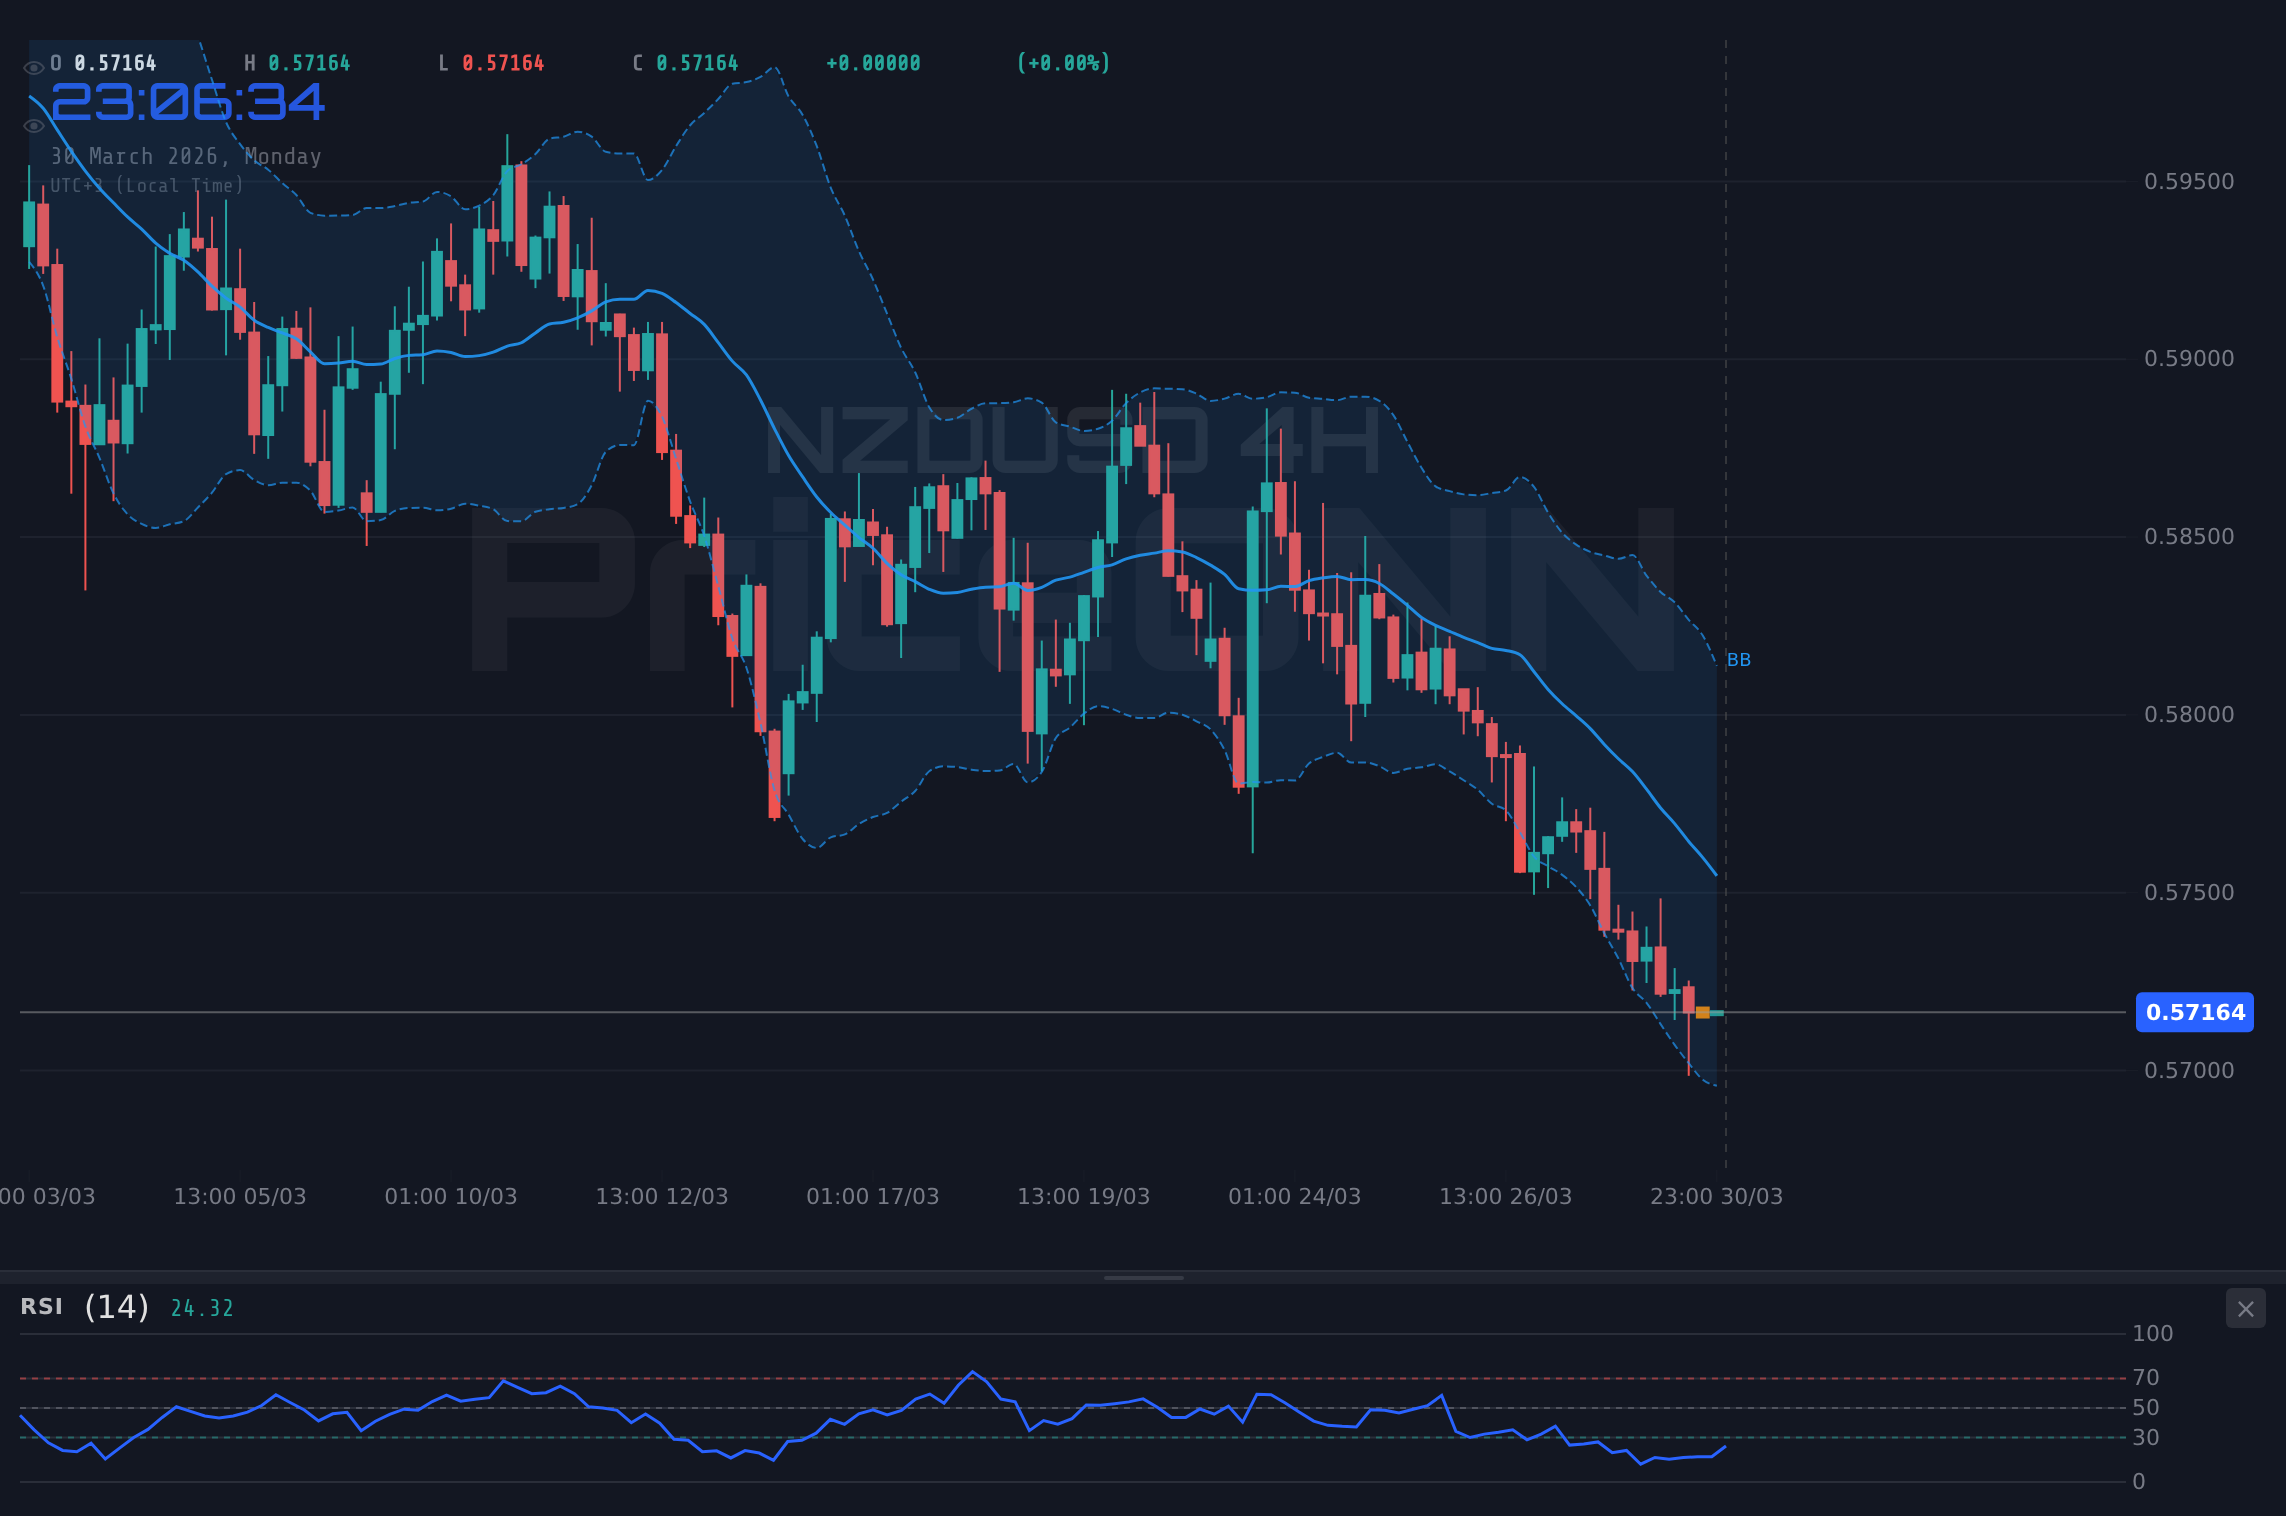
Delving into the 4-hour timeframe, the bearish narrative intensifies. Here, the trend is unequivocally downwards with 100% strength and a strong ADX of 30.96. The RSI(14) at 32.3 is even deeper into the neutral-to-oversold zone, reinforcing the idea that sellers are in control. The Stochastic oscillator shows %K at 12.88 and %D at 10.09, firmly in oversold territory and presenting a potential buy signal, but this is often a lagging indicator in strong trends. Crucially, the MACD is showing negative momentum and is below its signal line, aligning with the bearish outlook. The Bollinger Bands are also positioned below the middle band, indicating a bearish bias. The 4-hour chart's 'SELL' signal (Al: 2, Sat: 6, Nötr: 0) consolidates the short-term bearish view.
The daily chart, the ultimate arbiter of long-term trends, paints the most concerning picture for NZDUSD bulls. The trend is decisively downward with 98% strength, and the ADX at 36.94 signifies a powerful trend in motion. The RSI(14) at 35.3 remains in neutral territory, but its downward trajectory suggests further downside is probable before any significant oversold condition is reached. The MACD is deeply negative, with its histogram well below the signal line, confirming sustained selling pressure. Stochastic K(4.51) and D(29.55) are in oversold territory, hinting at a potential reversal, but within such a strong downtrend, these signals can persist for extended periods. The Bollinger Bands are also hugging the lower band, a clear sign of bearish dominance. The daily 'SELL' signal (Al: 0, Sat: 7, Nötr: 0) underscores the prevailing bearish sentiment and the significant risk for any counter-trend trades.
Key Levels and Price Action Dynamics
The current price of NZDUSD at $0.57174 is testing a critical support area. On the 1-hour chart, the first significant support level is identified at $0.57149. A breach below this level would likely trigger further selling pressure, potentially leading to a test of the next support at $0.57109, and subsequently $0.57080. These levels are not arbitrary; they represent historical price points where buying interest previously emerged. However, given the strength of the current downtrend, these may offer only temporary respite.
Conversely, for any bullish reversal to gain traction, NZDUSD must first overcome the immediate resistance. On the 1-hour chart, resistance is seen at $0.57192, followed by $0.57221 and then $0.57248. A sustained move above these levels would be required to invalidate the current bearish outlook and signal a potential short-term correction upwards. The daily chart resistance levels are significantly higher, with $0.57650, $0.57909, and $0.58050 marking key hurdles that appear distant in the current market environment.
The Influence of Macro Factors and Correlated Assets
The broader market sentiment, particularly the strength of the US Dollar Index (DXY), plays a pivotal role in the NZDUSD's trajectory. With the DXY currently holding firm near 100.32, buoyed by geopolitical tensions and the prospect of the Fed maintaining a hawkish stance, this provides a strong headwind for the risk-sensitive New Zealand Dollar. The DXY's upward momentum suggests that demand for safe-haven assets remains elevated, often at the expense of commodity-linked currencies like the NZD.
The recent surge in oil prices, with Brent Crude surpassing $116 and WTI nearing $103, driven by escalating geopolitical tensions in the Middle East, adds another layer of complexity. While higher commodity prices can sometimes benefit commodity currencies, the dominant narrative currently appears to be one of risk aversion. This environment favors the US Dollar as a safe haven, potentially exacerbating the downward pressure on NZDUSD. The correlation analysis indicates that a stronger DXY typically exerts downward pressure on NZDUSD, and the current DXY reading of 100.32 reinforces this relationship.
Furthermore, the performance of global equity markets, such as the S&P 500 and Nasdaq, serves as a barometer for risk appetite. The recent plunge in the Nasdaq by 12.5% from its January high, entering correction territory, signals a clear risk-off sentiment. This decline in major indices suggests that investors are shedding riskier assets, which typically includes currencies like the NZD, in favor of safer havens like the USD. This broad market deleveraging reinforces the bearish technical signals observed in NZDUSD.
Trade Scenarios: Navigating the Potential Paths Forward
Bearish Scenario: Downside Momentum Builds
65% ProbabilityNeutral Scenario: Consolidation Around Key Levels
25% ProbabilityBullish Scenario: Short-Covering Rally Potential
10% ProbabilityThe current geopolitical climate introduces significant volatility. Unexpected news events could rapidly alter market sentiment and invalidate technical setups. Traders should exercise strict risk management, utilize stop-losses, and be prepared for sharp price movements.
The Path Forward: What to Watch Next
For NZDUSD, the immediate focus remains on the $0.57149 support level. A decisive break below this will likely confirm the bearish bias and open the door for further downside towards $0.57080. Traders looking for short opportunities should monitor this level closely. Confirmation of a break, ideally with increased volume and a bearish candlestick pattern on the 4-hour or daily chart, would be a strong signal.
On the flip side, a sustained hold above $0.57149, followed by a push above the $0.57248 resistance, could signal a temporary reprieve or a short-covering rally. However, given the overwhelming bearish technical indicators and the strong DXY, such a move might be a counter-trend opportunity rather than a sign of a sustained bullish reversal. Any bullish setup would require significant confirmation, such as a clear break above the daily resistance at $0.57650, which seems unlikely in the current environment.
The upcoming economic calendar, though light on high-impact events for NZD or USD today, warrants attention for any potential surprises. Market participants will be keenly watching for any shifts in the global risk sentiment, which could be triggered by geopolitical developments. The strength of the US Dollar remains a dominant factor, and any indication of a Fed policy shift or a de-escalation of global tensions could dramatically alter the outlook for NZDUSD.
Frequently Asked Questions: NZDUSD Analysis
What happens if NZDUSD breaks below the $0.57149 support level?
A break below $0.57149 would confirm the bearish bias, likely triggering further selling towards $0.57109 and potentially $0.57080. This would align with the strong downtrend indicated by ADX 30.96 on the 4-hour chart.
Should I consider buying NZDUSD at current levels near $0.57174 given the oversold Stochastic signal?
While the Stochastic is oversold, the overall trend remains strongly bearish with daily ADX at 36.94. A buy at these levels carries high risk. Confirmation of a bullish reversal, such as a close above $0.57248, is needed before considering long positions, with a 10% probability assigned to this scenario.
Is the RSI at 32.3 on the 4-hour chart a reliable sell signal for NZDUSD?
An RSI of 32.3 indicates a lack of upward momentum and suggests bearish control, but it's not a direct sell signal itself. It aligns with the overall bearish trend and the 'SELL' signal from the 4H timeframe, reinforcing the view that selling pressure is dominant.
How will the strong DXY near 100.32 impact NZDUSD's outlook this week?
The strong DXY near 100.32 acts as a significant headwind for NZDUSD. This dollar strength, fueled by geopolitical risk and Fed expectations, reinforces the bearish correlation, making it harder for NZDUSD to find sustainable upside.
The market is currently favoring risk-off sentiment, with the US Dollar Index showing robust strength and major equity indices like the Nasdaq experiencing significant pullbacks. For NZDUSD, this translates into a challenging environment for bulls. While oversold conditions are present on some shorter timeframes, the overarching trend remains bearish, supported by strong ADX readings and negative MACD momentum on the daily chart. The critical support at $0.57149 is the immediate level to watch. A break below it could accelerate declines, while a failure to break and a subsequent move above $0.57248 might offer a short-covering opportunity, albeit with significant risk.
Track markets in real-time
AI-powered analysis, technical indicators and real-time price data.
Join Our Telegram Channel
Breaking market news, AI analysis and trading signals instantly.
Join Channel