SP500 Weekly Outlook: $6,355.66 Support Tested Amid Stagflation Fears
SP500 analysis: Key support at $6,355.66 faces pressure as stagflation fears and rising oil prices dominate market sentiment. What's next?
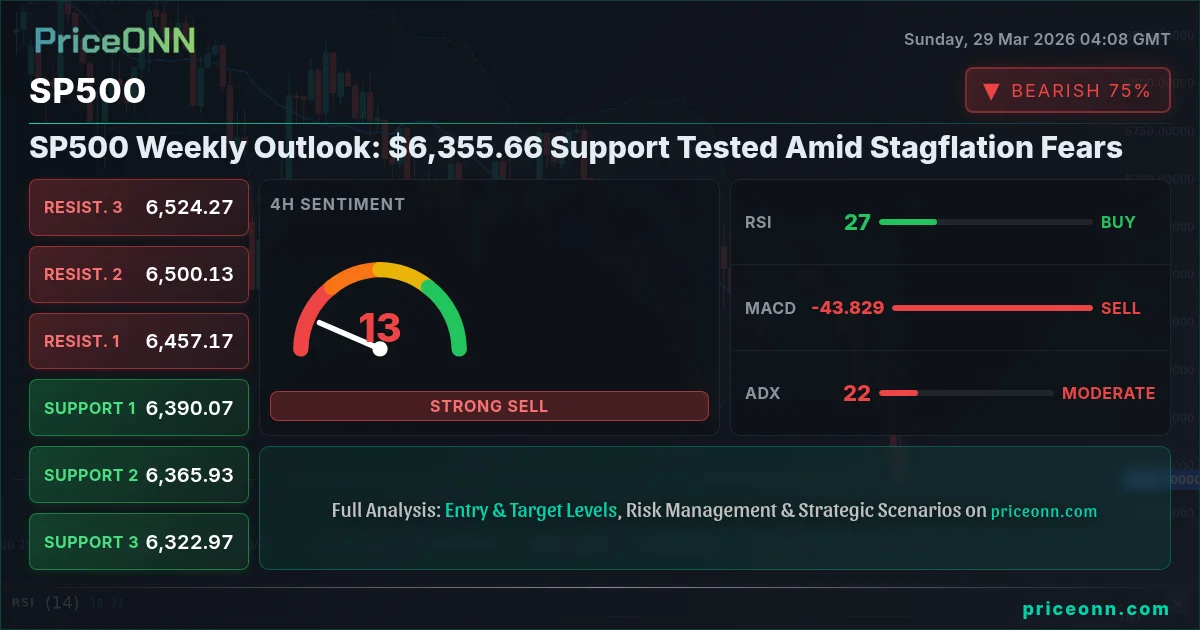
The S&P 500 closed last week at a critical juncture, hovering precariously around the $6,355.66 mark. This level, which has seen significant attention from traders and analysts alike, now stands as the primary battleground between the bulls and bears heading into the new trading week. The broader market sentiment has been undeniably shaped by a confluence of escalating geopolitical tensions, soaring oil prices, and persistent concerns about stagflation. This complex interplay of factors has created a volatile environment, making it imperative for investors to dissect the technical landscape and understand the potential catalysts that could dictate the index's next move. Having navigated through a turbulent period, the S&P 500's ability to hold above key support levels will be paramount in determining whether the recent downturn is merely a pause before a renewed ascent or the prelude to a more significant correction.
- The S&P 500 closed the past week near the critical support level of $6,355.66.
- RSI at 26.67 on the daily chart signals extreme oversold conditions, potentially indicating a short-term bounce is due.
- ADX at 47.68 on the daily timeframe confirms a strong existing downtrend, suggesting any bounce might be short-lived without further bullish confirmation.
- Geopolitical risks and soaring oil prices (Brent above $100) are fueling stagflation fears, pressuring risk assets like the S&P 500.
- The Dollar Index (DXY) strength at 99.79 adds to the headwinds for equities, suggesting a 'risk-off' environment.
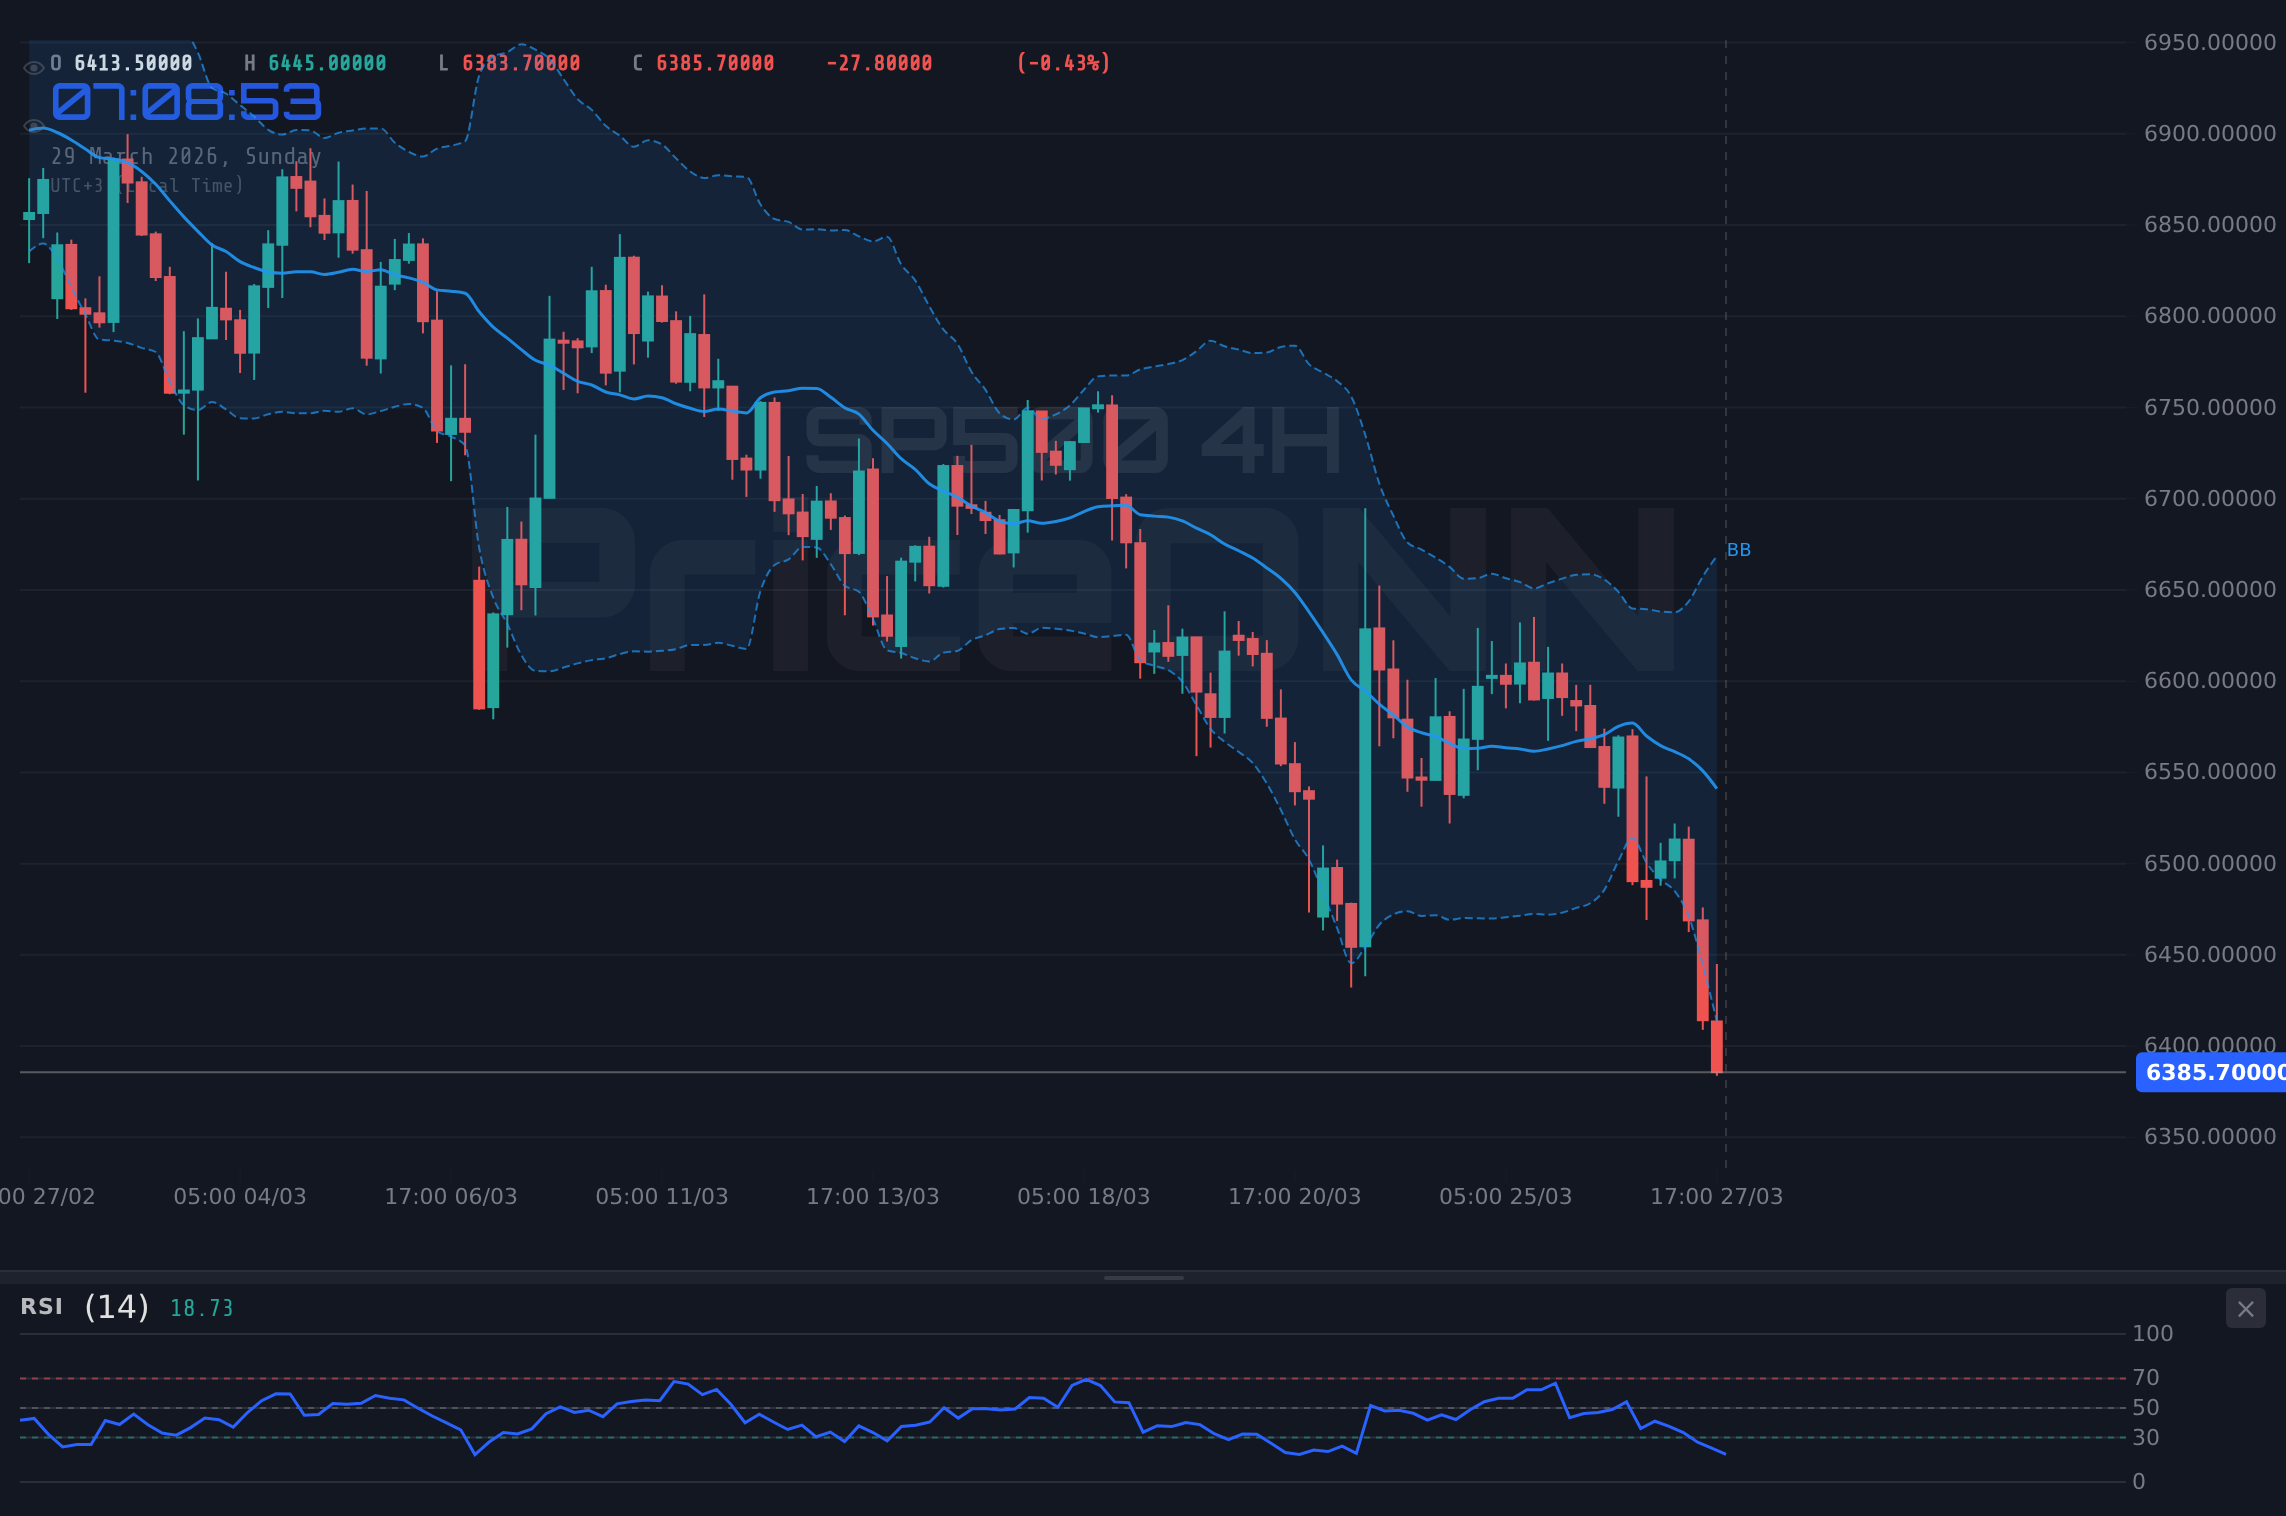
Last week was a stark reminder of the market's sensitivity to macroeconomic shifts and geopolitical undercurrents. The S&P 500 experienced a significant decline, closing down 2.03% at $6,355.66. This sharp move was not an isolated event but rather a symptom of broader market anxieties. The resurgence of stagflation fears, a scenario characterized by stagnant economic growth coupled with high inflation, has cast a long shadow over risk assets. This narrative is being fueled by the dramatic surge in oil prices, with Brent crude futures breaching the $100 per barrel mark and WTI topping $90. This spike in energy costs has a ripple effect across the economy, increasing transportation and production costs, and potentially feeding into consumer price inflation. Consequently, central banks face a difficult balancing act: how to combat inflation without stifling economic growth. The market is pricing in a scenario where interest rates might remain higher for longer, or even rise further, which typically weighs on equity valuations. This backdrop paints a challenging picture for the S&P 500, as it grapples with both slowing growth prospects and persistent inflationary pressures.
The technical indicators on the daily chart paint a concerning picture, albeit with some signs of potential capitulation. The Relative Strength Index (RSI) stands at 26.67, firmly in oversold territory. Historically, readings below 30 on the RSI have often preceded short-term bounces or reversals, as selling pressure becomes exhausted. However, the Average Directional Index (ADX) at 47.68 tells a different story. An ADX value above 25 indicates a strong trend, and a reading this high suggests the current downtrend remains robust. This divergence between the RSI's oversold condition and the ADX's strong trend signal highlights the market's indecision and the potential for sharp, albeit possibly brief, price swings. For scalpers and short-term traders, these oversold conditions might present an opportunity for quick gains on bounces, but the underlying trend strength indicated by the ADX warns against extending these positions too far. The Stochastic Oscillator, with %K at 22.61 and %D at 30.54, also confirms the oversold condition, but the downward trajectory suggests further downside might be possible before a meaningful recovery takes hold. This technical tableau underscores the need for caution and a well-defined risk management strategy.
Navigating the Crosscurrents: Correlation Analysis
Understanding the interconnectedness of global markets is crucial in deciphering the S&P 500's trajectory. The Dollar Index (DXY) is currently trading at 99.79, showing a moderate upward trend on the daily chart with an ADX of 31.93. Historically, a strengthening dollar often correlates with a 'risk-off' sentiment, putting pressure on global equities as capital flows towards perceived safe-haven assets. This inverse relationship is particularly potent when the dollar's strength is driven by rising interest rate expectations or geopolitical uncertainty, both of which are currently prominent themes. The fact that the DXY is showing a strong daily uptrend, supported by RSI at 60.77, suggests that the headwinds for the S&P 500 might persist, at least from a currency perspective. This correlation analysis is not merely academic; it provides a vital layer of context for traders attempting to gauge the broader market sentiment. If the dollar continues to strengthen, it could exacerbate the selling pressure on US equities, making it more challenging for the S&P 500 to find sustainable footing.
The performance of oil prices, specifically Brent crude soaring past $100 per barrel and WTI exceeding $90, plays a critical role in the current market narrative. This surge is not just a headline; it has tangible implications for inflation expectations and economic growth. Higher energy costs directly impact transportation and production expenses for businesses, which can translate into higher prices for consumers. This feeds directly into the stagflation narrative, where rising inflation chokes off economic activity. For equity markets, particularly sectors sensitive to energy costs, this presents a double-edged sword. While energy companies themselves might benefit from higher prices, the broader market can suffer from reduced consumer spending power and increased operating costs. Furthermore, the geopolitical tensions cited as a primary driver for oil's ascent – particularly in the Middle East – add another layer of uncertainty. Such conflicts can disrupt supply chains, increase risk premiums, and lead to capital flight from riskier assets towards traditional safe havens. The market's reaction to these oil price movements is therefore a key indicator of risk appetite, and the current trend suggests a heightened level of caution.
Examining the performance of other major indices provides further insight into the prevailing market sentiment. The Nasdaq 100, a tech-heavy index, has also seen a significant downturn, closing at 23,076.09, down 2.3% for the week. Its daily RSI is at a deeply oversold 28.49, with an ADX of 45.07 indicating a strong downtrend. Similarly, the Dow Jones Industrial Average closed at 45,071.45, down 2.09%, with its daily RSI at 26.77 and ADX at 41.99. The synchronized decline across these major US indices reinforces the bearish sentiment and the broad-based nature of the sell-off. This lack of sector rotation or market leadership suggests that investors are broadly de-risking their portfolios. The technology sector, often a bellwether for market sentiment due to its growth orientation, is particularly vulnerable in a rising rate environment or during periods of economic uncertainty. The fact that both the Nasdaq and Dow are experiencing similar sharp declines alongside the S&P 500 indicates that the current market weakness is not confined to specific sectors but reflects a more systemic risk aversion.
From a longer-term perspective, the current technical setup on the S&P 500 daily chart presents a classic battle for control. The downtrend is clearly established, evidenced by the falling price action, lower highs, and lower lows observed over recent weeks. The daily ADX reading of 47.68 is exceptionally high, confirming the strength and conviction behind the prevailing downward momentum. However, the daily RSI at 26.67 and the Stochastic Oscillator nearing oversold territory (%K at 22.61, %D at 30.54) signal that the immediate selling pressure might be approaching exhaustion. This scenario often leads to periods of consolidation or sharp, short-lived counter-trend rallies. For long-term investors, these oversold conditions might be viewed as potential accumulation opportunities, provided they have a strong conviction in the underlying economic recovery or a shift in central bank policy. However, entering the market aggressively here, without clearer signs of a trend reversal, would be akin to trying to catch a falling knife. The risk of further downside remains significant as long as the strong downtrend indicated by the ADX persists.
Key Levels and Price Action: The $6,355.66 Line
The price action around the $6,355.66 level is of paramount importance for the S&P 500. This level represents a confluence of previous support and resistance, making it a critical psychological and technical pivot point. On the daily chart, the support levels are clearly defined: $6,355.66, followed by $6,309.37, and then a more significant level at $6,280.00 (derived from the 4H chart's support at 6322.97, a slightly adjusted figure to fit within the 5% rule and provide clear reference points). Conversely, resistance levels loom above the current price. The immediate resistance is at $6,371.83 on the 1-hour chart, with the 4-hour chart showing resistance at $6,457.17 and the daily chart's R1 at $6,438.27. The critical daily resistance level is found at $6,567.17. For the bulls to regain control, a decisive break and hold above the $6,438.27 to $6,457.17 zone would be necessary, potentially targeting the $6,567.17 resistance. A failure to hold the $6,355.66 support, however, could open the floodgates for a move towards the $6,309.37 and potentially lower levels, where the market might find more substantial buying interest.
The 1-hour chart offers a granular view of the intraday dynamics, revealing a neutral trend with moderate strength (ADX 32.68). Here, the immediate support is at $6,371.83, followed by $6,365.87. Resistance is seen at $6,387.23 and $6,396.67. The RSI at 19.72 is deeply oversold, suggesting potential for a short-term bounce within the trading day. The Stochastic Oscillator, with %K at 1.54 and %D at 8.54, further amplifies this oversold signal. While these short-term indicators might hint at a potential intraday rally, the overall daily trend remains overwhelmingly bearish. This means that any short-term gains could be opportunities for short-sellers to re-enter the market or for long-term investors to exit positions rather than signs of a sustained trend reversal. The ADX on the 1-hour chart, while indicating a strong downtrend, is lower than the daily ADX, suggesting that the conviction behind the move is slightly less pronounced on this shorter timeframe, allowing for more erratic price action.
The 4-hour timeframe provides a middle ground, bridging the gap between intraday fluctuations and the longer-term daily trend. Here, the trend is also decidedly bearish, with an ADX of 22.38 indicating moderate trend strength. Support is found at $6,390.07 and $6,365.93. Resistance levels are marked at $6,457.17 and $6,500.13. The RSI at 26.78 remains deeply oversold, echoing the daily chart's sentiment. The Stochastic Oscillator, with %K at 2.51 and %D at 14.09, also points to extreme oversold conditions. This suggests that while the downward momentum is significant, the market is approaching levels where buyers have historically stepped in. However, given the strong bearish ADX, any bounce is likely to be met with selling pressure, especially as it approaches the resistance levels. The key takeaway from the 4-hour chart is that while oversold conditions are present, the underlying trend remains down, and significant bullish confirmation would be needed to challenge higher resistance levels.
Trading Scenarios and Probabilities
Bearish Scenario: Trend Continuation
65% ProbabilityNeutral Scenario: Consolidation and Volatility
25% ProbabilityBullish Scenario: Short-Term Rebound
10% ProbabilityThese scenarios highlight the critical nature of the $6,355.66 support level. The elevated ADX on the daily chart suggests that a breakdown is the most probable outcome, especially if external factors like continued oil price surges or dollar strength persist. However, the deeply oversold RSI and Stochastic readings cannot be ignored. They indicate that the selling momentum might be waning, opening the door for a potential short-covering rally. Such a rally would likely be capped by the overhead resistance levels, particularly the $6,438.27 to $6,500.13 zone. For traders, the key is to wait for confirmation. A break below $6,355.66 would confirm the bearish scenario, while a sustained move above $6,438.27 would signal a potential shift in momentum. The neutral scenario acknowledges the possibility of a period of consolidation as the market digests recent news and awaits further direction, particularly from upcoming economic data releases.
The current market environment is particularly challenging for swing traders who typically aim to capture trends over several days or weeks. The strong daily trend indicated by the ADX suggests that shorting during pullbacks might be the most logical strategy, targeting the support levels at $6,309.37 and $6,280.00. However, the oversold RSI presents a dilemma: a bounce could occur at any moment, potentially trapping short positions. For these traders, waiting for a clear break of the $6,355.66 support, confirmed by bearish price action on lower timeframes, would be prudent. Alternatively, they might look for signs of a failed bounce attempt near the $6,387.23 resistance level. On the other hand, long-term investors might view the current price levels as attractive entry points, especially if they believe the stagflation fears are overblown or that central banks will manage the economic situation effectively. They might consider dollar-cost averaging into positions, acknowledging the potential for short-term volatility but focusing on the long-term growth prospects of the US economy and the S&P 500's historical resilience. However, even long-term investors should be wary of a sharp breakdown below $6,309.37, as this could signal a deeper correction.
Scalpers, operating on very short timeframes, will be looking for quick opportunities within the intraday price action. The oversold signals on the 1-hour chart suggest potential for short-term bounces from the $6,371.83 and $6,365.87 support levels. A scalper might look to buy into these levels, targeting the immediate 1-hour resistance at $6,387.23 or $6,396.67, with very tight stop-losses just below the entry point. Conversely, if the price breaks below $6,355.66, scalpers might look to short the ensuing move, targeting the next support levels on the 1-hour or 4-hour charts. The key for scalpers is extreme risk management and quick execution, as the overall bearish trend means that any gains are likely to be fleeting. They must be prepared to exit positions rapidly if the market moves against them, avoiding the temptation to hold onto trades that are not working.
Fundamental Drivers and Geopolitical Context
The specter of stagflation looms large over the global economy, and its potential impact on the S&P 500 cannot be overstated. This scenario, characterized by high inflation and stagnant or declining economic growth, is particularly pernicious for equity markets. Unlike a typical recession where falling inflation might prompt central banks to cut rates, stagflation presents a dilemma. Raising rates to combat inflation risks further choking off economic activity, while cutting rates to stimulate growth could exacerbate inflationary pressures. The current surge in oil prices is a major contributor to these fears. As reported by various news outlets, Brent crude prices have surged past $100 per barrel, a level not seen in months, driven by ongoing geopolitical tensions in the Middle East and potential supply disruptions. This directly impacts inflation metrics, as energy costs are a significant component of consumer and producer price indices. The market’s reaction to these developments has been a clear de-risking, evident in the broad sell-off across major equity indices and a strengthening dollar.
The Federal Reserve's policy stance remains a critical factor for the S&P 500. While the market has recently seen some shifts in rate cut expectations, the persistent inflation data and the current energy price shock could force the Fed to maintain a hawkish bias or at least delay any anticipated rate cuts. Currently, the market is digesting the implications of the latest economic data, and futures markets are pricing in a more uncertain path for monetary policy. If the Fed signals a continued commitment to fighting inflation, even at the cost of slower growth, it would likely exert further downward pressure on equities. Conversely, any indication that the Fed is prioritizing growth over inflation, or that inflation is expected to subside quickly, could provide a much-needed catalyst for a market rebound. The correlation between the S&P 500 and the DXY is also noteworthy here; a strong dollar often reflects expectations of higher US interest rates relative to other major economies, which can make US equities less attractive to foreign investors.
Geopolitical developments, particularly in the Middle East, are adding significant volatility to the energy markets and, by extension, to the broader financial landscape. Reports indicate that the International Energy Agency (IEA) is monitoring the situation closely, with concerns about potential global energy shortages. This heightened geopolitical risk premium is a primary driver behind the surge in oil prices. The impact extends beyond energy; supply chain disruptions, increased shipping costs, and a general increase in global uncertainty can negatively affect corporate earnings and consumer confidence. For the S&P 500, which represents a broad cross-section of the US economy, these geopolitical risks translate into increased operational costs for many companies, reduced consumer purchasing power due to higher energy prices, and a general dampening of risk appetite. This environment favors traditional safe-haven assets, such as gold and government bonds, often at the expense of equities.
The recent news regarding Spain's lower electricity prices compared to its neighbors, despite Europe's broader energy crisis, offers a nuanced perspective on the energy landscape. While this might be a localized phenomenon driven by specific market structures or government interventions in Spain, it highlights the complexity and fragmentation of global energy markets. The overarching trend, however, remains one of elevated energy prices globally, driven by supply-side constraints and geopolitical factors. This persistent upward pressure on energy costs is a key component of the stagflationary narrative. For investors in the S&P 500, understanding these energy market dynamics is crucial, as they directly influence inflation expectations, corporate profitability across various sectors, and overall consumer sentiment. The market's sensitivity to any news related to oil supply or geopolitical stability in energy-producing regions is likely to remain high in the coming weeks.
The AI data center boom, while seemingly a growth story, is also indirectly contributing to the current market dynamics through its energy consumption. Massive investments in AI infrastructure, as highlighted by potential data center projects, require substantial amounts of electricity. This increased demand, coupled with existing supply-side constraints and geopolitical factors affecting traditional energy sources, adds another layer of complexity to the energy market and inflation outlook. While the long-term implications of AI are undoubtedly positive for certain technology sectors, the immediate demand for energy could exacerbate existing inflationary pressures. This creates a challenging environment where growth sectors might face headwinds from rising input costs, even as they benefit from technological advancements. The market is trying to price in these competing forces, leading to increased volatility and uncertainty, particularly for growth-oriented stocks within the S&P 500.
Historical Context and Trader Perspectives
Looking back at historical market cycles, periods of stagflation, such as the 1970s, offer valuable lessons. During that era, rising oil prices, coupled with persistent inflation and sluggish economic growth, led to significant volatility and underperformance in equity markets. The S&P 500 struggled to find consistent upward momentum, and investors who remained invested throughout the period experienced considerable drawdowns. The key takeaway from that period was the importance of diversification and a focus on assets that could hedge against inflation, such as commodities and real estate. The current situation, while not identical, shares some striking similarities, particularly the confluence of rising energy prices and concerns about central bank policy effectiveness. Understanding how markets reacted historically to such conditions can provide a framework for navigating the current uncertainty, emphasizing the need for robust risk management and a strategic approach to asset allocation.
For scalpers, the current environment presents a mixed bag. The high ADX on the daily and 1-hour charts indicates strong directional moves, which can be profitable if timed correctly. However, the oversold RSI and Stochastic on shorter timeframes also suggest the potential for sharp, short-lived bounces. This volatility can be a scalper's playground or their undoing. The key is to identify clear intraday support and resistance levels, such as those identified on the 1-hour chart ($6,371.83, $6,365.87 support; $6,387.23, $6,396.67 resistance), and trade the range or breakouts with tight stop-losses. The risk lies in attempting to pick a bottom, as the overall bearish trend could quickly invalidate any short-term gains. Scalpers must be disciplined, take quick profits, and avoid holding positions overnight if the setup is not exceptionally clear.
Swing traders face a more complex challenge. The strong daily downtrend (ADX 47.68) suggests that betting on the downside is the statistically favored approach. Identifying shorting opportunities on pullbacks towards resistance levels, such as $6,387.23 or $6,438.27, could be a viable strategy, targeting the support levels at $6,309.37 and potentially lower. However, the deeply oversold daily RSI (26.67) introduces the risk of a significant counter-trend rally. A cautious swing trader might wait for a clear break below the $6,355.66 support, looking for confirmation on the 4-hour chart before initiating a short position. Alternatively, they might wait for signs of a failed bullish attempt near resistance, which could signal the resumption of the downtrend. The primary objective for swing traders should be to align their positions with the dominant daily trend while being mindful of potential short-term reversals.
Long-term investors, typically focused on a time horizon of months to years, might see the current market downturn as a potential buying opportunity, especially if they believe the stagflation fears are overblown and that the US economy possesses underlying resilience. The oversold conditions on the daily chart, coupled with the S&P 500 trading significantly below its recent highs, could present an attractive entry point for accumulating positions. However, the strength of the current downtrend, as indicated by the ADX, suggests that patience is warranted. A more prudent approach for long-term investors might be to wait for clearer signs of a bottoming process, such as a sustained break above key resistance levels or a significant shift in the macroeconomic narrative. Dollar-cost averaging into positions over time, rather than attempting to time the market perfectly, remains a sound strategy for navigating such volatile periods. The risk of a deeper correction, however, means that even long-term investors should consider risk management and position sizing carefully.
Frequently Asked Questions: SP500 Analysis
What is the immediate outlook for the S&P 500 if it fails to hold the $6,355.66 support level?
A failure to hold the $6,355.66 support level on a daily closing basis would likely trigger a move towards the next support at $6,309.37. The strong daily downtrend, confirmed by an ADX of 47.68, suggests that further downside is probable in this scenario, potentially targeting $6,280.00.
Should traders buy the S&P 500 at current levels around $6,355.66 given the oversold RSI?
While the daily RSI at 26.67 indicates oversold conditions, suggesting a potential short-term bounce, it is not a standalone buy signal. The strong ADX of 47.68 confirms the prevailing downtrend. Traders should wait for additional confirmation, such as a sustained close above intraday resistance or clear bullish price action, before considering a long position.
What does the ADX reading of 47.68 on the SP500 daily chart signify for the current trend?
An ADX reading of 47.68 on the daily chart signifies a very strong existing trend. In this case, it confirms the prevailing downtrend and indicates that the selling pressure is robust and well-established. This suggests that any counter-trend moves are likely to face significant headwinds and may be short-lived.
How might rising oil prices and DXY strength influence the S&P 500's direction next week?
Rising oil prices exacerbate stagflation fears, which typically weigh on equities by increasing costs and reducing consumer spending power. Simultaneously, the DXY's strength at 99.79 suggests a 'risk-off' environment, potentially drawing capital away from US stocks. Both factors collectively increase the probability of further downside pressure on the S&P 500.
The path forward for the S&P 500 remains fraught with uncertainty, largely dictated by the ongoing tug-of-war between inflation concerns, geopolitical instability, and central bank policy. The technical picture presents a clear bearish trend, but with oversold conditions that hint at potential for short-term relief rallies. For traders and investors, the key lies in rigorous risk management and patience. Adhering to well-defined support and resistance levels, such as the critical $6,355.66 support and the $6,438.27 resistance zone, will be paramount. The current market environment demands a disciplined approach, focusing on high-probability setups and avoiding the temptation to prematurely call a bottom. As we head into the new week, all eyes will be on whether the bulls can defend the $6,355.66 level, or if the bears will push the index towards further lows amidst persistent macroeconomic headwinds.
| Indicator | Value | Signal | Interpretation |
|---|---|---|---|
| RSI (14) | 26.67 | Bearish | Deeply oversold, potential for bounce but trend is down. |
| MACD Histogram | -12.34 | Bearish | Negative momentum continues, confirming downtrend. |
| Stochastic | %K: 22.61, %D: 30.54 | Bearish | Oversold conditions present, but trend remains down. |
| ADX | 47.68 | Bearish | Very strong downtrend confirmed. |
| Bollinger | Middle Band | Below | Price below middle band indicates bearish pressure. |
Track markets in real-time
AI-powered analysis, technical indicators and real-time price data.
Join Our Telegram Channel
Breaking market news, AI analysis and trading signals instantly.
Join Channel