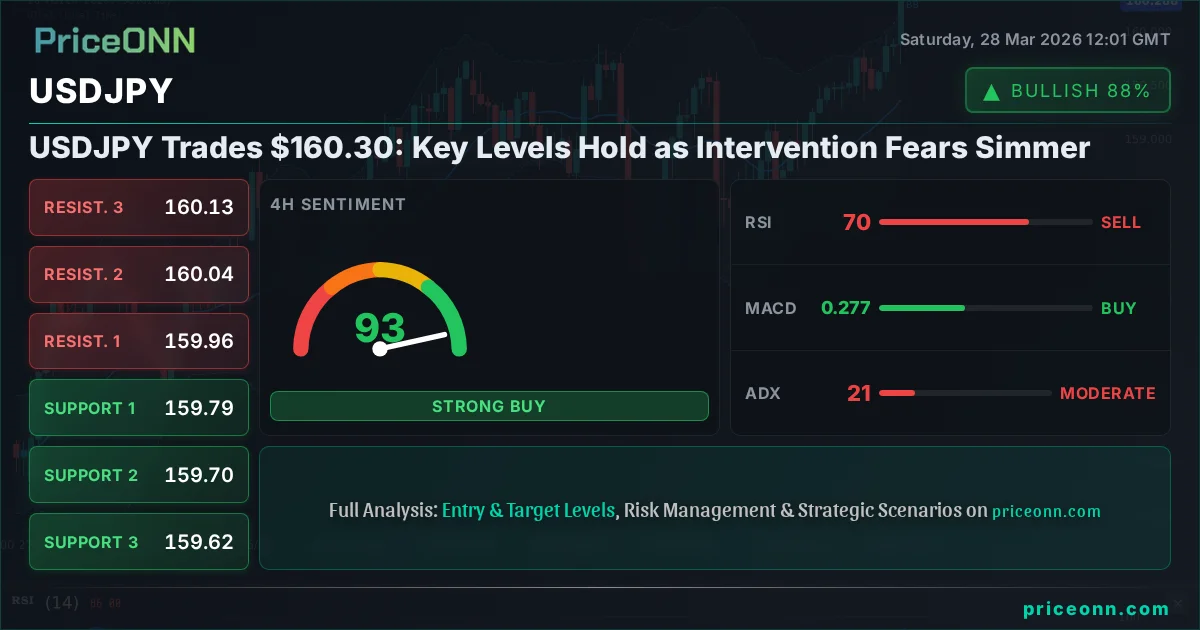
USDJPY Trades $160.30: Key Levels Hold as Intervention Fears Simmer
USDJPY hovers near $160.30 as intervention fears provide temporary support. Technicals show a strong uptrend, but RSI divergence hints at caution. What's next?
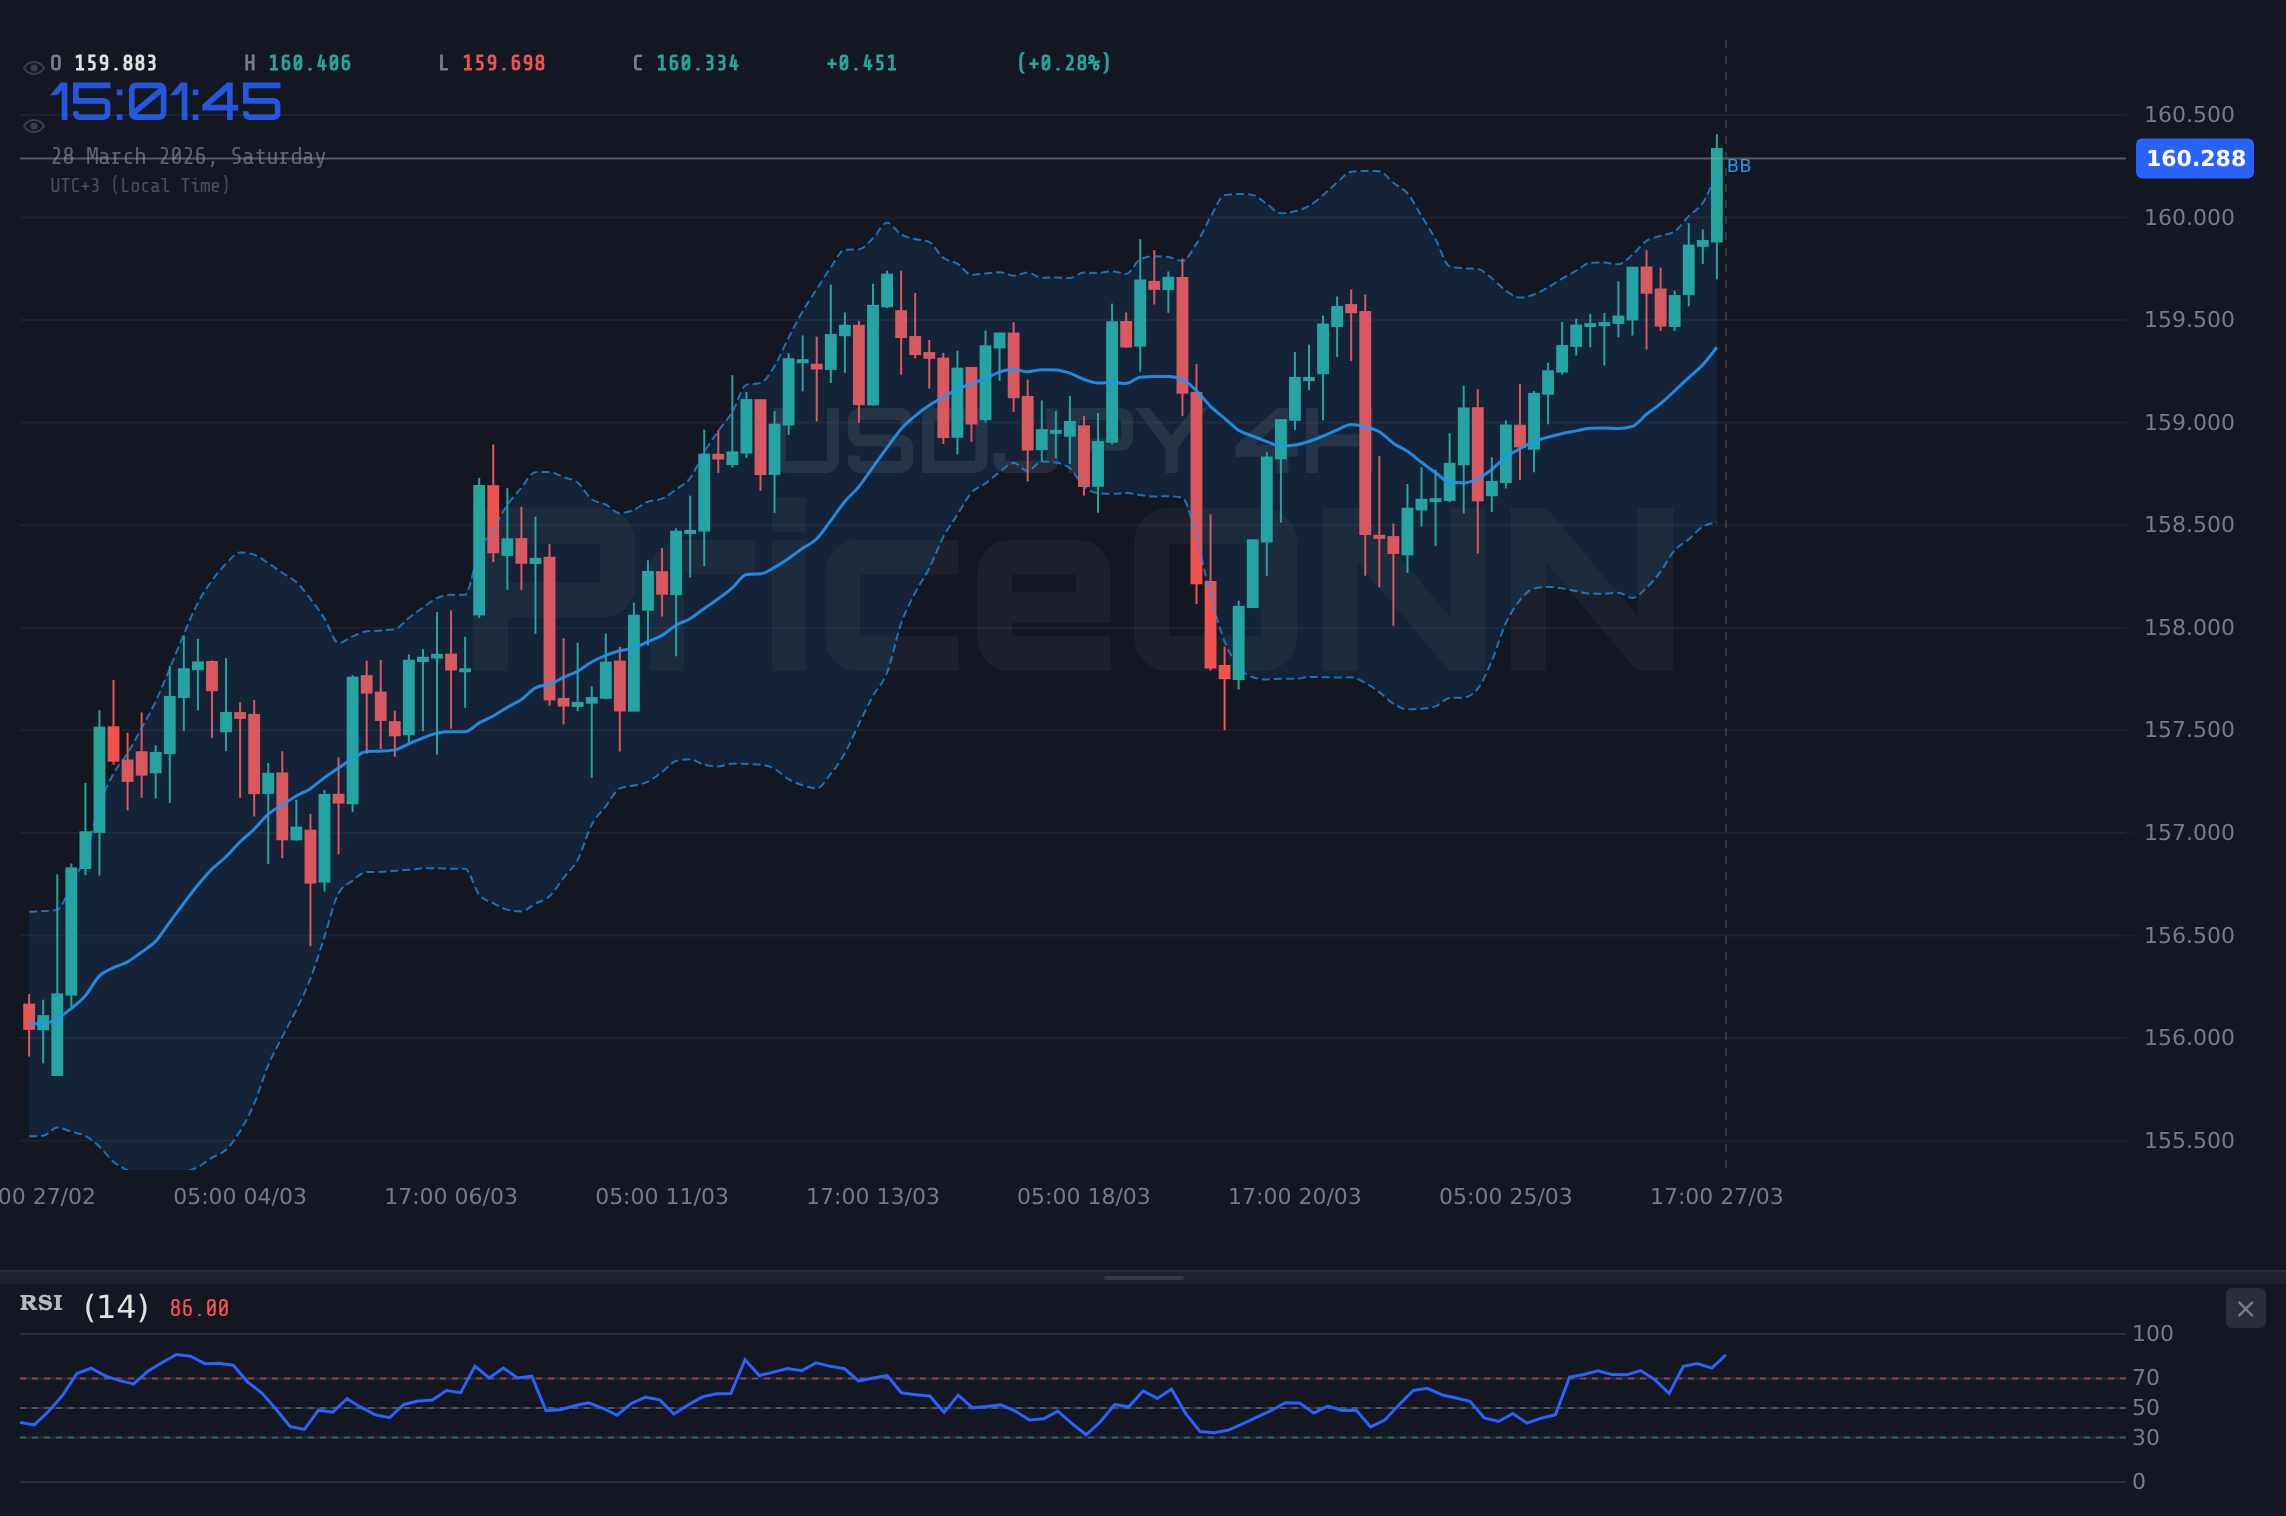
The Japanese Yen is once again at a critical juncture, with USDJPY hovering around the psychologically significant $160.30 level. Last Friday's close saw the pair trading at this pivotal point, a level that has been the subject of intense market scrutiny and speculation regarding potential intervention. While the daily chart signals a robust uptrend, the 1-hour and 4-hour indicators are flashing mixed signals, suggesting a period of consolidation or a potential short-term pullback before the next significant move. This analysis delves into the technical underpinnings, the looming threat of intervention, and the broader market context that will shape USDJPY's trajectory in the coming week.
- USDJPY is trading around $160.30, a critical level closely watched for potential Japanese government intervention.
- The daily chart shows a strong bullish trend (ADX 31.98), but 1H RSI at 70.41 and Stochastic in overbought territory suggest caution.
- Key support is identified at $160.194 (1H) and $159.791 (4H), while resistance looms at $160.341 (1H) and $159.960 (4H).
- Escalating geopolitical tensions and a strengthening DXY (99.91) are providing underlying support for USDJPY.
The Japanese Yen has been under considerable pressure for weeks, a trend that intensified as crude oil prices surged past $100 per barrel, threatening to reignite inflation in Japan and further weaken the Yen. This inflationary pressure complicates the Bank of Japan's (BoJ) path toward policy normalization. While the BoJ has signaled a potential shift away from negative interest rates, the specter of rising import costs due to a weaker Yen creates a delicate balancing act. Market participants are keenly observing every statement from Japanese financial authorities, with intervention fears acting as a constant headwind against further Yen depreciation. Last week, we saw brief periods where intervention fears briefly halted the Yen's slide, but the underlying trend remains persistently bearish for the JPY against the USD.
From a technical standpoint, the daily chart of USDJPY presents a picture of a strong, established uptrend. The Average Directional Index (ADX) at 31.98 indicates a robust trend, and the Moving Average Convergence Divergence (MACD) continues to show positive momentum, with the MACD line consistently above its signal line. The Relative Strength Index (RSI) at 63.12, while in the upper half of the neutral zone, still suggests room for upward movement. However, this bullish daily picture is tempered by the shorter timeframes. The 1-hour RSI is flashing 70.41, firmly in overbought territory, and the Stochastic Oscillator is also in extreme overbought conditions, signaling a potential for a pullback or at least a pause in the rally. This divergence between the long-term trend and short-term overbought conditions is crucial for traders to monitor.
The current price of $160.30 for USDJPY sits precariously close to levels that have historically triggered intervention. Japanese officials have repeatedly warned about excessive currency moves, and the psychological barrier of 160 has been breached with increasing frequency. The sheer speed and magnitude of the Yen's recent slide, exacerbated by the oil shock and the broad strength in the US Dollar (DXY currently at 99.91), make intervention a very real possibility. However, the effectiveness of such interventions is often debated. While they can cause temporary volatility and brief reversals, they rarely change the fundamental direction of a currency pair unless backed by significant policy shifts. The market's reaction to any potential intervention will be a key determinant of short-term price action.
Looking at the broader market context, the surge in crude oil prices past $100 per barrel is a significant factor. This not only impacts inflation expectations globally but also creates a geopolitical risk premium that often benefits the US Dollar as a safe-haven asset. Escalating tensions in the Middle East, with Iran's actions in the Strait of Hormuz, have amplified these safe-haven flows. This environment supports a stronger DXY, which, in turn, exerts downward pressure on pairs like EURUSD and GBPUSD, while providing a tailwind for USDJPY. The correlation between DXY and USDJPY remains strong, and any further strengthening of the dollar, fueled by geopolitical uncertainty or shifts in Fed policy expectations, will likely push USDJPY higher, provided intervention fears don't cap the upside.
The technical levels on the 1-hour chart are particularly important for short-term traders. Support is seen at $160.194, followed by $160.144 and $160.047. A break below these levels could signal a deeper correction. On the resistance side, immediate hurdles are at $160.341, $160.438, and $160.488. A decisive move above these levels, especially if sustained, could indicate a continuation of the bullish trend, but the overbought indicators on this timeframe suggest this breakout might face immediate selling pressure.
On the 4-hour timeframe, the trend is still considered strong (ADX 21.13), but the signals are more mixed than on the daily chart. Support levels are positioned at $159.791, $159.698, and $159.622. These levels represent areas where buyers might step in if a correction occurs. Resistance is noted at $159.960, $160.036, and $160.129. The fact that the price is currently trading above the $160.30 mark, which is technically a resistance on this timeframe, suggests that the bulls are currently in control of the intraday momentum, but the overall strength of the trend is moderate, leaving room for reversals.
The daily chart, as mentioned, paints a picture of a strong uptrend, with support at $159.327, $159.022, and $158.765. These are significant levels that would need to be broken convincingly to suggest a trend reversal. Resistance levels on the daily chart are at $159.889, $160.146, and $160.451. The current price of $160.30 is just below the R2 resistance level on the daily chart. This suggests that while the long-term trend is bullish, the immediate upside might be capped by these resistance points, especially if shorter-term overbought conditions persist or if intervention fears materialize.
Considering the economic calendar, upcoming data releases will be crucial. While specific dates for high-impact events were not provided for the immediate weekend, the general economic outlook for both the US and Japan will play a significant role. For the US, any data suggesting persistent inflation or a resilient economy could bolster the DXY and thus USDJPY. Conversely, signs of economic weakening might lead to a reassessment of Fed rate hike expectations, potentially offering some relief to the Yen. For Japan, inflation figures and any hints from the BoJ regarding the pace of policy normalization will be paramount. The market is pricing in a certain degree of normalization, but any deviation from this expectation could cause significant volatility.
The correlation with other markets cannot be ignored. The strength of the DXY at 99.91 is a major driver. As the dollar index rises, USDJPY tends to follow. This relationship is currently intact, with the DXY showing a strong upward trend on the daily chart. Equity markets, represented by the S&P 500 and Nasdaq, have experienced significant sell-offs, currently trading down -2% and -2.23% respectively. This risk-off sentiment in equities often translates into demand for safe-haven assets like the US Dollar and, to some extent, the Japanese Yen, creating a complex interplay. However, the overwhelming strength of the USD in this risk-off environment, combined with the specific weakness of the Yen due to its yield differential and oil import costs, is currently dominating the narrative.
The Stochastic Oscillator on the 1-hour chart, with %K at 83.85 and %D at 83.43, is showing extreme overbought conditions, indicating that the recent upward momentum may be unsustainable in the very short term. This is a classic sign that a pullback could be imminent. Similarly, on the 4-hour chart, the Stochastic is also showing elevated readings, although not as extreme. The RSI at 70.41 on the 1-hour chart also confirms this overbought condition. This suggests that while the broader trend is up, traders looking for short-term opportunities might consider waiting for a dip or confirmation of a breakout before entering long positions.
The ADX indicator provides insight into the strength of the prevailing trend. On the 1-hour chart, ADX is at 28.65, indicating a strong trend. On the 4-hour chart, it's 21.13, suggesting a moderate trend. However, on the daily chart, the ADX stands at 31.98, confirming a strong trend. This divergence in trend strength across timeframes highlights the current market condition: a strong daily trend is being challenged by short-term overbought conditions and moderate trend strength on intraday charts. This often leads to choppy price action or consolidation as the market digests recent moves.
The Bollinger Bands offer another perspective. On the 1-hour and 4-hour charts, the price is trading above the middle band, indicating a bullish bias in the short to medium term, but the bands themselves are not excessively wide, suggesting that volatility has not yet reached extreme levels. On the daily chart, the price is also above the middle band, reinforcing the overall bullish trend. However, the RSI readings on shorter timeframes suggest that the price might be approaching the upper Bollinger band, which could act as a temporary ceiling.
The MACD histogram on the 1-hour chart is positive, indicating bullish momentum. On the 4-hour chart, it remains positive as well, albeit with slightly less conviction. The daily MACD histogram is also positive, reinforcing the longer-term uptrend. The fact that the MACD line is above the signal line on all observed timeframes is a consistent bullish signal, suggesting that the underlying trend is still intact, despite the overbought short-term indicators.
Given the conflicting signals between the strong daily uptrend and the short-term overbought conditions, along with the ever-present threat of intervention, a cautious approach is warranted. For traders looking to enter long positions, waiting for a pullback to a key support level, such as $159.791 on the 4-hour chart, or confirmation of a breakout above the $160.451 daily resistance, might offer a better risk-reward ratio. Conversely, those looking for short opportunities might target the $160.194 or $159.791 support levels on a break, anticipating a deeper correction driven by overbought conditions or intervention fears.
The geopolitical backdrop is undeniably a significant factor. The conflict in the Middle East and the resulting oil price surge have created a 'risk-on' environment for the USD but a 'risk-off' environment for other assets and currencies sensitive to commodity prices or global trade disruptions. This complex interplay means that while USDJPY may benefit from dollar strength, the Yen's own unique vulnerabilities - its status as a safe haven and its sensitivity to Japanese economic conditions - create unique dynamics. The market is essentially weighing the safe-haven appeal of the USD against the specific headwinds facing the JPY.
The potential for Japanese authorities to intervene is a wild card that cannot be ignored. While the exact trigger for intervention is unknown, sustained moves beyond psychological levels like 160, especially when accompanied by rising inflation expectations in Japan, are prime candidates. If intervention occurs, we could see a sharp, albeit potentially short-lived, spike higher in USDJPY followed by a rapid reversal. Traders should be prepared for increased volatility around these levels, especially if any official statements from the Ministry of Finance or the Bank of Japan emerge.
USDJPY is at a critical juncture around $160.30. The daily trend is strongly bullish, supported by a rising DXY and geopolitical risk premiums. However, short-term indicators are overbought, and the ever-present threat of intervention adds a layer of uncertainty. The coming week will likely be characterized by a tug-of-war between the underlying bullish trend and these short-term cautionary signals and potential intervention risk. Patience and strict risk management will be key for navigating this environment.
Bullish Continuation Scenario
55% ProbabilityConsolidation / Intervention Watch Scenario
35% ProbabilityCorrection Scenario
10% ProbabilityFrequently Asked Questions: USDJPY Analysis
What happens if USDJPY breaks above $160.451 resistance?
A sustained break above $160.451, the daily R1 resistance, would signal a continuation of the bullish trend. This could target $160.889 (Daily R2) and potentially $161.146 (Daily R3), especially if intervention fears subside and the DXY remains strong.
Should I buy USDJPY at current levels around $160.30 given the RSI at 70.41?
Buying at current levels around $160.30 with the 1-hour RSI at 70.41 presents a risk due to short-term overbought conditions. A more prudent approach might be to wait for a pullback to support around $159.791 or confirmation of a breakout above resistance, which offers a better risk-reward profile.
Is the 1-hour RSI at 70.41 a sell signal for USDJPY right now?
An RSI of 70.41 on the 1-hour chart indicates overbought conditions, suggesting a potential for a short-term pullback or consolidation. While not a direct sell signal on its own, it warrants caution for new long entries and could favor short-term profit-taking or waiting for clearer signals.
How will potential Japanese intervention affect USDJPY this week?
Direct intervention could cause a sharp, albeit likely temporary, spike higher in USDJPY followed by a reversal. The market is highly sensitive to such actions, and any official statements or signs of intervention would likely lead to increased volatility around the $160.00-$160.50 levels.
Technical Outlook Summary
| Indicator | Value | Signal | Interpretation |
|---|---|---|---|
| RSI (14) | 63.12 | Neutral | Uptrend intact, but daily RSI shows room for caution. |
| MACD Histogram | +0.146 | Bullish | Positive momentum on daily chart. |
| Stochastic | %K: 87.75, %D: 61.64 | Bullish | Strong uptrend signal on daily, but overbought on 1H. |
| ADX | 31.98 | Bullish | Strong trend strength confirmed on daily. |
| Bollinger | Middle Band | Bullish | Price above middle band on daily, indicating uptrend. |
Track markets in real-time
AI-powered analysis, technical indicators and real-time price data.
Join Our Telegram Channel
Breaking market news, AI analysis and trading signals instantly.
Join Channel