AUDUSD Weekly Outlook: Navigating $0.68761 Amidst Global Tensions and Shifting Fed Expectations
AUDUSD hovers around $0.68761. This week's analysis delves into geopolitical impacts, RBA's cautious stance, and technical levels to watch as global markets recalibrate.
The Australian Dollar (AUD) has found itself at a critical juncture, trading around the $0.68761 mark as the week draws to a close. This past week has been a turbulent one for financial markets, characterized by escalating geopolitical tensions, particularly in the Middle East, and a fluctuating sentiment surrounding potential central bank policy shifts. For AUDUSD, this translates into a complex interplay of risk appetite, commodity price movements, and the ever-present influence of the US Dollar's trajectory. As we look ahead, understanding the confluence of these macro-economic forces and their technical implications will be paramount for traders seeking to navigate the choppiness.
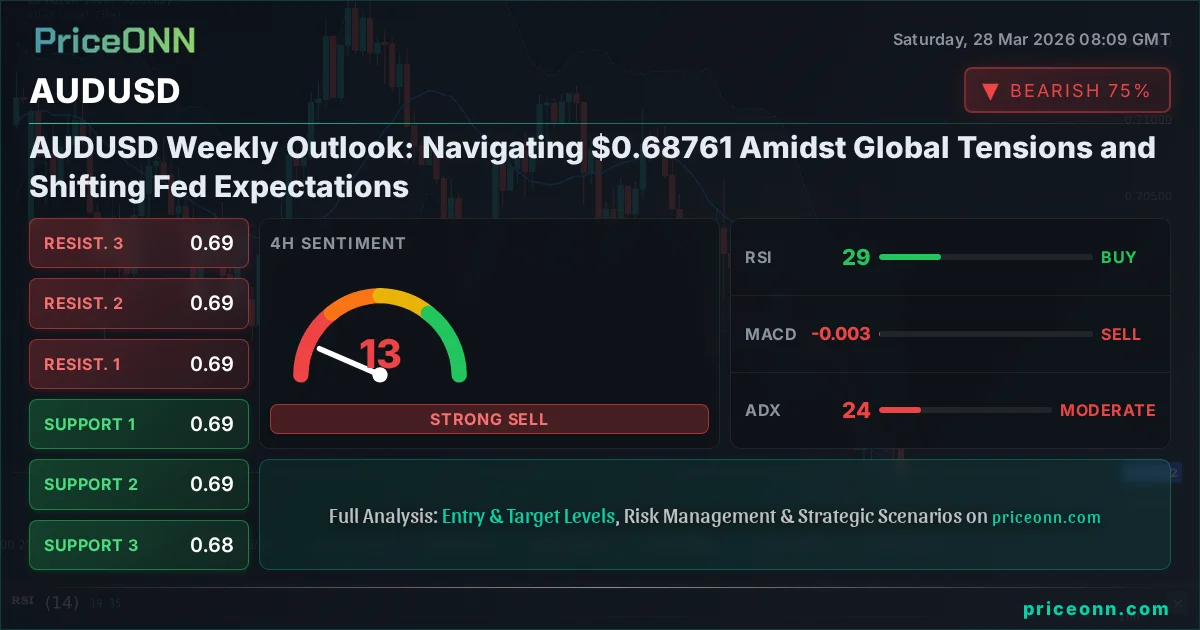
- AUDUSD is currently trading at $0.68761, with key intraday support at $0.68652 and resistance at $0.68767.
- The 1-hour RSI stands at 37.27, indicating a bearish trend, while the 4-hour RSI at 29.27 suggests oversold conditions potentially offering a short-term rebound opportunity.
- Geopolitical tensions, particularly Iran's actions and their impact on oil prices, are a significant driver, influencing safe-haven flows and commodity-linked currencies like the AUD.
- The US Dollar Index (DXY) is showing strength, currently at 99.91, which typically exerts downward pressure on AUDUSD.
The past week has underscored the delicate balance of forces influencing currency markets. Geopolitical events, particularly the escalation of tensions in the Middle East and Iran's declaration of control over the Strait of Hormuz, have sent shockwaves through commodity markets, with Brent crude oil surging past $110.64 and WTI nearing $101.19. This surge in energy prices, while potentially beneficial for commodity-exporting nations like Australia, also fuels inflation concerns globally. For AUDUSD, this creates a dichotomy: higher commodity prices could theoretically support the Australian Dollar, but the simultaneous rise in global risk aversion and a strengthening US Dollar often trumps this effect, leading to downward pressure.
The US Dollar Index (DXY) has demonstrated notable strength, climbing to 99.91. This upward momentum in the dollar is a significant headwind for AUDUSD. A stronger dollar typically makes dollar-denominated assets more expensive for holders of other currencies, and it often reflects a 'risk-off' sentiment where investors flock to perceived safe-haven assets. In this environment, even commodity currencies like the Australian Dollar can struggle to find traction, as the allure of dollar liquidity and safety takes precedence. The correlation between DXY and AUDUSD is a well-established dynamic, and its current manifestation suggests that any significant upward move in the dollar will likely cap rallies in the Aussie.
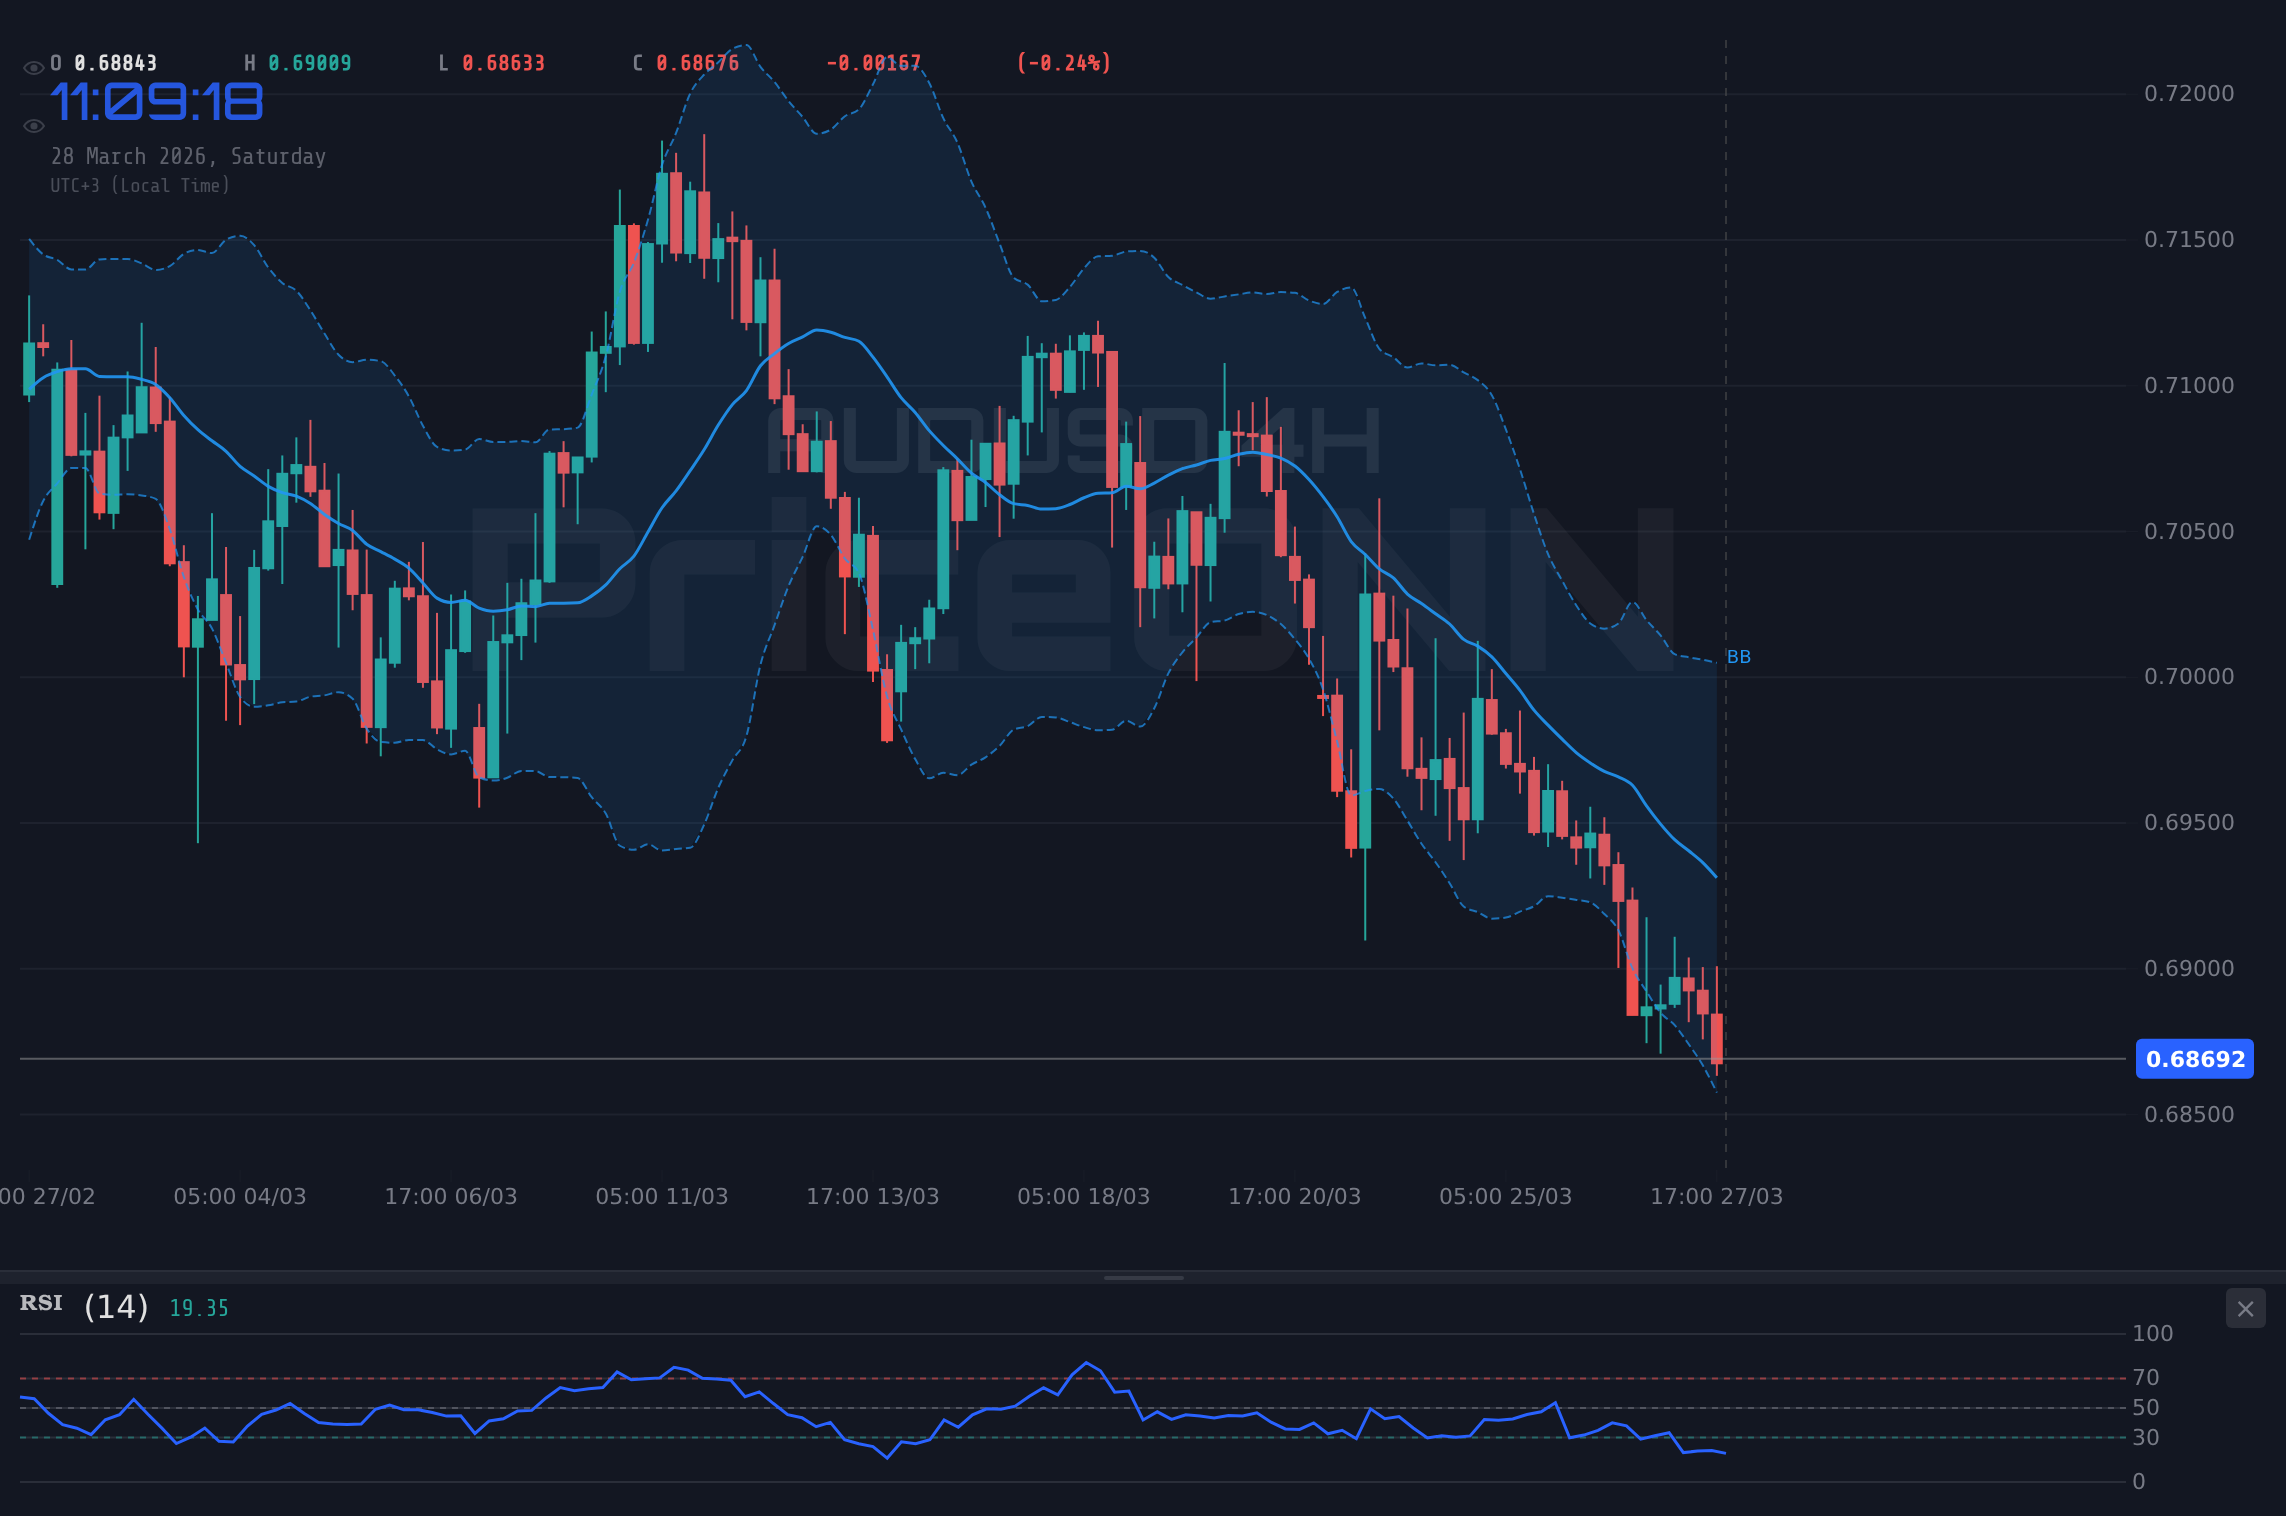
Technically, the AUDUSD pair presents a mixed but predominantly bearish picture across multiple timeframes. On the 1-hour chart, the trend is clearly bearish with an ADX of 21.96, indicating moderate trend strength. The RSI at 37.27 reinforces this downward momentum, although it's not yet in oversold territory. However, delving into the 4-hour timeframe, the picture becomes more nuanced. While the trend remains strongly bearish (ADX 24.01), the RSI has dipped to 29.27, firmly in oversold territory. This divergence between the trend strength and the oversold condition on the 4-hour chart is where potential short-term trading opportunities might emerge, typically in the form of a relief bounce or a minor retracement.
Navigating the Technical Landscape: A Deeper Dive
The daily chart paints a picture of consolidation with a bearish bias. The ADX at 24.76 suggests a moderate downtrend is in play, and the RSI at 37.44 confirms that momentum is leaning towards the downside, though not yet oversold. The Stochastic Oscillator, with %K at 8.04 and %D at 25.87, is deeply oversold, signalling potential for a bounce. However, the MACD histogram remains negative, indicating bearish momentum persists. Bollinger Bands on the daily chart are also positioned below the middle band, reinforcing the bearish sentiment. The immediate price action is key; a sustained move below the 0.68557 support level would likely accelerate the downtrend, targeting further lows.
The recent PriceONN market news highlights the sensitivity of AUDUSD to geopolitical events. Reports of escalating Middle East tensions and their impact on oil prices have been directly linked to the Australian Dollar's performance. For instance, the surge in oil prices, while a positive for commodity exporters, simultaneously increases inflation expectations, potentially complicating the policy outlook for central banks. This uncertainty often leads to increased volatility and a preference for safe-haven currencies, directly impacting pairs like AUDUSD. The news cycle suggests that any de-escalation in the Middle East could provide a reprieve for riskier assets, while further conflict would likely bolster the US Dollar and weigh on the Aussie.
The RBA's Cautious Stance and its Implications
The Reserve Bank of Australia (RBA) has maintained a cautious tone, as reflected in recent commentary and economic data releases. While the RBA's previous actions and forward guidance have aimed to balance inflation control with economic growth, the current global economic climate presents significant challenges. The latest economic calendar data shows mixed signals for the Australian economy, and the RBA's deliberate pace in adjusting monetary policy contrasts with the more aggressive stances taken by some other major central banks. This divergence can influence currency pairs, and in the case of AUDUSD, a less hawkish RBA compared to a potentially hawkish Fed (or even ECB) could contribute to sustained downward pressure.
Specifically, the economic data points, such as the recent [USD] figures showing actuals of 6.926 against a forecast of -1.3, underscore the volatility in macroeconomic indicators. Such surprises can lead to sharp repricing in currency markets. While this specific data point relates to the US, its implications for global monetary policy expectations and risk appetite are significant. For AUDUSD, the focus remains on how these global economic shifts, coupled with domestic inflation and employment figures, will shape the RBA's future decisions. The market's interpretation of these data points, and how they align or diverge from global trends, will be crucial for the pair's direction.
The technical indicators provide a granular view of the current market sentiment. On the 1-hour chart, the Stochastic Oscillator is showing %K at 79.89 and %D at 68.33, suggesting a bullish signal as %K crosses above %D. This contrasts with the overall bearish trend indicated by the RSI (44.1) and ADX (40.32). This suggests short-term traders might be looking for intraday opportunities, but the stronger trend on higher timeframes, like the 4-hour, points to a more dominant bearish narrative. The ADX at 40.32 on the 1-hour chart is particularly noteworthy, indicating a strong trend, albeit one that has been predominantly downwards on higher timeframes.
In the 4-hour timeframe, the Stochastic Oscillator (%K=17.45, %D=9.27) is deeply oversold, presenting a potential buy-the-dip opportunity for short-term traders if it crosses upwards. However, the MACD histogram is negative, and the RSI is at 35.25, reinforcing the bearish sentiment. The ADX here is at 30.97, confirming a strong downtrend. This conflict between an oversold Stochastic and a bearish MACD/RSI/ADX suggests caution. It implies that while a short-term bounce is possible, the underlying trend remains strongly bearish. The key will be whether any bounce can gather enough momentum to challenge higher resistance levels or if it merely serves as a prelude to further downside.
The daily chart analysis reveals a similar, albeit more consolidated, picture. The ADX at 17.3 indicates a weaker trend, suggesting that the market might be in a period of consolidation or indecision on a longer timeframe. The RSI at 41.43 is in neutral territory, leaning towards bearish, while the MACD histogram is negative. The Stochastic Oscillator (%K=14.87, %D=26.72) is also showing a bearish signal as %K is below %D and both are trending downwards. This suggests that while the strong downtrend might be pausing, there's no clear signal of a reversal yet. The AUDUSD is essentially treading water, awaiting a catalyst to break the current range. The support at 0.68557 and resistance at 0.69368 are the levels to watch for a directional breakout.
Key Levels and Potential Breakouts
The critical support level for AUDUSD currently sits at $0.68557. A decisive break and close below this level on the daily chart would likely trigger further selling, potentially targeting the next support at $0.68245 and then $0.67746. This scenario would be amplified if geopolitical tensions continue to escalate, driving safe-haven demand for the US Dollar and simultaneously pressuring commodity prices. On the upside, the immediate resistance is found at $0.68767. A convincing break above this level, followed by a hold above $0.69368, would be needed to signal a potential shift in sentiment. Such a move would likely require a de-escalation of global conflicts, a weakening of the DXY, or a significant shift in RBA policy expectations.
The ongoing geopolitical situation, especially concerning the Strait of Hormuz and potential disruptions to oil supply, remains a significant wildcard. If tensions escalate further, oil prices could continue their ascent, potentially boosting commodity currencies in theory. However, the dominant effect has been the flight to safety and the strengthening of the US Dollar. This dynamic suggests that even if oil prices remain elevated, the upward pressure on AUDUSD might be limited unless there is a broader shift in global risk sentiment or a change in Federal Reserve policy expectations. The market's reaction to these ongoing events will be critical in determining whether AUDUSD can break its current bearish consolidation.
The recent PriceONN market news has also highlighted the interplay between commodity prices and currency movements. The spike in urea prices, for instance, has been cited as a potential headwind for the Australian Dollar, indicating that not all commodity price movements translate into direct support for the AUD. This complexity means that traders cannot rely solely on oil price action to predict AUDUSD's direction. A more holistic view, incorporating interest rate differentials, risk sentiment, and the strength of the US Dollar, is essential.
Looking at the broader economic calendar, upcoming high-impact events, particularly those related to the US economy, will be closely watched. While the provided data lists several US events with mixed results (e.g., actuals vs. forecasts), any significant deviations in future releases, especially those concerning inflation or employment, could dramatically influence Fed expectations and, consequently, the DXY and AUDUSD. Similarly, any forward guidance from the RBA will be scrutinized for clues about the future path of Australian monetary policy. The market is currently pricing in a cautious approach from the RBA, and any indication of a more hawkish or dovish stance could trigger significant price action.
Trade Scenarios for AUDUSD
Given the current technical setup and macro-economic backdrop, several scenarios are plausible for AUDUSD in the coming week. The prevailing sentiment leans bearish, but the oversold conditions on the 4-hour chart suggest potential for short-term bounces. The probability estimates reflect this nuanced outlook, with a bearish scenario holding the highest probability, followed by a neutral consolidation, and a bullish reversal scenario carrying the lowest probability without significant shifts in market conditions.
Bearish Scenario: Downside Momentum Continues
65% ProbabilityNeutral Scenario: Range-Bound Consolidation
25% ProbabilityBullish Scenario: Short-Covering Rally
10% ProbabilityThe market sentiment remains cautious, largely dictated by external factors such as geopolitical developments and the US Dollar's strength. The AUDUSD pair is currently caught between the potential support offered by oversold indicators on higher timeframes and the prevailing bearish momentum and macro-economic headwinds. Traders are advised to monitor the key levels of $0.68557 for support and $0.69368 for resistance. A break of either will likely dictate the pair's direction in the short to medium term. The correlation with the DXY at 99.91 remains a critical factor, suggesting that any significant dollar weakness could provide an opportunity for AUDUSD to rebound, while dollar strength would likely reinforce the bearish case.
The technical indicators are painting a picture of caution. While the 4-hour RSI is oversold at 29.27, suggesting a potential for a bounce, the overall trend across daily and hourly charts remains bearish, with ADX readings indicating moderate to strong trend strength in the direction of the prevailing downtrend. The conflicting signals from different timeframes highlight the current indecision in the market. For AUDUSD to break out of its current range, a clear catalyst is needed – either a significant de-escalation of geopolitical risks, a dovish surprise from the Fed, or a more hawkish shift from the RBA. Until then, expect choppy price action around the $0.68761 level.
The rising oil prices, driven by geopolitical events, present an interesting dynamic. Theoretically, higher oil prices should support commodity currencies like the AUD. However, the stronger correlation with the US Dollar's safe-haven appeal has, thus far, overshadowed this effect. The DXY at 99.91 is a testament to this. If the geopolitical situation stabilizes, we might see the commodity-driven support for AUDUSD re-emerge. But until then, the path of least resistance appears to be downwards, especially if the US Dollar continues its upward march.
From a fundamental perspective, the RBA's cautious approach continues to be a factor. While inflation remains a concern globally, the RBA has signaled a patient approach. This contrasts with potential rate hike expectations elsewhere, particularly in the US, which could widen interest rate differentials in favor of the dollar. Upcoming economic data releases for both the US and Australia will be crucial in shaping these expectations. Traders should pay close attention to any surprises in inflation or employment figures, as these could provide the necessary catalyst for AUDUSD to break its current range.
Frequently Asked Questions: AUDUSD Analysis
What happens if AUDUSD breaks below the $0.68557 support level?
If AUDUSD breaks decisively below the $0.68557 support level, the bearish trend is likely to accelerate. This could target the next significant support at $0.68245, with a further move towards $0.67746 if selling pressure intensifies. This scenario is more probable if geopolitical tensions escalate and the US Dollar continues to strengthen.
Should I consider buying AUDUSD at current levels of $0.68761 given the oversold 4-hour RSI?
While the 4-hour RSI at 29.27 indicates oversold conditions, suggesting a potential for a short-term bounce, the overall trend remains bearish. A contrarian buy here would be high-risk, requiring strong confirmation. A safer approach might be to wait for a confirmed break above $0.68767 resistance, or a clear bullish reversal pattern forming on the daily chart, which currently has a low probability.
Is the Stochastic Oscillator at 8.04 a strong sell signal for AUDUSD on the daily chart?
The Stochastic Oscillator on the daily chart, with %K at 8.04 and %D at 25.87, indicates deeply oversold conditions, which is typically a signal for potential price stabilization or a reversal upwards, NOT a sell signal. However, it must be interpreted alongside other indicators like the MACD and RSI, which currently show bearish momentum. This oversold reading suggests that any downward move might be losing steam, but it doesn't guarantee a reversal without further bullish confirmation.
How will the ongoing Middle East tensions and rising oil prices affect AUDUSD this week?
Escalating Middle East tensions and rising oil prices (Brent near $110.64) typically increase global risk aversion, strengthening the US Dollar. While higher commodity prices could theoretically benefit the AUD, the dominant effect has been the flight to safety, pressuring AUDUSD. A de-escalation would be needed for the commodity-driven support to outweigh the dollar's strength and potentially lift AUDUSD.
The week ahead will likely see AUDUSD continue to gyrate around current levels unless a significant catalyst emerges. The interplay between geopolitical risks, commodity prices, and the US Dollar's trajectory will remain the primary drivers. Traders should remain vigilant, focusing on the key support at $0.68557 and resistance at $0.69368. While the technical indicators on higher timeframes suggest bearish momentum, the oversold conditions on the 4-hour chart hint at the possibility of short-term counter-trend moves. Patience and disciplined risk management will be crucial in navigating this uncertain landscape.
Track markets in real-time
AI-powered analysis, technical indicators and real-time price data.
Join Our Telegram Channel
Breaking market news, AI analysis and trading signals instantly.
Join Channel