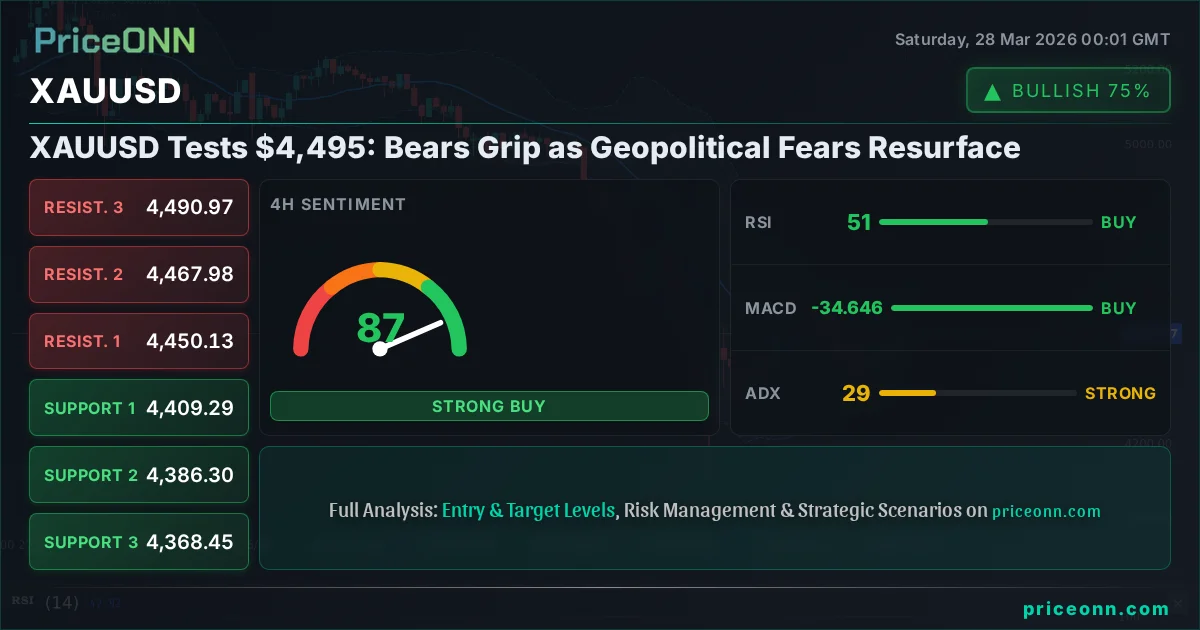
XAUUSD Tests $4,495: Bears Grip as Geopolitical Fears Resurface
Gold struggles near $4,495 amid escalating global tensions and a strengthening dollar. Technicals show mixed signals across timeframes, demanding caution.
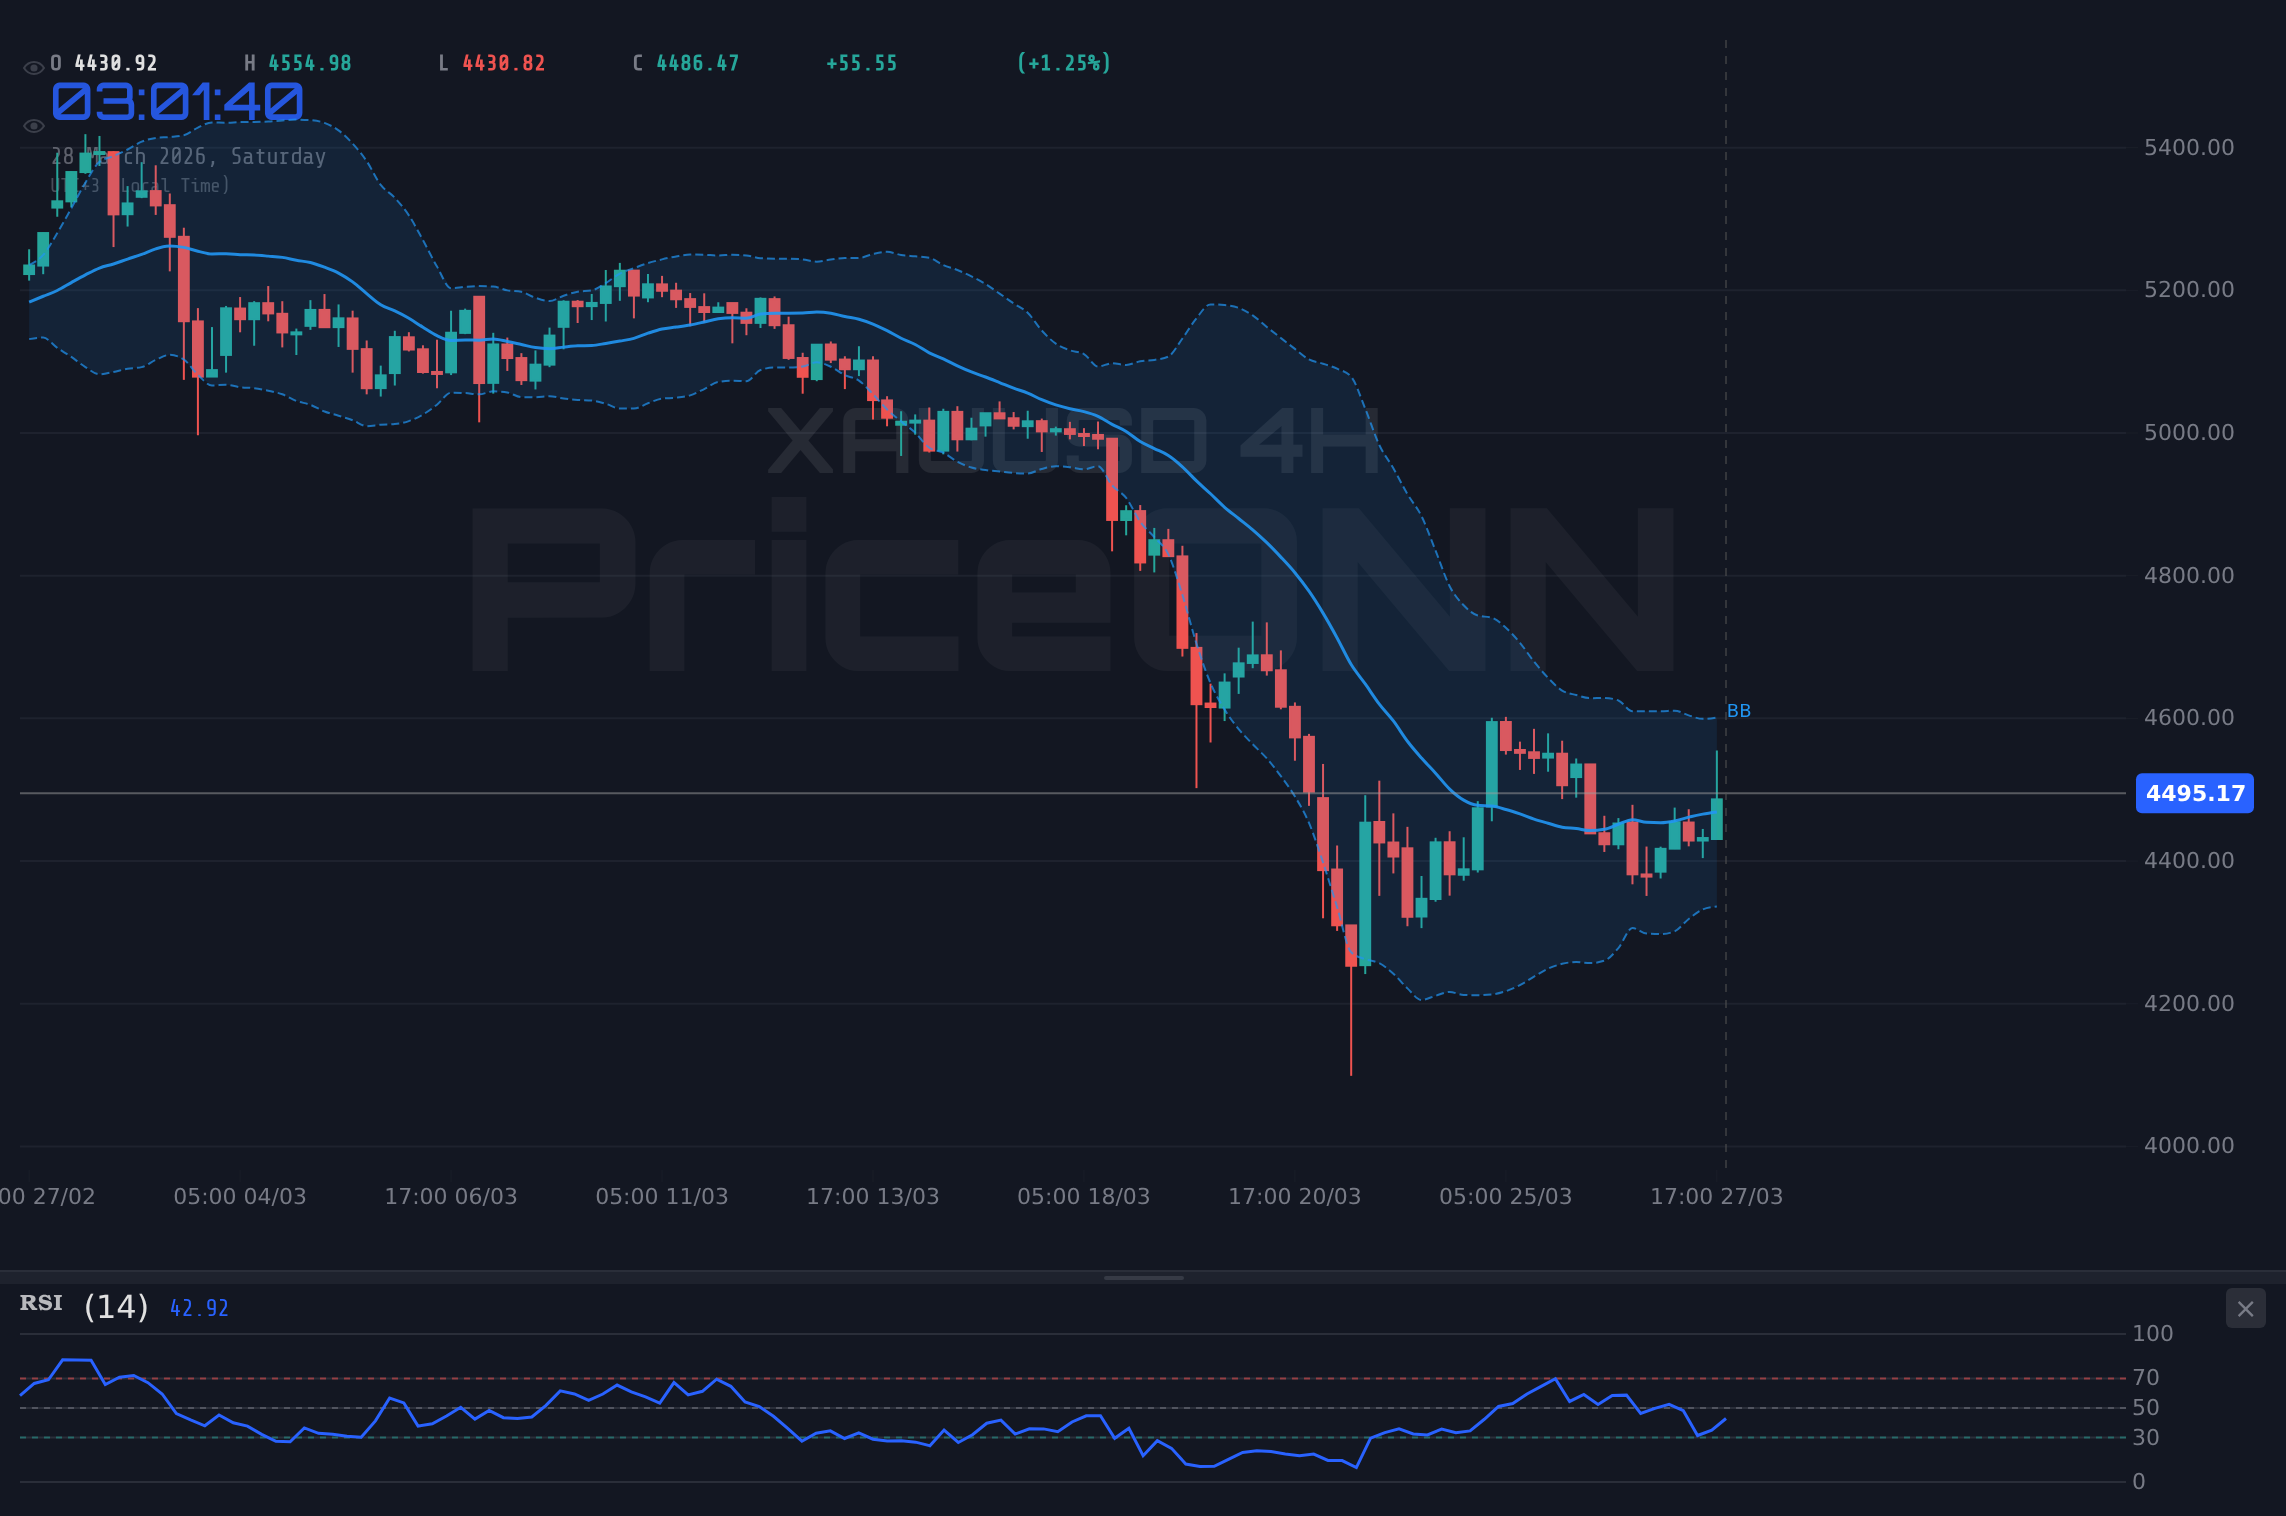
The geopolitical chessboard is shifting, and gold, the eternal safe haven, is finding itself at a critical juncture, hovering precariously around the $4,495 mark. Last week's price action for XAUUSD was a dramatic affair, marked by a significant rally that saw prices surge towards $4,554 before a sharp pullback brought them back to the $4,495 vicinity. This whipsaw movement highlights the intense tug-of-war between haven demand fueled by escalating global tensions and the persistent strength of the US Dollar. As we step into a new trading week, the key question for traders and investors alike is whether the underlying bullish drivers are strong enough to overcome the headwinds of a robust dollar and potential profit-taking after last week's volatility.
- XAUUSD faces resistance near $4,495.44, with RSI at 67.34 on the 1D chart indicating overbought conditions are approaching, suggesting potential for a pullback.
- Critical support for gold is identified at $4,492.65 on the 1H chart, a level that must hold to prevent a deeper correction.
- The ADX at 13 on the 1H chart suggests a weak trend, indicating that the current price action may be more consolidation than a committed breakout.
- The strengthening DXY, currently at 99.91, continues to exert pressure on gold prices, creating a correlated bearish dynamic for the precious metal.
Last week's market narrative was dominated by a confluence of factors that sent gold on a rollercoaster ride. The escalating geopolitical climate, particularly concerning the Middle East, acted as a significant catalyst for haven demand. Reports of heightened tensions and potential disruptions in energy supply routes typically drive investors towards assets perceived as safe havens, with gold often being the primary beneficiary. This underlying fear premium was clearly reflected in the initial surge in gold prices, pushing it towards the upper bounds of its recent trading range. However, the narrative is rarely that simple in financial markets. The US Dollar Index (DXY), a key barometer of the dollar's strength against a basket of major currencies, has shown remarkable resilience, currently trading around 99.91. A stronger dollar inherently makes gold more expensive for holders of other currencies, acting as a dampener on price increases, and can even trigger sell-offs as international buyers step back.
The interplay between these two forces - geopolitical fear driving gold bids and dollar strength capping gains - created a volatile environment. The initial surge on haven demand was potent, but as the week progressed, the persistent strength of the dollar began to assert itself, leading to the sharp pullback observed from the weekly highs. This dynamic is crucial for understanding the current technical picture. While the daily chart might still show signs of upward momentum, the intraday and 4-hour charts are painting a more nuanced, and perhaps cautionary, tale. Traders are now dissecting whether the recent rally was a sustainable move higher or merely a temporary reaction to global headlines, with the dollar's strength acting as a significant counter-argument.
Looking at the technical indicators, the picture is indeed mixed, reflecting the conflicting forces at play. On the 1-hour chart, gold presents a neutral trend with moderate strength (ADX 24.26), but the RSI at 56.67 suggests a slight upward bias, while Stochastic oscillators hint at a potential short-term dip (%K < %D). This intraday indecision is amplified when we switch to the 4-hour timeframe. Here, the trend is still leaning towards a decline (ADX 28.83), even though the RSI shows a slight upward tendency and Stochastic signals a potential rise. The daily chart, however, paints a decidedly more bearish picture, with a strong downtrend (ADX 30.99), a declining RSI at 36.34, and negative MACD momentum. This divergence across timeframes is precisely what creates trading opportunities but also demands a high degree of precision and risk management. The ability to interpret these conflicting signals and identify confirmation points is paramount.
The current price of $4,495.44 sits just above the 1-hour support level of $4,492.65. This proximity is critical. A break below this immediate support could trigger further selling pressure, potentially targeting the next 1-hour support at $4,468.70. The 4-hour chart identifies stronger support zones at $4,409.29 and $4,386.30, levels that were tested during last week's price swings. On the resistance side, the 1-hour chart shows immediate hurdles at $4,534.50 and $4,552.40. Clearing these levels would be necessary to invalidate the short-term bearish sentiment and suggest a continuation of the upward move. The daily resistance at $4,497.62 is particularly significant; holding below this level on a closing basis would reinforce the bearish outlook from the daily timeframe.
The broader macroeconomic backdrop continues to be a significant factor influencing gold's trajectory. The Federal Reserve's stance on monetary policy remains a key driver. While inflation data has shown signs of persistence, the market is keenly watching for any signals from Fed officials regarding future interest rate decisions. Any indication of a more hawkish tone - suggesting higher-for-longer interest rates - could strengthen the dollar and weigh on gold. Conversely, any hint of a dovish pivot or a pause in rate hikes could provide a significant tailwind for the precious metal. The current market pricing, as reflected in Fed Fund Futures, shows a degree of uncertainty, and upcoming economic data releases, such as employment figures and inflation reports, will be crucial in shaping these expectations. The correlation between gold and the dollar remains a central theme, and any shift in Fed policy expectations will likely be amplified through this channel.
The energy markets, particularly oil prices, also play a crucial role in the gold narrative. Brent crude oil, currently trading around $110.64, has seen a substantial surge, driven by geopolitical tensions and supply concerns. Higher oil prices can fuel inflation expectations, which in turn can boost demand for gold as an inflation hedge. This was evident last week as oil prices climbed significantly, contributing to gold's initial rally. WTI crude, trading at $101.19, mirrors this trend. The delicate balance between supply disruptions and global demand, especially with China's economic activity still a point of focus, will be critical. If oil prices continue to climb due to geopolitical escalation, it could provide further support for gold, even in the face of a strong dollar. However, a sudden easing of tensions or a significant increase in oil supply could have the opposite effect.
The equity markets, represented by the S&P 500 (currently at 6,357.55) and Nasdaq 100 (at 23,092.50), are also painting a picture of caution. Both indices experienced significant declines last week, reflecting a broader risk-off sentiment in the market. When major stock indices tumble, investors often seek refuge in safe-haven assets like gold. This inverse correlation between equities and gold is a well-established market dynamic. The sharp sell-off in stocks suggests that broader market participants are becoming more risk-averse, which should theoretically benefit gold. However, as we've seen, the dollar's strength has been a significant counteracting force, preventing gold from fully capitalizing on the risk-off move. The direction of equities in the coming week will be closely watched; a continued decline could provide a strong tailwind for gold, provided the dollar doesn't surge in tandem.
Silver, often considered gold's more volatile cousin, is trading around $69.74. Like gold, XAGUSD experienced a significant rally followed by a pullback. The daily chart shows a strong downtrend with ADX at 27.62, and RSI at 38.53, suggesting room for further downside or a potential bounce from oversold conditions. The 1-hour chart, however, shows a neutral trend with a slight upward bias from RSI, while Stochastic signals a potential dip. The mixed signals in silver mirror those in gold, reinforcing the idea that the precious metals complex is at a crossroads, heavily influenced by external macro factors rather than purely internal market dynamics. The performance of silver will likely continue to track gold, but with potentially amplified volatility.
Considering the technical landscape across different timeframes, a multi-faceted approach is necessary. The 1-hour chart, while showing some upward momentum, is capped by resistance and hints at short-term weakness. The 4-hour chart presents a more balanced view, with conflicting signals between RSI and Stochastic, but still leans towards a weaker trend. The daily chart, however, remains the most bearish, indicating that any upward moves might be opportunities for sellers to re-enter the market at better levels, especially if the dollar continues its ascent. This divergence suggests that while there might be short-term trading opportunities, the longer-term trend on the daily chart needs to be respected. A decisive break above the daily resistance at $4,497.62 would be required to shift the daily outlook, but with the DXY strong and equity markets showing weakness, this seems like an uphill battle for gold bulls in the immediate term.
The recent news flow, particularly regarding geopolitical events and central bank commentary, will continue to be a primary driver. Any escalation in the Middle East or unexpected statements from Federal Reserve officials could trigger significant price swings in gold. The market's reaction to upcoming US economic data will be crucial. Stronger-than-expected employment or inflation figures could reinforce the Fed's hawkish stance, boosting the dollar and pressuring gold. Conversely, weaker data could lead to dollar weakness and a potential rally in the precious metal. The market is essentially waiting for a clearer signal from either the geopolitical front or the macroeconomic data to break the current stalemate around the $4,495 level.
From a trading perspective, the current price action around $4,495.44 demands a high degree of caution. The conflicting signals across timeframes and the strong influence of external factors like the DXY and oil prices mean that clear directional conviction is difficult to establish. Scalpers might find opportunities in the intraday fluctuations, looking to capitalize on short-term momentum shifts. However, swing and position traders would likely be wise to wait for a clearer breakout or breakdown signal. A decisive move above the daily resistance at $4,497.62, confirmed by strengthening momentum and dollar weakness, could signal a move towards higher targets. Conversely, a breakdown below the 1-hour support at $4,492.65, especially if accompanied by a rising DXY and falling equities, could open the door for a deeper correction towards the $4,400s.
The strength of the US dollar, currently testing the 100 mark on the DXY, is a significant factor that cannot be ignored. With the DXY at 99.91, it's exerting considerable pressure on gold. This inverse correlation means that as the dollar strengthens, gold tends to weaken, and vice versa. The market sentiment analysis suggests a complex interplay; while geopolitical risks are typically bullish for gold, the dollar's resilience is acting as a strong counterweight. The recent price action, with gold failing to hold onto gains above $4,500 despite the elevated risk environment, underscores the dollar's dominant influence in the current market dynamics. This suggests that any sustained rally in gold might be contingent on a notable weakening of the dollar, which could stem from a shift in Federal Reserve policy expectations or a significant de-escalation of global tensions.
The energy complex, with Brent crude oil trading above $110 and WTI near $101, continues to be a key inflation indicator. These elevated oil prices contribute to the inflationary narrative, which historically supports gold as an inflation hedge. The surge in oil prices, driven by supply concerns and geopolitical risks in the Middle East, has undoubtedly added a bullish undertone to gold. However, the market's ability to price in this inflation risk seems to be tempered by concerns over economic growth and the Fed's response. If oil prices continue to spike without a corresponding easing of geopolitical fears or a dovish shift from the Fed, it could create a stagflationary environment, which is typically very bullish for gold. But for now, the dollar's strength is overshadowing this potential inflationary tailwind.
The equity markets' performance provides another layer of context. The significant drops in the S&P 500 and Nasdaq 100 indices last week indicate a clear risk-off sentiment among investors. This flight to safety typically benefits assets like gold. The fact that gold did not fully capitalize on this risk aversion, largely due to dollar strength, suggests that the market is in a delicate balance. If equity markets continue their downward trajectory, it could eventually force the dollar to weaken as global liquidity tightens, or it could lead to a flight to both dollars and gold, creating a complex scenario. For gold to truly benefit from a stock market sell-off, we would likely need to see a concurrent weakening of the dollar, or a further escalation of geopolitical risks that overrides dollar strength.
Technically, the divergence in signals across different timeframes is the most salient feature. The 1-hour chart shows a neutral trend with some upward bias but faces immediate resistance. The 4-hour chart presents a more balanced, yet still somewhat cautious, outlook. The daily chart, however, remains firmly in bearish territory, with strong downtrend indicators like ADX 30.99 and a lagging RSI at 36.34. This daily bearishness suggests that any rallies might be short-lived unless significant catalysts emerge. The key battleground remains around the $4,495-$4,497 area. A failure to decisively break and hold above this resistance zone could lead to a retest of the lower support levels, particularly the 1-hour support at $4,492.65. The broader market sentiment, driven by the DXY and equity performance, will likely dictate which direction gold breaks from this current consolidation.
Bearish Scenario: Dollar Strength Dominates
65% ProbabilityNeutral Scenario: Range-Bound Consolidation
25% ProbabilityBullish Scenario: Geopolitical Fears Overwhelm Dollar
10% ProbabilityThe path forward for gold hinges on the interplay of these technical levels and the evolving macro landscape. The immediate focus will be on whether XAUUSD can sustain its position above the critical $4,495 level. A failure to do so, especially with the dollar showing strength and equities in retreat, could signal a deeper correction. Conversely, a decisive break higher, supported by geopolitical escalations or a weakening dollar, could reignite bullish sentiment. Traders must remain vigilant, manage risk effectively, and wait for clear signals before committing to positions. The market is currently in a state of flux, and patience will likely be rewarded.
Frequently Asked Questions: XAUUSD Analysis
What happens if XAUUSD breaks below the 1-hour support at $4,492.65?
A break below $4,492.65 on the 1-hour chart would invalidate the immediate bullish consolidation and could trigger a move towards the next support at $4,468.70. This scenario is more probable if the DXY continues to strengthen and equity markets remain under pressure.
Should I buy XAUUSD at current levels around $4,495 given the mixed daily and 1-hour signals?
Given the conflicting signals across timeframes and the strong influence of the DXY at 99.91, buying at current levels carries significant risk. A high-probability setup would require a confirmed break above daily resistance at $4,497.62 with dollar weakness, or waiting for a clear signal near oversold levels on the daily chart if a deeper pullback occurs.
Is the RSI at 67.34 on the 1D chart a sell signal for XAUUSD right now?
An RSI of 67.34 on the daily chart indicates strong upward momentum but is approaching overbought territory, suggesting that the rally might be losing steam. It is not an immediate sell signal on its own but warrants caution and suggests that further upside may be limited without a significant catalyst or dollar weakness.
How will the ongoing geopolitical tensions in the Middle East affect XAUUSD this week?
Escalating geopolitical tensions typically increase safe-haven demand for gold, potentially driving prices higher. However, this effect is currently being counteracted by a strong US Dollar. A significant escalation could overwhelm dollar strength, pushing XAUUSD towards resistance levels like $4,534.50, while de-escalation could reduce haven demand.
Technical Outlook Summary
| Indicator | Value | Signal | Interpretation |
|---|---|---|---|
| RSI (14) | 67.34 | Neutral | Approaching overbought on 1D, suggests caution. |
| MACD Histogram | -0.15 | Bullish | Positive momentum on 1H, but needs to confirm trend. |
| Stochastic | K=63.22, D=69.29 | Bearish | %K < %D on 1H, signals potential short-term pullback. |
| ADX | 24.26 | Neutral | Moderate trend strength on 1H; breakout not yet confirmed. |
| Bollinger | Middle Band | Bullish | Price above middle band on 1H, indicating upward bias. |
Key Levels
Track markets in real-time
AI-powered analysis, technical indicators and real-time price data.
Join Our Telegram Channel
Breaking market news, AI analysis and trading signals instantly.
Join Channel