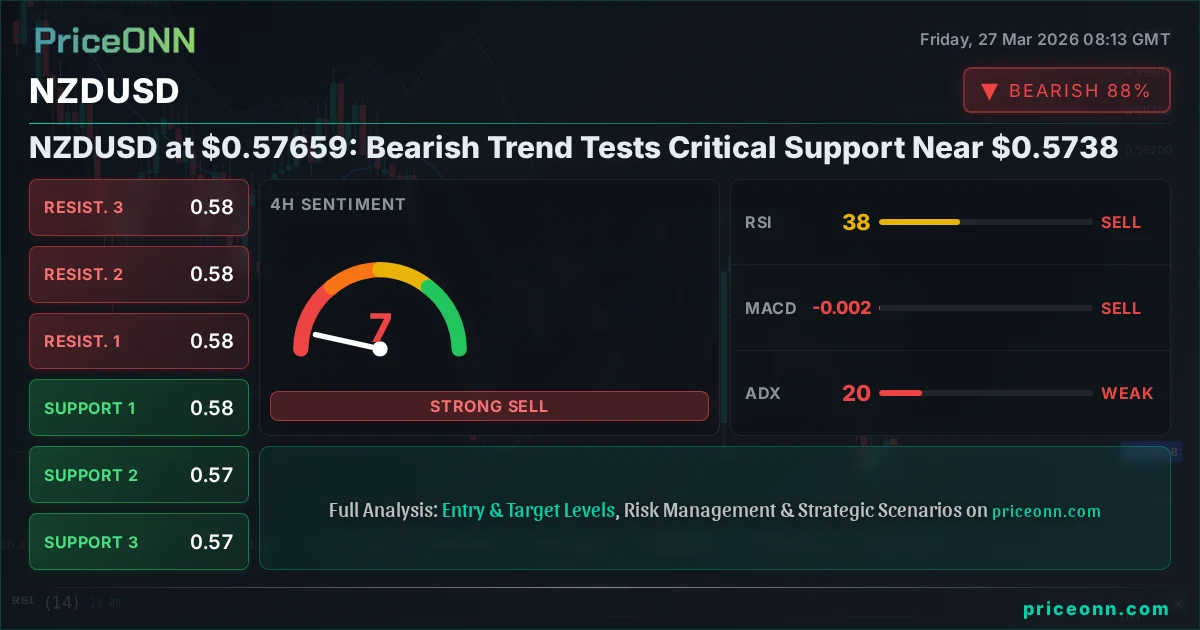
NZDUSD at $0.57659: Bearish Trend Tests Critical Support Near $0.5738
NZDUSD faces renewed selling pressure, trading at $0.57659. The bearish trend targets support near $0.5738 as indicators show weakness.
The Forex market is a constant dance between opportunity and risk, and right now, the NZDUSD pair is offering a compelling, albeit cautious, picture for traders. With the current price hovering at $0.57659, the dominant bearish trend is testing key support levels, with $0.5738 emerging as a critical juncture. This isn't just about watching numbers on a screen; it's about understanding the forces driving this pair and preparing for potential moves. As a seasoned trader, I always emphasize that discipline and a clear understanding of the technical landscape are paramount, especially when the market shows conflicting signals across different timeframes.
- NZDUSD is trading at $0.57659, with a strong bearish trend indicated by 4H and 1D ADX values above 30.
- Key support is identified at $0.57378, with further levels at $0.57144 and $0.56794.
- The 1H RSI at 41.7 suggests downward momentum, while the 4H RSI at 38.31 reinforces this bearish outlook.
- DXY is currently at 99.79, showing strength which typically correlates with pressure on pairs like NZDUSD.
Navigating the Bearish Current: A Multi-Timeframe Perspective
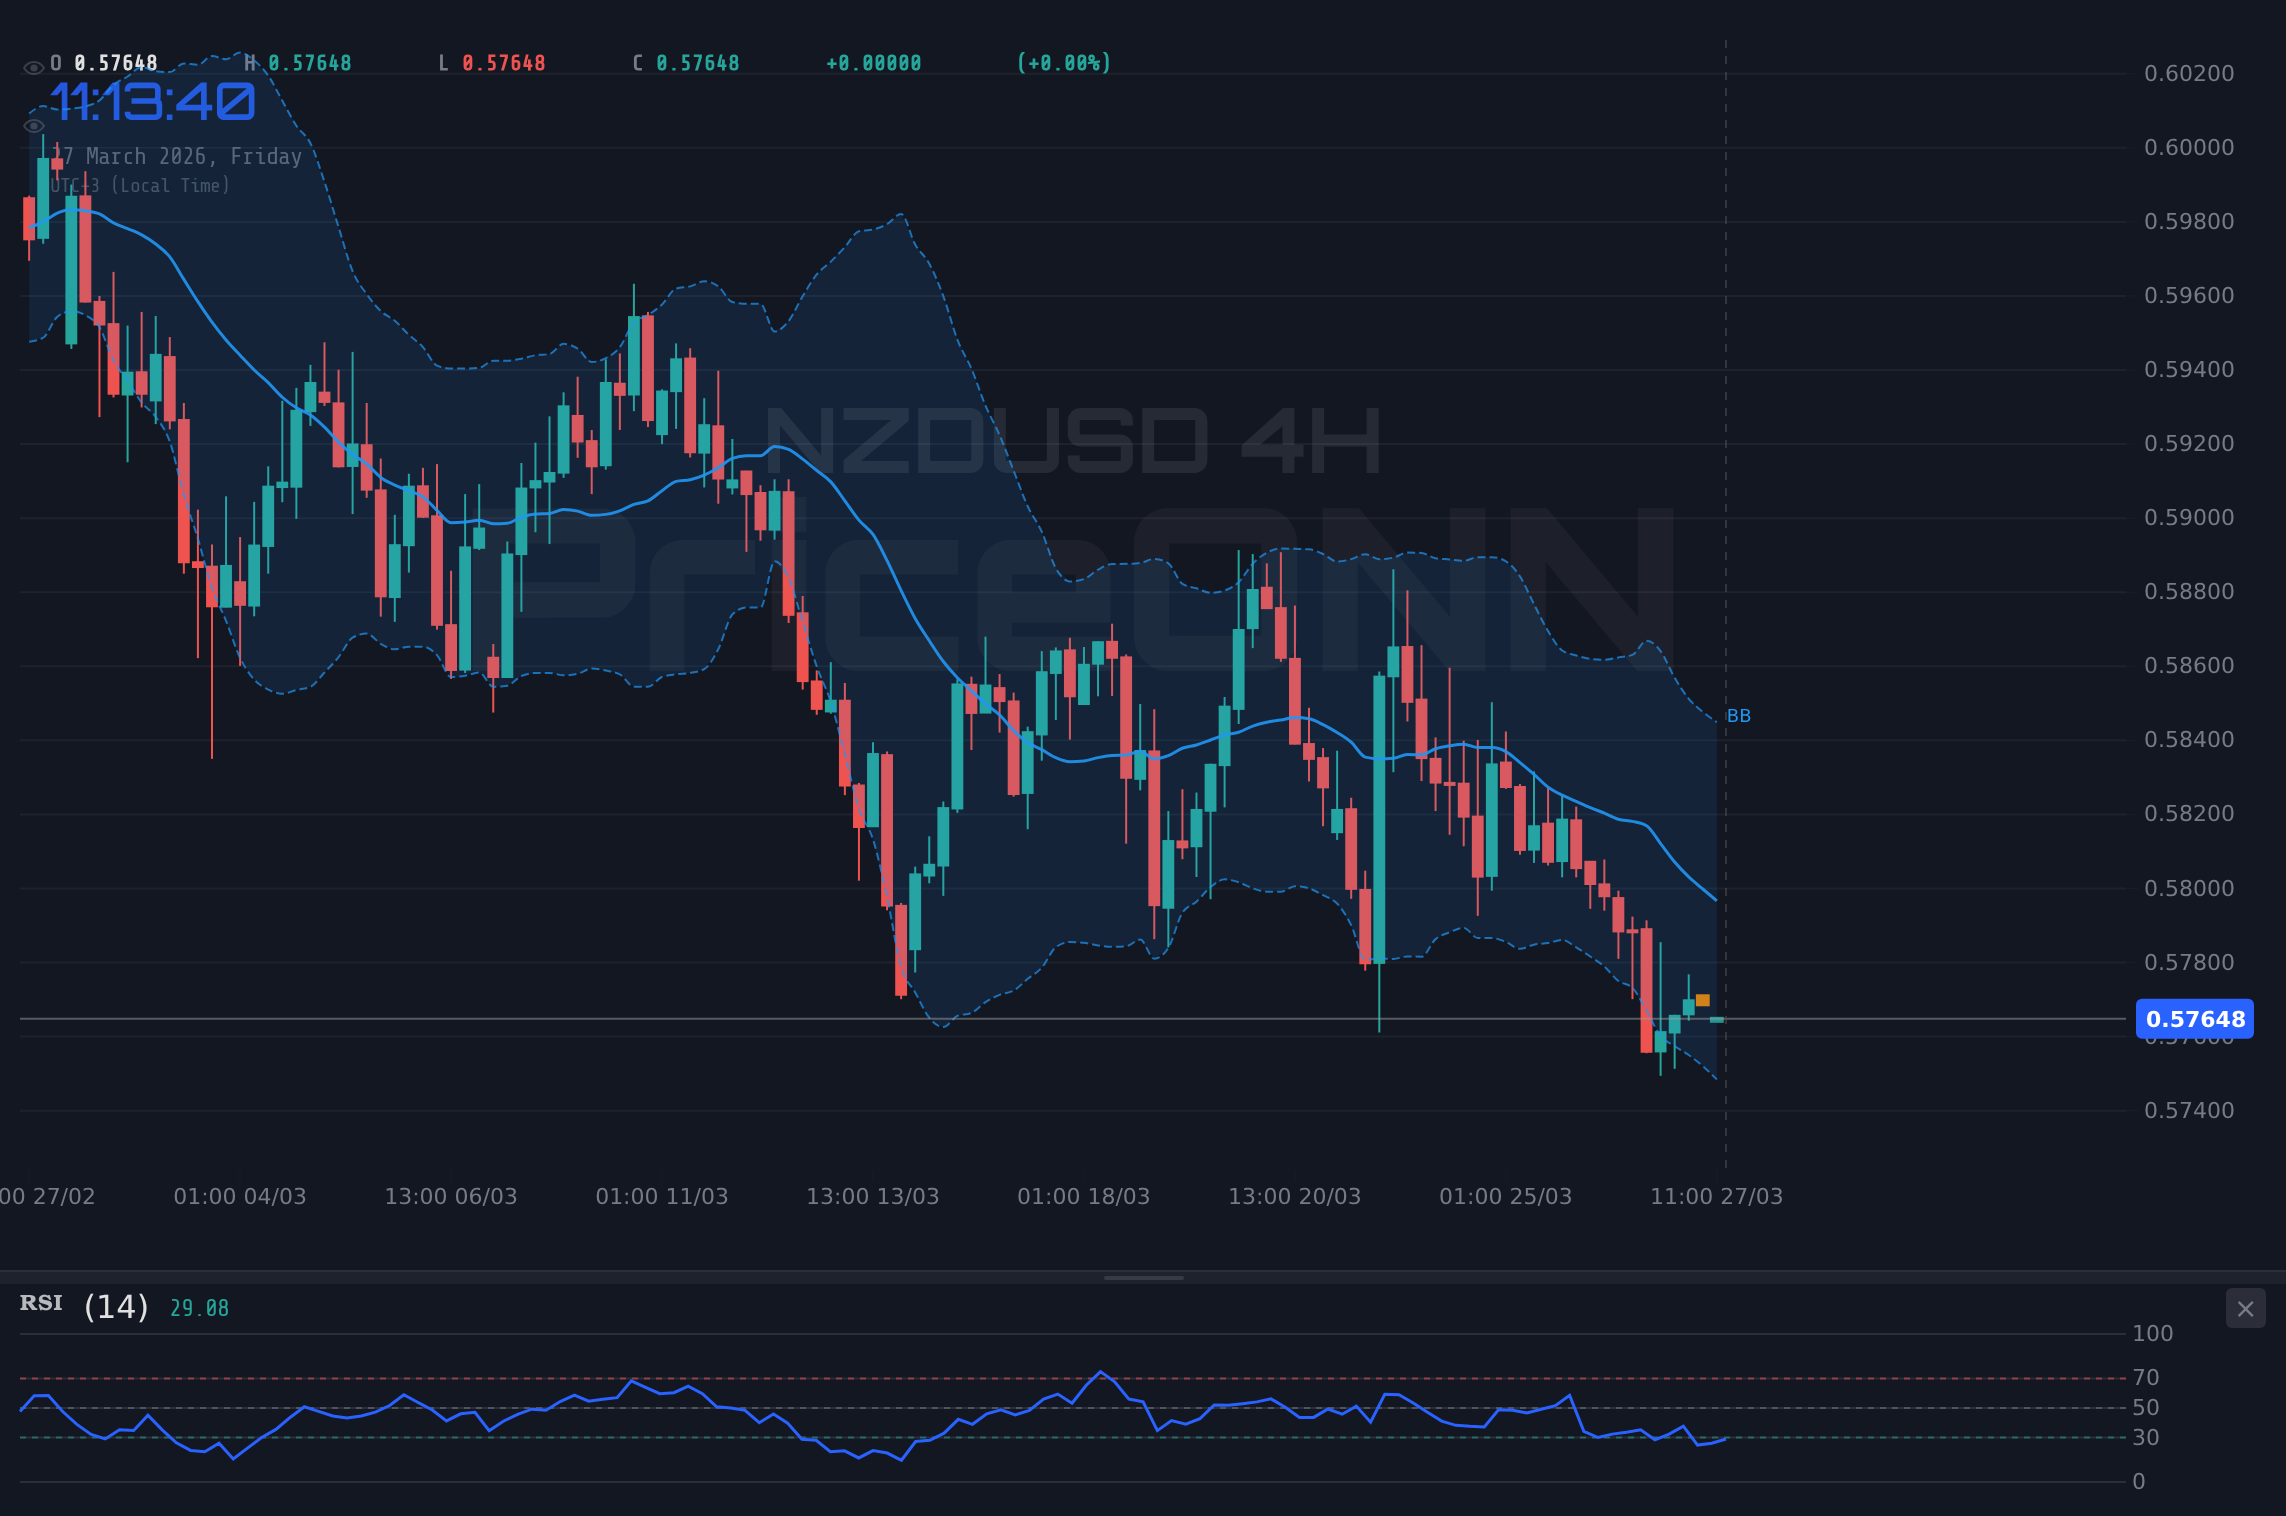
When we delve into the technicals of NZDUSD, the narrative across multiple timeframes paints a clear picture of bearish dominance, though with nuances that demand attention. On the 4-hour chart, the trend is decidedly bearish, boasting a strength of 90%. This is supported by an ADX reading of 19.79, indicating a moderately strong trend. The Relative Strength Index (RSI) at 38.31 on the daily chart, while in the neutral zone, clearly shows a downward eğilim. This suggests that sellers are still in command, and any upward retracements are likely to be met with resistance.
The 1-hour chart, however, presents a slightly different, more neutral, picture with a trend strength of 50%. Here, the RSI at 41.7 indicates a bearish lean within a broader neutral range, and the ADX at 15.9 points to weak trending conditions. This divergence between the shorter and longer timeframes is crucial. It suggests that while the overall direction is down, the immediate intraday action might involve consolidation or minor bounces before the next leg lower. For traders, this zone of conflicting signals is precisely where careful observation and risk management become non-negotiable. We're not seeing a full-blown trend reversal on the 1H, but the overwhelming bearish pressure from the 4H and Daily charts cannot be ignored.
The Stochastic indicator on the 4-hour chart, with %K at 21.56 and %D at 15.1, is currently in oversold territory and showing a bullish crossover signal. This is a stark contrast to the daily Stochastic, which is at 17.41/%K and 34.5/%D, showing a bearish signal. This conflict highlights the choppiness within the broader downtrend. It's a classic scenario where short-term oversold conditions might lead to temporary bounces, but the larger trend is still dictating the overall direction. The key is not to get caught chasing these short-term fluctuations without understanding the bigger picture. We need to see a clear break of key levels or a sustained shift in momentum across multiple timeframes before considering a significant shift in strategy.
Furthermore, the MACD indicator on the daily timeframe shows negative momentum, with the histogram below zero and the MACD line below the signal line. This reinforces the bearish sentiment. However, the 1-hour MACD shows positive momentum, with the histogram above zero. This again points to intraday fluctuations that might not reflect the dominant trend. When we see such divergences, it’s a sign that the market is in a state of flux, and patience is key. Trying to force a trade in such conditions often leads to whipsaws and unnecessary losses. Instead, it's wiser to wait for clearer signals, perhaps a decisive break of a key support or resistance level, or a confluence of indicators across timeframes.
The Bollinger Bands also offer insights. On the 1-hour chart, NZDUSD is trading below the middle band, suggesting a bearish inclination. The 4-hour chart shows the price below the middle band as well, reinforcing the downtrend. On the daily chart, the price is also hugging the lower Bollinger Band, indicating significant selling pressure and potential for oversold conditions to develop further. When price consistently stays below the middle band, especially across higher timeframes, it signals a strong bearish sentiment that is unlikely to reverse without a significant catalyst or a clear shift in underlying market conditions. This technical setup strongly suggests that any rallies are likely to be capped by the middle band, acting as dynamic resistance.
The current technical setup on NZDUSD shows a strong bearish trend, but the conflicting signals between short-term and long-term timeframes, particularly with the Stochastic and MACD, indicate a potentially choppy market. Traders should exercise extreme caution, manage risk tightly, and wait for clearer confirmation before entering positions. False breakouts and temporary bounces are highly probable in this environment.
The Dollar's Shadow: DXY and its Influence
No analysis of a major forex pair like NZDUSD is complete without considering the influence of the US Dollar Index (DXY). Currently, the DXY is trading at 99.79, showing a bullish daily direction and a strong daily trend. This strengthening dollar acts as a headwind for riskier assets and currencies like the New Zealand Dollar. Historically, a rising DXY often correlates with pressure on pairs like NZDUSD, as the US dollar becomes relatively more attractive to investors.
The DXY's upward movement, confirmed by its RSI at 60.82 on the daily chart and a robust ADX of 31.81, suggests that the dollar is gaining momentum. This macro backdrop reinforces the bearish case for NZDUSD. When the greenback is strengthening, it typically means that capital is flowing into US dollar-denominated assets, potentially pulling funds away from currencies like the NZD, which is often considered a risk-sensitive currency. This correlation is not always perfect, but it's a significant factor that traders must monitor. A strong dollar can exacerbate downward moves in NZDUSD, even if domestic factors for the kiwi were slightly more positive.
The 4-hour chart for DXY shows a neutral trend strength (50%) but a bullish bias with RSI at 64.51. The Stochastic indicator in this timeframe is in the overbought zone, which might suggest a temporary pause or pullback in dollar strength. However, the daily trend remains firmly bullish, indicating that the overarching strength of the dollar is likely to persist. This means that any rallies in NZDUSD might be short-lived as long as the DXY continues its upward trajectory. The interplay between the DXY and NZDUSD is a critical element in understanding the pair's potential price action in the coming days and weeks.
Considering the DXY's current position near the 100.00 psychological level, a break above this significant barrier could further bolster the dollar's strength and intensify the selling pressure on NZDUSD. Conversely, a failure of the DXY to hold its gains and a subsequent move lower could provide some relief for NZDUSD, potentially fueling a short-covering rally. Therefore, monitoring the DXY's price action around this key psychological level is as important as analyzing NZDUSD's own technicals.
The correlation between DXY and NZDUSD is typically inverse. When DXY rises, NZDUSD tends to fall, and vice versa. With the DXY at 99.79 and showing a strong daily uptrend, this inverse relationship suggests that NZDUSD is likely to face continued headwinds. Traders should be looking for confirmation: if the DXY breaks above 100.00, it would significantly increase the probability of further downside for NZDUSD. If the DXY falters and pulls back, it could offer a window of opportunity for NZDUSD to find some footing, though the underlying bearish trend on the pair itself would still need to be respected.
Always check the DXY's performance before placing a trade on NZDUSD. A strong dollar environment generally makes it harder for riskier currencies like the NZD to appreciate. Look for divergences or strong correlations to inform your entry and exit strategy.
Economic Undercurrents: What the Data Suggests
While the technical charts provide a visual roadmap, the underlying economic fundamentals often dictate the longer-term direction of currency pairs. For NZDUSD, both New Zealand's economic outlook and global macroeconomic trends play a crucial role. Recent economic data has painted a mixed picture for New Zealand, with concerns about inflation and economic growth persisting. This environment often leads to a weaker currency as central banks may be hesitant to aggressively tighten policy for fear of stifling already fragile growth.
Looking at the provided economic calendar data, we see several high-impact events that could influence NZDUSD. For instance, recent USD data shows a mixed bag: the [USD] ISM Services PMI came in at 52.4, beating the forecast of 51.5, which is dollar-positive. However, another [USD] release showed an unexpected drop in manufacturing orders. These conflicting data points can lead to increased volatility in the dollar, and consequently, in pairs like NZDUSD. Traders need to digest these releases carefully, looking for consistent trends rather than isolated figures.
The [GBP] data point showing '3' actual, forecast, and previous is likely related to interest rate decisions or inflation figures. If it's an interest rate decision, a hold at 3% might be neutral, but the commentary accompanying it would be crucial. For NZDUSD, the focus is on how these global economic shifts impact RBNZ (Reserve Bank of New Zealand) policy expectations. A more dovish RBNZ stance, perhaps due to domestic economic weakness, would further weigh on the NZD.
The significant increase in [USD] data, from 6.156 to 6.926 (likely related to durable goods orders or trade balance), is a strong indicator of economic activity in the US. This supports the dollar's strength we're seeing in the DXY and adds another layer to the bearish argument for NZDUSD. Conversely, if upcoming US data disappoints, it could provide a reprieve for NZDUSD, but the pair's own technical weaknesses would still need to be overcome.
The absence of specific data for several USD events in the calendar means we have to rely on market expectations and the price action itself. When key data is missing or unreleased, markets can become more sensitive to rumors and technical levels. This is where the concept of 'market sentiment analysis' becomes vital. Currently, the global risk-off sentiment, as suggested by the struggles of Bitcoin and Ethereum, also tends to hurt currencies like the NZD. Investors tend to flee to perceived safe havens like the US dollar during such periods, amplifying the bearish pressure on NZDUSD.
The recent news about escalating war risk and the potential for oil prices to surge to $200 per barrel also contributes to a global risk-off environment. While higher oil prices could theoretically benefit commodity-linked currencies like the NZD, the overwhelming 'risk-off' sentiment often leads to a flight to the safety of the USD, negating any potential commodity currency strength. This complex interplay of factors underscores why a purely technical approach might be insufficient; fundamental context is key to navigating these choppy waters.
The prevailing mood in the markets is one of caution. Global geopolitical tensions and mixed economic signals are fostering a risk-off sentiment. This environment favors safe-haven assets like the US Dollar, putting pressure on risk-sensitive currencies such as the New Zealand Dollar.
Trade Scenarios: Mapping the Path Forward
Given the current technical and fundamental landscape for NZDUSD, we can outline several potential scenarios. It's crucial to remember that these are probabilities, not certainties, and they are based on the data available right now. The market is dynamic, and conditions can change rapidly.
Bearish Scenario: Trend Continuation
65% ProbabilityNeutral Scenario: Consolidation & Indecision
25% ProbabilityBullish Scenario: Short-Term Rebound Potential
10% ProbabilityThe Path to Profitability: Strategy and Risk Management
For traders looking to navigate the current NZDUSD environment, a strategy focused on patience and risk management is paramount. The prevailing bearish trend on higher timeframes suggests that shorting opportunities on pullbacks might be more favorable, but the conflicting signals on the 1-hour chart warn against aggressive entries. The ADX at 19.79 on the 4-hour chart indicates a trend that is gaining some strength, but it's not yet in the 'very strong' category (typically above 25). This means that while the direction is down, there's still room for volatility and potential for failed moves.
The critical level to watch is the support zone around $0.57378. A decisive break below this level, especially on increased volume and confirmed by daily indicators turning more bearish, would significantly increase the probability of further downside towards $0.57144 and even $0.56794. For short-biased traders, this would be the level to target for potential entries, provided that the broader market conditions, including DXY strength, remain in place. Always look for confirmation, such as a bearish candlestick pattern forming after the breach of support.
On the flip side, a bullish scenario would require a significant shift. This would likely involve the DXY pulling back considerably, coupled with a strong bullish catalyst for the NZD itself, perhaps a surprisingly strong domestic economic report. Technically, NZDUSD would need to convincingly break above the $0.58000 resistance, hold it, and then push towards higher levels like $0.58312. However, given the current data, this scenario appears less probable in the short to medium term. The RSI on the 1-hour chart at 41.7 and on the 4-hour at 38.31 strongly suggest that upside is currently limited.
The 'WATCH_ZONE' decision reflects the current market condition: ADX at 19.79 suggests choppiness, while RSI and MACD histogram alignment point to a directional signal. This means the market is not yet ripe for a low-risk, high-probability trade. The ideal condition for a valid setup would be for the bearish trend to consolidate slightly, allowing indicators to reset, and then for price to approach a key level, like the support at $0.57378, with clear bearish momentum. A daily close below $0.57378 would be a strong bearish signal, opening the door for further declines towards $0.57144 and potentially $0.56794. Until then, caution is advised.
Risk management remains the cornerstone of successful trading. When trading NZDUSD in this environment, consider reducing position sizes and tightening stop-losses. The conflicting signals across timeframes increase the risk of being caught in a whipsaw. Always define your risk before entering a trade and never risk more than 1-2% of your capital on any single position. The market will always provide another opportunity, but preserving capital is the first step.
The NZDUSD is at a critical juncture, with the bearish trend testing significant support. While the charts suggest further downside, the current choppiness demands patience. Focus on risk management, wait for clear signals, and let the market reveal its next move. The disciplined trader is always rewarded.
Frequently Asked Questions: NZDUSD Analysis
What happens if NZDUSD breaks below the $0.57378 support level?
A decisive break below $0.57378 would confirm the bearish trend, potentially opening the door for further declines towards $0.57144 and $0.56794. This would be a strong signal for short-biased traders, especially if DXY strength persists.
Is the current RSI at 38.31 a sell signal for NZDUSD right now?
The 4H RSI at 38.31 indicates downward momentum but is not yet oversold. While it leans bearish, it's not an immediate sell signal on its own. Confirmation from price action breaking key levels or other indicators aligning would be needed.
How will DXY strength at 99.79 affect NZDUSD's outlook?
The DXY's current strength at 99.79, with a strong daily uptrend, typically exerts downward pressure on risk-sensitive currencies like NZDUSD due to the inverse correlation. This reinforces the bearish outlook for the pair.
Should traders consider buying NZDUSD if it holds near $0.57378?
Buying at support near $0.57378 would be a counter-trend trade. While possible if oversold conditions become extreme and DXY weakens, it carries higher risk. Confirmation of a reversal pattern or a clear bullish divergence on daily indicators would be necessary.
Track markets in real-time
AI-powered analysis, technical indicators and real-time price data.
Join Our Telegram Channel
Breaking market news, AI analysis and trading signals instantly.
Join Channel