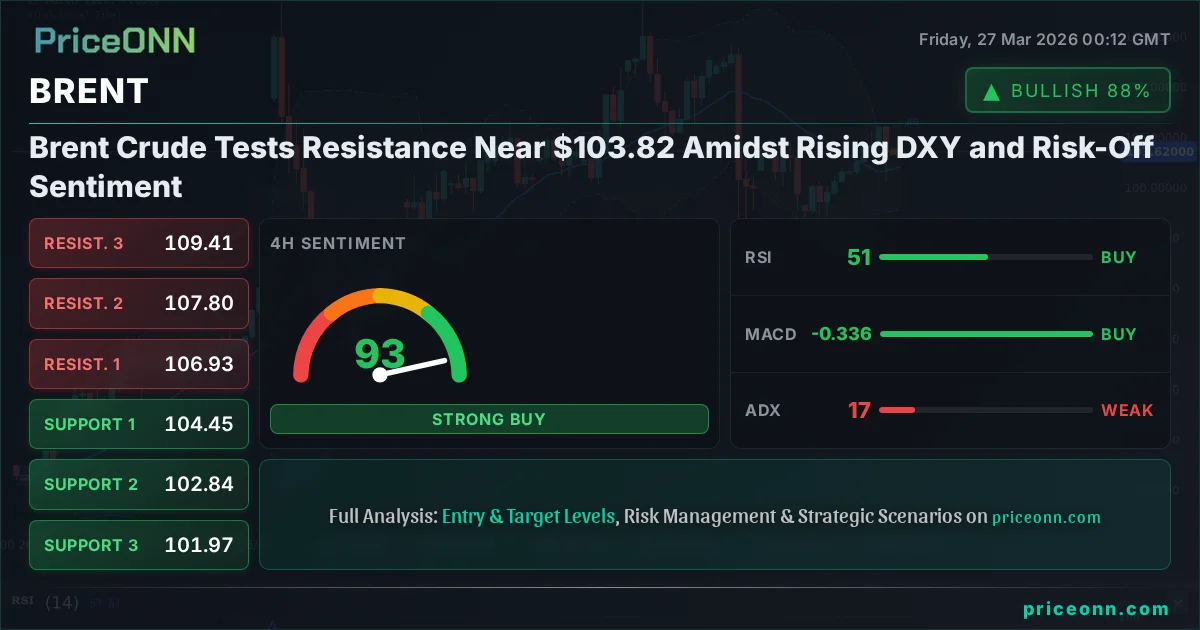
Brent Crude Tests Resistance Near $103.82 Amidst Rising DXY and Risk-Off Sentiment
Brent Crude hovers around $103.82, facing resistance as the DXY strengthens and global risk appetite wanes. Technical indicators suggest caution.
Brent Crude, currently trading at $103.82, finds itself at a critical juncture. The commodity has been navigating a complex landscape, influenced by a strengthening US Dollar Index (DXY) and a palpable shift towards risk-off sentiment across global markets. This confluence of factors presents a challenging environment for oil prices, demanding a closer look at the technical indicators and price action to decipher the next likely move. While the daily trend shows a bullish inclination, the immediate 1H and 4H charts paint a more cautious picture, with key indicators flashing mixed signals.
- Brent Crude is currently priced at $103.82, facing resistance as the DXY index strengthens.
- On the 1H chart, ADX is at 25.97, indicating a strong downtrend despite some stochastic buy signals.
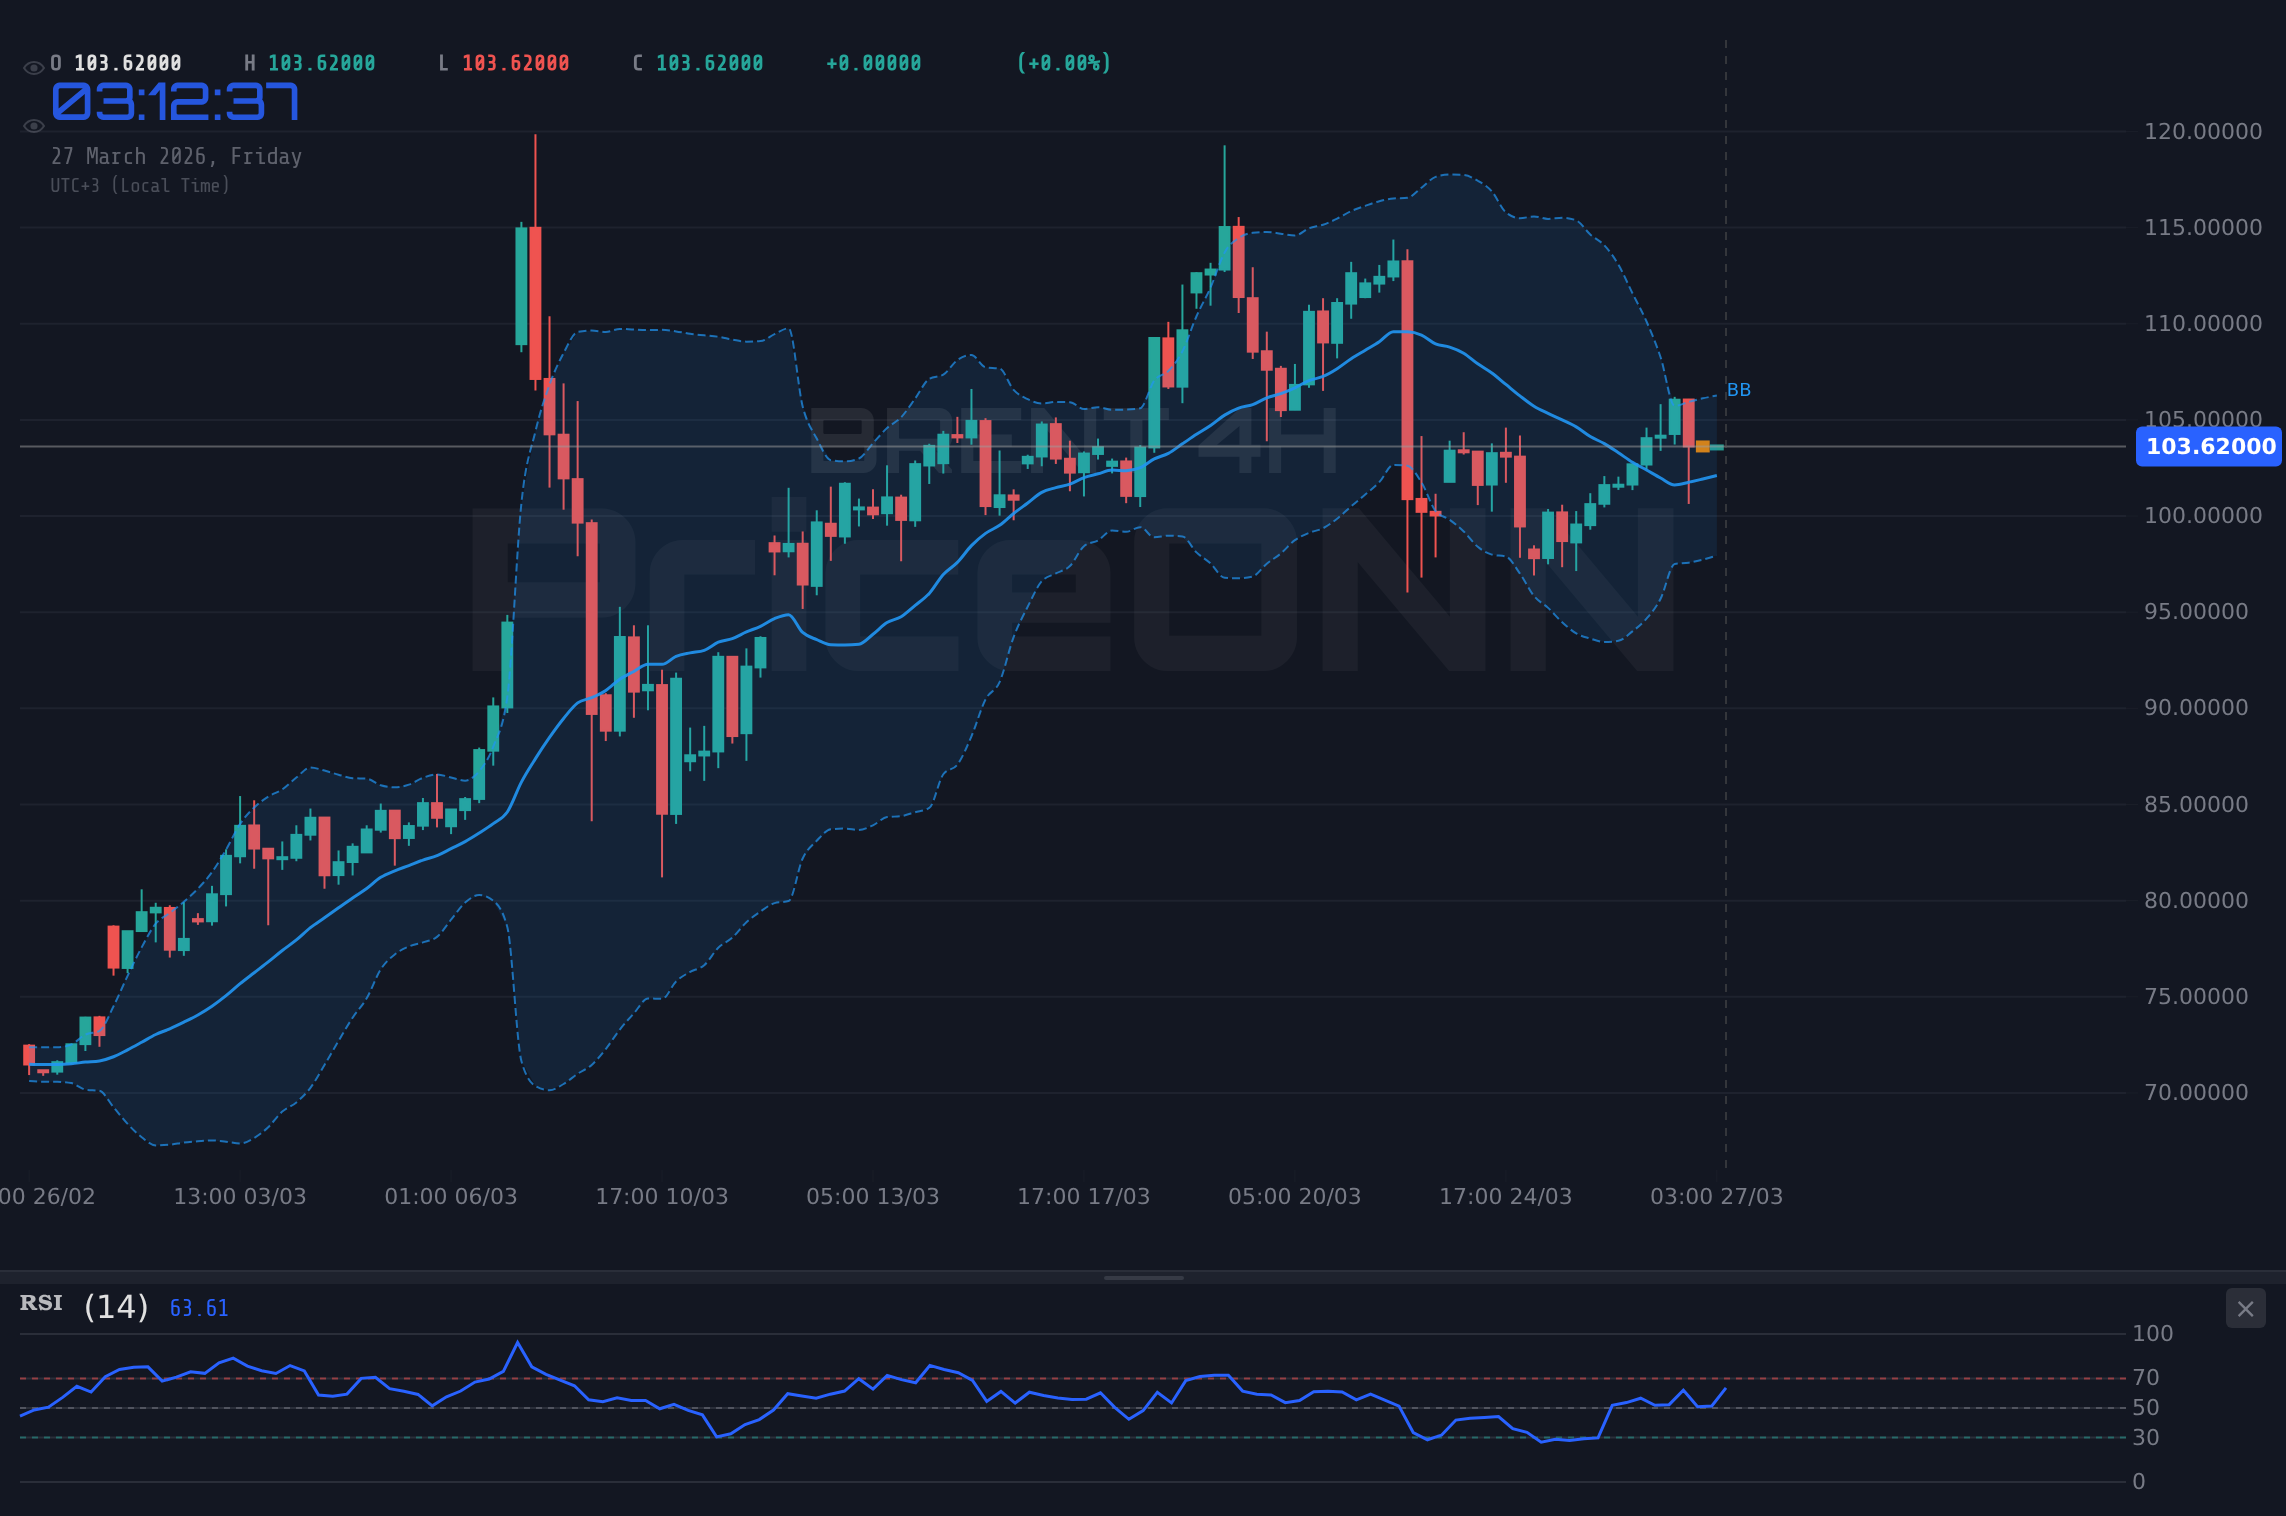
- The 4H chart shows a neutral trend (ADX 16.95), with RSI at 50.99 and positive MACD momentum.
- The daily chart exhibits a strong bullish trend (ADX 62.77) with RSI at 64.22, but a conflicting stochastic sell signal.
- A daily close above $104.81 resistance is needed for a sustained bullish continuation.
The narrative surrounding Brent Crude is currently dominated by external forces, primarily the upward momentum in the US Dollar Index (DXY). As the DXY, trading at 99.66, climbs higher, it typically exerts downward pressure on dollar-denominated commodities like oil. This inverse correlation is a well-established market dynamic; a stronger dollar makes oil more expensive for holders of other currencies, potentially dampening demand. The DXY's recent rally, supported by growing safe-haven demand amidst escalating geopolitical tensions, adds a layer of complexity to the oil market's outlook. Traders are closely watching if this dollar strength will be the primary driver, potentially capping any upside for Brent.
Technical analysis across multiple timeframes reveals a nuanced picture. On the 1-hour chart, the overall trend strength is neutral at 50%, but the ADX reading of 25.97 suggests a strong downtrend is attempting to assert itself, despite a generally neutral RSI of 51.27. The MACD shows negative momentum, with the MACD line below its signal line, reinforcing a bearish short-term outlook. However, the Stochastic Oscillator presents a conflicting signal, with K line (58.19) above D line (75.16) indicating a potential upward move, though it's in a tradeable zone rather than extreme territory. This mixed signaling on the shortest timeframe calls for caution, suggesting short-term chop or a battle between buyers and sellers around current levels.
Moving to the 4-hour timeframe, the trend strength remains neutral at 50%, but the ADX at 16.95 indicates a weaker trend overall, suggesting a period of consolidation or sideways movement might be more dominant here. The RSI sits at 50.99, right on the cusp of bullish or bearish territory, offering little directional conviction. Interestingly, the MACD here shows positive momentum, with the MACD line above its signal line, contrasting with the 1-hour chart. The Stochastic Oscillator (K=84.38, D=76.95) is in overbought territory, flashing a bullish signal, but this often precedes a price reversal or consolidation, especially if it fails to break higher decisively. This suggests that while there's underlying buying interest, it might be struggling to gain significant traction.
The daily chart, however, presents a more optimistic, albeit still cautious, view for the bulls. The trend is strongly bullish with a Power rating of 100% and an ADX of 62.77, signifying a very strong trending market. The RSI at 64.22 is in the neutral zone but trending upwards, indicating room for further appreciation before hitting overbought conditions. The MACD, while showing negative momentum on this timeframe, has been in this state before during uptrends, and the price action is key. The Stochastic Oscillator (K=25.09, D=50.99) is showing a bearish signal, with the K line crossing below the D line, which is a point of concern for immediate upside continuation. This divergence between the strong daily trend indicators and the conflicting signals from the shorter timeframes and the daily Stochastic highlights the current market's indecision.
The key resistance level to watch for Brent Crude is $104.81, based on the 4-hour chart's resistance points. A sustained move and close above this level on the daily chart would be a significant bullish confirmation. This would signal a potential continuation of the broader uptrend, likely fueled by improving risk appetite or further geopolitical supply disruptions. The $104.81 level represents a significant hurdle that has acted as a ceiling in recent price action. Breaking through it would not only signify technical strength but could also attract more buyers, potentially driving prices towards the next resistance at $105.74 and then $105.99.
Conversely, support lies at $104.56 and $104.22 on the 1-hour chart. A failure to hold these levels, especially if coupled with a decisive break below the $103.49 support mentioned in the title context, could trigger a more significant pullback. The daily support at $98.32 remains a more distant but critical level. A break below the immediate supports could lead to a rapid unwinding of long positions, especially if the broader market sentiment turns decidedly risk-off or the DXY continues its ascent towards the 100 mark. The ADX readings across the charts, particularly the strong 62.77 on the daily, indicate that when a trend is in place, it is powerful, making the direction of the next breakout crucial.
Why Volatility is Key for Brent's Next Move
The current market environment for Brent Crude is characterized by elevated volatility. The daily range has seen swings between $100.63 and $106.2, showcasing significant price swings within a short period. This volatility is often a double-edged sword; it can present trading opportunities but also significant risks. The ADX values, ranging from a strong 62.77 on the daily to a weaker 16.95 on the 4-hour, illustrate this choppy condition. When ADX is high, trends are strong and directional moves are more probable. When it's low, as seen on the 4H chart, it suggests a lack of strong directional conviction and potential for ranging or whipsaw price action. Traders must therefore exercise a high degree of risk management, using tighter stops and smaller position sizes until a clearer trend emerges.
The interplay between Brent and broader market indices like the S&P 500 (currently at 6510.05, down 1.23%) and Nasdaq 100 (at 23705.42, down 1.87%) is also noteworthy. A declining risk appetite, as evidenced by the sell-off in major US equity indices, typically correlates with lower demand for riskier assets like oil, or an increased flight to safe havens like the US dollar. If the equity markets continue their downward trajectory, it could create additional headwinds for Brent prices, irrespective of supply-side factors. The current broad market weakness suggests that global economic growth concerns might be resurfacing, which directly impacts oil demand forecasts.
Geopolitical factors, while not explicitly detailed in the provided live data, remain a constant undercurrent for oil prices. Recent news highlights tensions in the Black Sea region following an attack on a Russian oil tanker, raising supply route concerns. Additionally, reports of Iraq's oil economy facing collapse due to Hormuz blockade, and the ongoing global LNG supply gap amid regional conflict, all point towards potential supply disruptions. These events, if they escalate or lead to tangible reductions in crude supply, could override the bearish technical signals and dollar strength, providing a fundamental tailwind for Brent prices. The market is likely balancing these potential supply risks against demand-side concerns driven by global economic slowdown fears and a strong dollar.
The Trader's Dilemma: Conflicting Signals and the Path Forward
The current technical setup for Brent Crude presents a classic trader's dilemma. On one hand, the strong bullish trend on the daily chart, supported by a daily ADX of 62.77, suggests that any dips might be buying opportunities for longer-term trend followers. The RSI at 64.22 still has room to grow before reaching the overbought territory. On the other hand, the shorter timeframes (1H and 4H) exhibit mixed signals, with weak trend strength on the 4H (ADX 16.95) and conflicting Stochastic readings. The rising DXY and the bearish sentiment in equity markets add further layers of uncertainty, suggesting that a breakout above the $104.81 resistance might be challenging to sustain without a shift in the broader macro environment.
For a bullish scenario to gain stronger footing, a decisive daily close above the key resistance at $104.81 is paramount. This would not only break a short-term ceiling but also confirm the strength indicated by the daily trend indicators. Such a move would likely need to be accompanied by a weakening DXY or a significant supply-side shock to gain momentum. The target for such a move could then extend towards the $105.74 and $105.99 resistance levels. This scenario hinges on the bulls overcoming the immediate technical hurdles and the prevailing dollar strength.
Conversely, a bearish scenario would be triggered by a failure to hold the immediate support levels. A break below $104.56, and more critically below $103.49, could signal a deeper correction. This would likely be exacerbated if the DXY continues its climb towards the 100 level, or if risk-off sentiment intensifies, leading to further sell-offs in equities. In such a case, Brent could retest the $102.84 support level on the 4-hour chart, and potentially drift towards the more significant daily support at $98.32 if the downtrend gains substantial traction. This path would be favored if supply concerns ease or demand destruction fears dominate.
A neutral or consolidation scenario is also highly plausible given the conflicting signals across timeframes and the current macroeconomic crosscurrents. The market might remain range-bound between the immediate support and resistance levels, characterized by choppy price action and lower volume. This phase would allow oscillators like RSI and Stochastic to reset, potentially building energy for a more decisive move. During such periods, traders often look for confirmation from price action at the boundaries of the range or await clearer signals from central bank policy shifts or major geopolitical developments. The current ADX readings, particularly the low 16.95 on the 4H, lend credence to this possibility of a consolidation phase.
Bearish Scenario: Dollar Strength Dominates
65% ProbabilityNeutral Scenario: Consolidation Around Key Levels
25% ProbabilityBullish Scenario: Supply Shock or DXY Weakness
10% ProbabilityNavigating the Brent Crude Landscape: A Technical Perspective
From a technical standpoint, Brent Crude is at a crossroads. The daily chart's strong bullish trend (ADX 62.77) suggests underlying strength, but the conflicting signals from shorter timeframes and the daily Stochastic Oscillator warrant caution. The RSI at 64.22 on the daily timeframe indicates there is still room for upside before reaching overbought territory, a positive sign for bulls. However, the Stochastic's bearish crossover and the negative MACD momentum on the daily chart cannot be ignored. The 4-hour chart's neutral ADX of 16.95 reinforces the idea that the market might be consolidating, waiting for a catalyst.
The price action around the $103.49 to $104.81 levels will be critical in the coming sessions. A decisive break and hold above $104.81 would validate the bullish trend and potentially open the door for further gains towards $105.74 and $105.99. This would likely require either a significant supply-side event, such as an escalation of geopolitical tensions impacting oil routes, or a notable weakening of the US Dollar. The DXY's current push towards the 100 level is a significant headwind that the bulls must overcome.
Conversely, a failure to sustain prices above $103.82 and a subsequent break below the $103.49 support level could signal a deeper retracement. This would align with the bearish signals on the shorter timeframes and could see prices revisiting levels like $102.84. The market's reaction to the key support and resistance levels, combined with the broader macroeconomic backdrop of dollar strength and risk sentiment, will dictate the direction of Brent Crude in the short to medium term. Traders should remain vigilant, manage risk meticulously, and wait for clearer directional signals before committing to significant positions.
| Indicator | Value | Signal | Interpretation |
|---|---|---|---|
| RSI (14) | 64.22 | Neutral | Daily: Room to grow; 4H: 50.99 (neutral); 1H: 51.27 (neutral) |
| MACD | - | Bearish Momentum (Daily/1H) | Positive momentum on 4H |
| Stochastic | K:25.09, D:50.99 | Bearish Crossover | 4H: Overbought (K:84.38, D:76.95); 1H: Sell Signal (K:58.19, D:75.16) |
| ADX | 62.77 | Strong Trend | Daily: Very strong trend; 4H: 16.95 (Weak); 1H: 25.97 (Strong Downtrend) |
| Bollinger Bands | - | Mixed | Daily/4H: Above middle band; 1H: Below middle band |
Frequently Asked Questions: BRENT Analysis
What happens if BRENT breaks below $103.49 support?
A break below the $103.49 support level could trigger a deeper retracement, potentially targeting the $102.84 level on the 4-hour chart. This bearish scenario would be amplified by continued DXY strength and risk-off sentiment in global markets.
Should I buy BRENT at current levels of $103.82 given the conflicting signals?
Caution is advised at current levels. While the daily trend is bullish, shorter timeframes show mixed signals and the DXY is strengthening. A confirmed daily close above $104.81 resistance would be a more reliable bullish entry trigger, offering better risk-reward.
Is the daily RSI at 64.22 a sell signal for BRENT?
An RSI of 64.22 is in the neutral zone and still has room to appreciate before reaching overbought territory (typically above 70). While not a direct sell signal, it indicates that the bullish momentum is present but not yet in extreme territory, suggesting potential for further upside if resistance breaks.
How will the strong DXY at 99.66 affect BRENT prices this week?
The strengthening DXY at 99.66 typically exerts downward pressure on dollar-denominated commodities like Brent Crude. This inverse correlation means that continued DXY strength could cap any upside potential for oil prices, making it harder for Brent to break through key resistance levels without a shift in macro sentiment.
Track markets in real-time
AI-powered analysis, technical indicators and real-time price data.
Join Our Telegram Channel
Breaking market news, AI analysis and trading signals instantly.
Join Channel