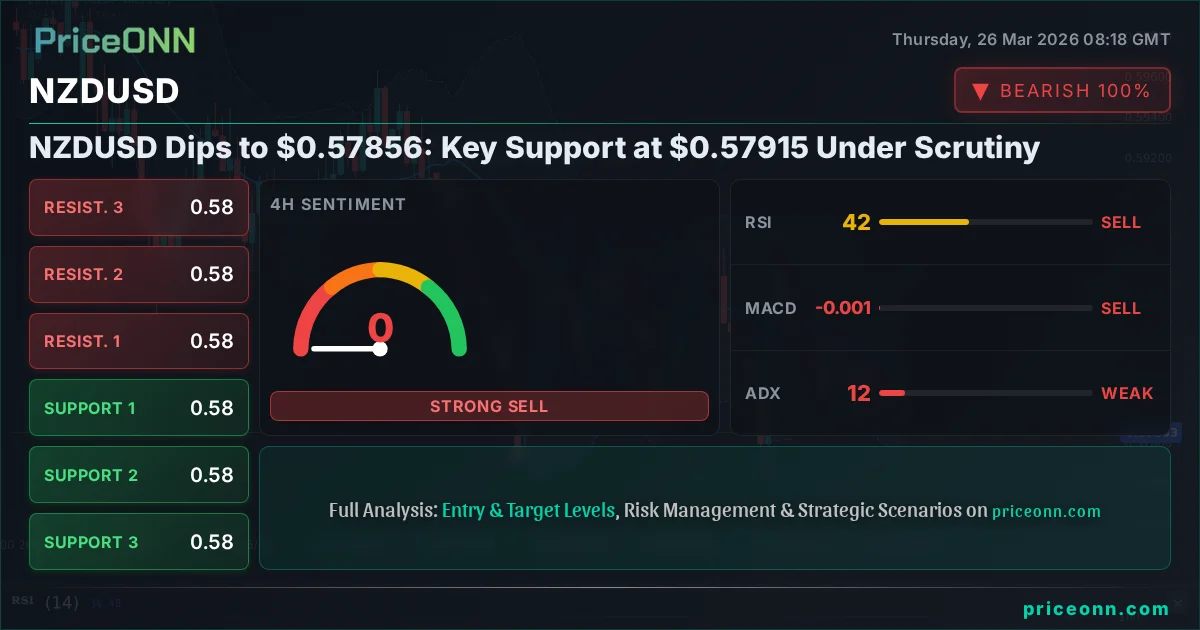
NZDUSD Dips to $0.57856: Key Support at $0.57915 Under Scrutiny
NZDUSD trades near $0.57856 as geopolitical tensions dampen risk appetite. Key support at $0.57915 is being tested.
The New Zealand Dollar (NZDUSD) is currently navigating a period of intense scrutiny, trading precariously close to a significant support level at $0.57856. This delicate position comes as global geopolitical tensions escalate, dampening risk appetite and casting a shadow over risk-sensitive currencies like the Kiwi. With the daily chart showing a clear downtrend and multiple indicators flashing sell signals, the market is keenly watching whether the $0.57915 support can hold, or if a further slide is imminent.
- NZDUSD is trading at $0.57856, with key support at $0.57915 being tested.
- The 1-day RSI at 39.49 signals oversold pressure, but the ADX at 33.2 indicates a strong downtrend.
- A daily close below $0.57915 could target $0.57776, while a break above resistance at $0.58309 is needed for a bullish shift.
- Geopolitical tensions and a strengthening US Dollar Index (DXY) at 99.48 are pressuring the pair.
Navigating the Storm: NZDUSD Today Analysis
The current technical picture for NZDUSD paints a cautious, predominantly bearish, outlook. On the 1-hour chart, the trend is firmly downwards with an 84% strength, supported by a sell signal across most indicators. The RSI(14) at 32.4 is deep in oversold territory, suggesting that a short-term bounce might be on the cards, but the MACD remains in negative momentum, lurking below its signal line. The Stochastic oscillator, with K=20.52 and D=36.91, also leans towards further downside, indicating a potential continuation of the sell-off. The ADX at 17.77, while signaling a weak trend, points towards a market that could be consolidating before a potential move, but the overall sentiment is clearly bearish.
However, the 4-hour timeframe offers a slightly different, though still concerning, perspective. Here, the trend is also classified as bearish with 86% strength. The RSI(14) sits at 42.27, still in neutral territory but trending downwards, suggesting room for further declines before reaching oversold conditions. The MACD continues to show negative momentum, and the Stochastic oscillator (K=14.73, D=25.7) reinforces the bearish bias. Crucially, the ADX at 12.4 indicates a very weak trend, suggesting that the current downward move might lack conviction and could be part of a broader consolidation phase. This weakness in the trend strength is something traders will be watching closely, as it could precede a significant breakout in either direction.
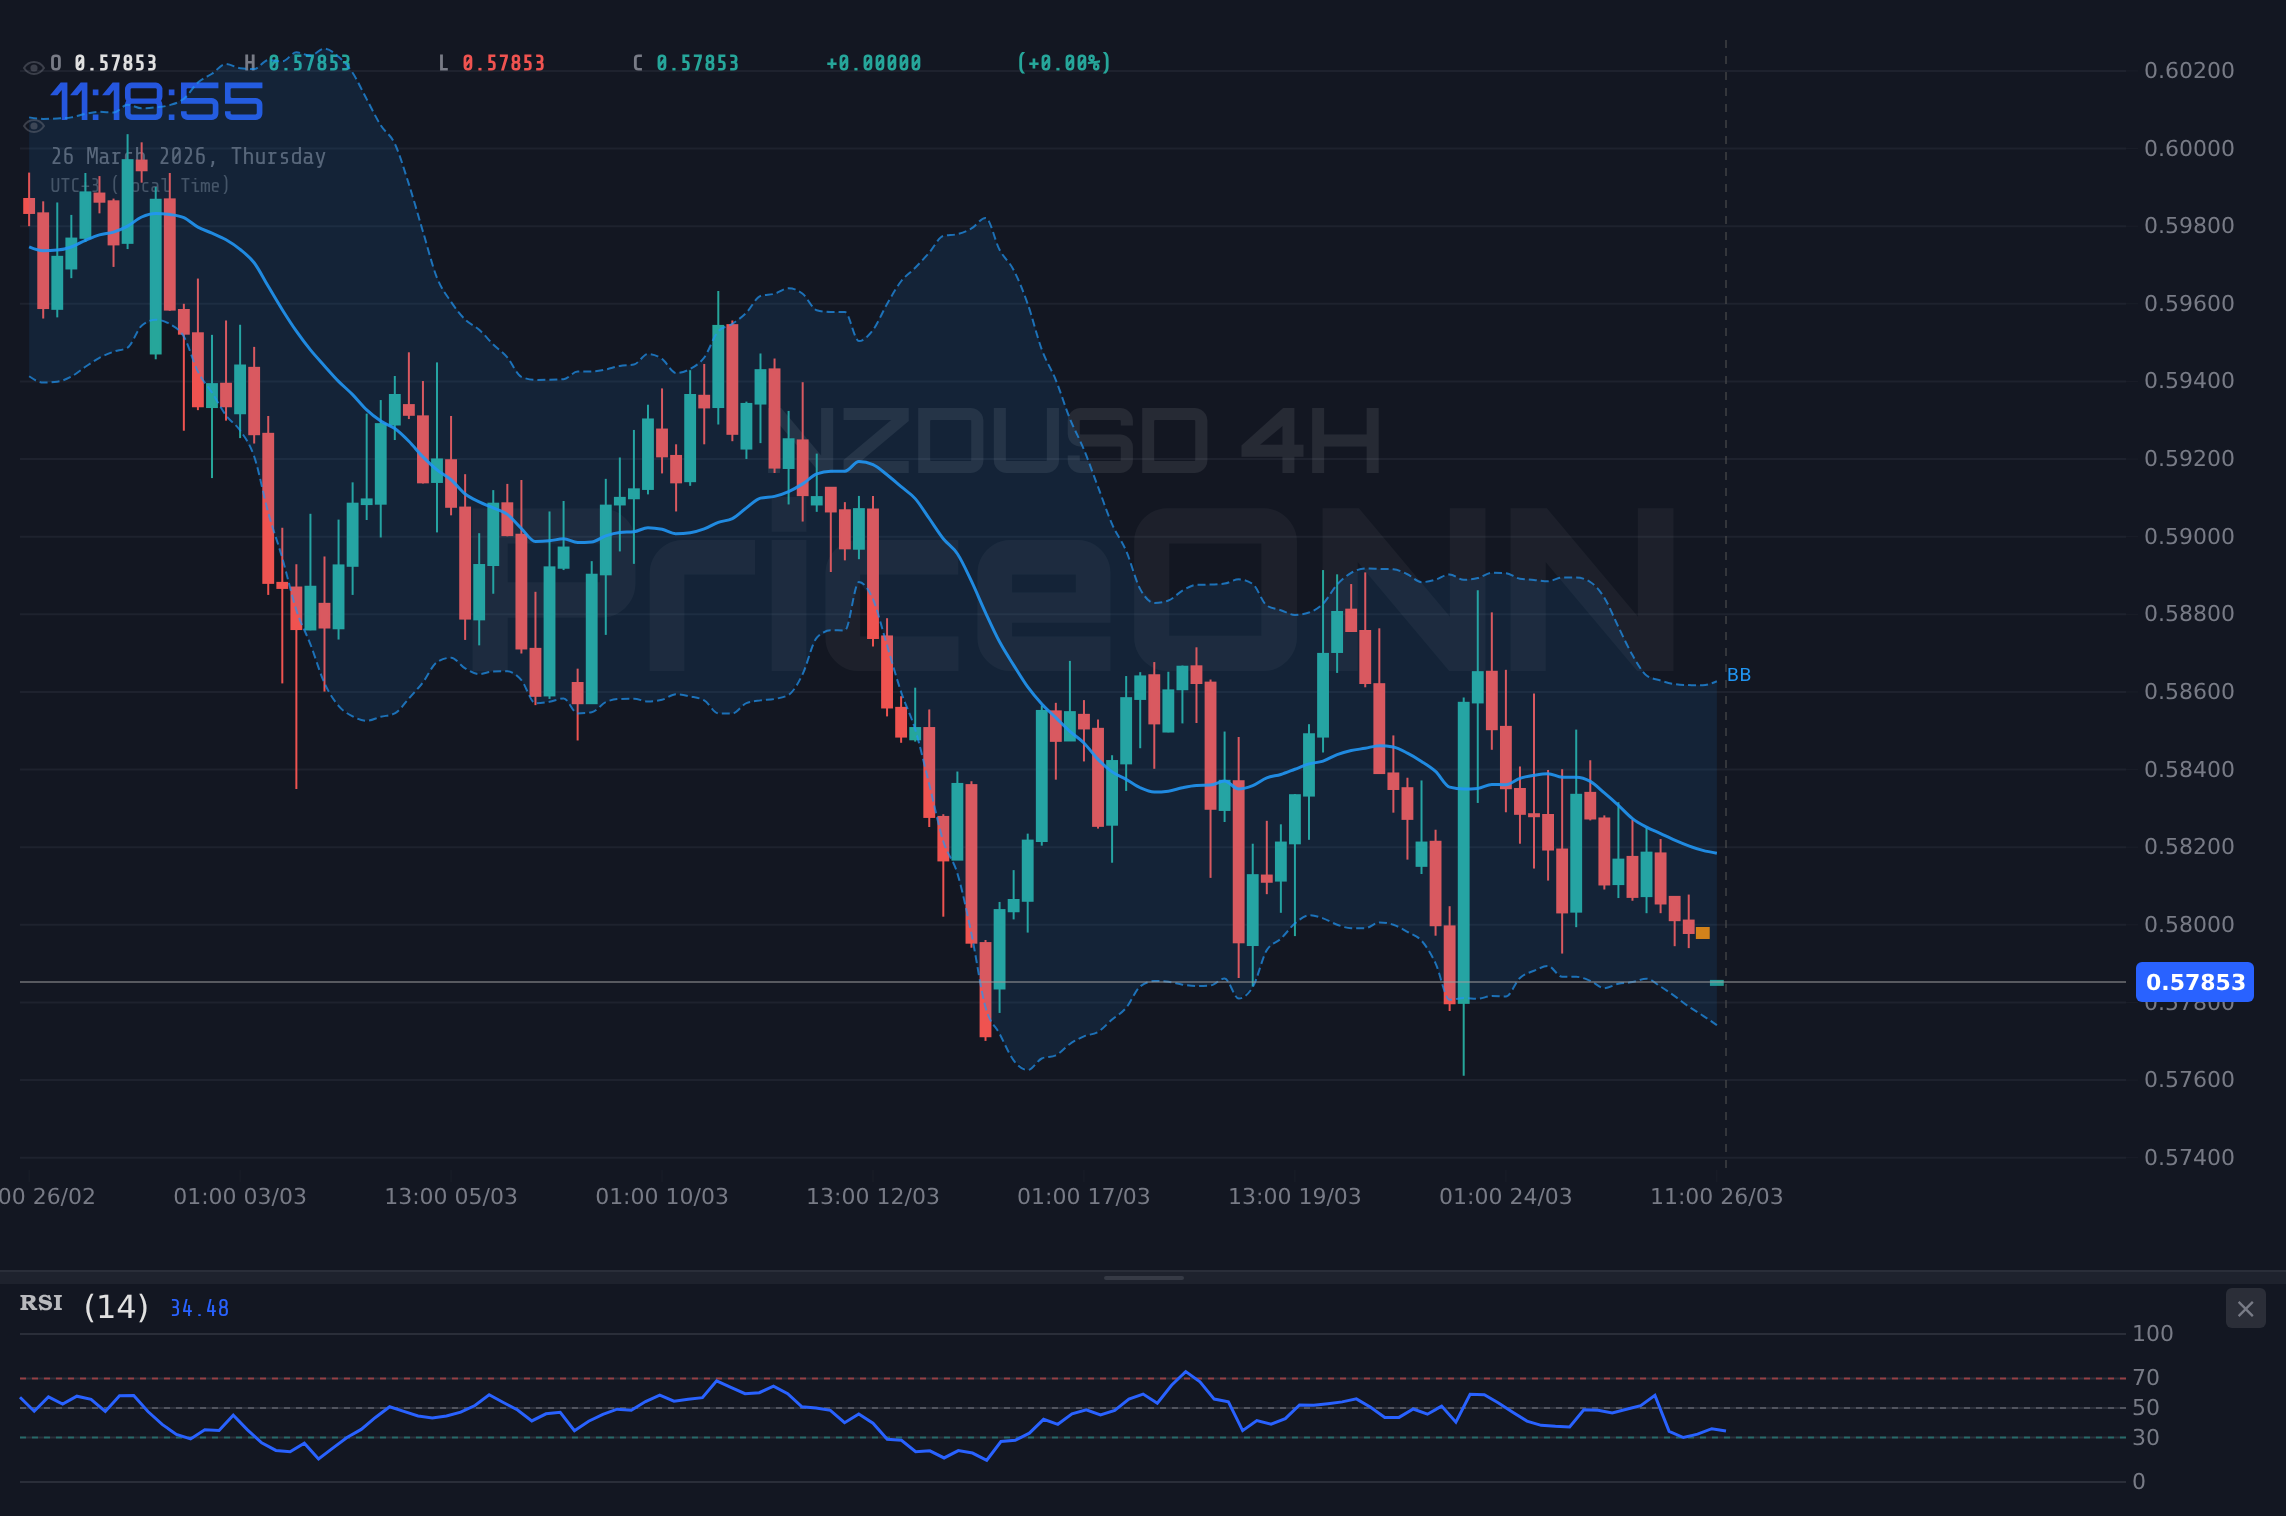
The daily chart, the ultimate arbiter of long-term direction, firmly entrenches the bearish sentiment. The trend is unequivocally downwards with 87% strength. The RSI(14) is hovering at 39.49, indicating a bearish lean but still some distance from extreme oversold conditions, leaving ample room for further depreciation. The MACD is firmly in negative territory, with its histogram below the signal line, confirming bearish momentum. Bollinger Bands are showing the price trading below the lower band, a sign of extreme bearish pressure or a potential breakdown. The Stochastic oscillator, with K=32.87 and D=38.02, is also favoring sellers, though the crossover hints at a potential, albeit weak, reversal signal if momentum shifts. The ADX reading of 33.2 here is particularly noteworthy; it signifies a strong downtrend, suggesting that any counter-trend moves might be short-lived and that the path of least resistance remains to the downside.
This multi-timeframe technical analysis underscores a clear bearish bias for NZDUSD. The overwhelming majority of indicators and trend assessments across the 1-hour, 4-hour, and daily charts point towards further weakness. The critical support level at $0.57915 is the immediate battleground. A break below this level, especially on increased volume, would confirm the bearish sentiment and open the door for further declines towards the next support at $0.57776. Conversely, any sustained bounce from $0.57915 would need to overcome significant resistance, starting at $0.58074 and extending upwards, to even suggest a potential trend reversal.
The Dollar's Dominance and Geopolitical Ripples
The broader market context is currently dominated by a strengthening US Dollar Index (DXY), which is trading at 99.48 and showing a decisive upward trend on the daily chart. The DXY's strength, fueled by escalating geopolitical tensions in the Middle East, is a significant headwind for NZDUSD. As the dollar strengthens, it naturally exerts downward pressure on currency pairs like NZDUSD, especially given the risk-off sentiment pervading global markets. The SP500 and Nasdaq are both trading lower today, reflecting this declining risk appetite. The SP500 is down 0.47% at 6560.05, and the Nasdaq 100 has fallen 0.59% to 24014.14. This risk-off environment typically leads investors to seek the relative safety of the US dollar, further exacerbating the pressure on antipodean currencies like the New Zealand Dollar.
The impact of geopolitical events cannot be overstated in the current market environment. The ongoing conflict in the Middle East has disrupted approximately 20% of global LNG trade, creating supply deficits and elevating energy prices. This situation directly impacts Australia, a close trading partner of New Zealand, and indirectly influences the Kiwi through regional economic sentiment and potential central bank policy shifts. The news specifically flags AUD under watch due to these tensions, and the spillover effect on NZDUSD is palpable. As highlighted in recent reports, escalating Middle East conflict presents significant inflation and economic risks for Australia, potentially forcing the RBA's hand. While the direct impact on New Zealand's monetary policy is less immediate, the global inflationary pressures and heightened uncertainty contribute to the bearish sentiment surrounding NZDUSD.
The correlation between the US Dollar Index (DXY) and NZDUSD is a critical factor to monitor. With the DXY showing a strong upward trend on the daily chart, currently at 99.48, and exhibiting a 90% strength in its 1-hour trend, it's acting as a significant drag on the pair. Historically, a rising DXY often corresponds with a falling NZDUSD, and the current market setup aligns with this inverse relationship. Traders are watching if the DXY can maintain its momentum above the 99.51 resistance level on the daily chart. A sustained push higher by the dollar would likely confirm further downside for NZDUSD, reinforcing the bearish technical signals. Conversely, any significant pullback in the DXY could provide a much-needed reprieve for the Kiwi, but this seems unlikely in the current geopolitical climate.
The Bull's Roadmap: A Path Less Traveled?
For the bulls to regain control of NZDUSD, a confluence of factors needs to align, and a significant shift in market sentiment would be required. The immediate hurdle is the resistance at $0.58074 on the 1-hour chart. A decisive break and hold above this level, ideally accompanied by increasing bullish momentum on the MACD and a RSI move back above 50, would be the first sign of life. However, the true test lies at the daily resistance level of $0.58309. A daily close above this point would invalidate the current bearish trend and open the door for a more sustained recovery. This would likely require a significant reversal in the DXY, a de-escalation of geopolitical tensions, or a surprising shift in global risk sentiment.
If NZDUSD manages to break decisively above the $0.58309 resistance, the next target would be the $0.58564 level, followed by the more significant $0.58703. Such a move would signal a potential bottoming process, but it would need to be supported by a fundamental shift rather than just a technical oversold bounce. The ADX on the daily chart at 33.2 currently indicates a strong downtrend, meaning that breaking this trend would require considerable force and sustained buying pressure. Any bullish scenario would need to overcome the prevailing narrative of dollar strength and risk aversion, which appears unlikely in the short to medium term given the current geopolitical backdrop.
The probability of this bullish scenario playing out in the immediate future appears low, estimated at around 10-15%. The technical indicators are overwhelmingly bearish, and the fundamental drivers – namely geopolitical uncertainty and dollar strength – are not conducive to a Kiwi dollar rally. For this scenario to gain traction, we would need to see a clear break of the downtrend on the daily chart, a sustained move above key resistance levels, and a corresponding weakening of the US dollar. Until then, any rallies are likely to be viewed as opportunities for sellers to re-enter the market at better prices.
Where Bears Take Control: The Downside Scenario
The bearish scenario for NZDUSD is currently the most probable outcome, given the prevailing technical and fundamental conditions. The immediate trigger for further downside would be a confirmed break below the critical support level at $0.57915 on the daily chart. This level has acted as a key pivot point, and a decisive move below it, especially on increased volume, would confirm the bearish thesis. The 1-day chart shows strong downtrend signals with an ADX of 33.2, indicating that the path of least resistance is downwards.
Should NZDUSD break below $0.57915, the next logical target would be the support at $0.57776. This level represents a significant psychological and technical threshold. A failure to find strong buying interest here could lead to a cascade towards the subsequent support at $0.57521. The technical indicators on the daily chart, such as the RSI at 39.49 and the MACD's negative momentum, suggest that there is still ample room for prices to fall. The Bollinger Bands currently show the price trading below the lower band, indicating extreme bearish pressure that could persist.
The invalidation point for this bearish scenario would be a decisive move back above the $0.58074 resistance on the 1-hour chart, and more importantly, a sustained close above the daily resistance at $0.58309. As long as the price remains below these levels, the bears are likely to maintain control. The probability of this bearish scenario unfolding is estimated at 65%, driven by the strong downtrend signals, negative momentum, and unfavorable geopolitical and DXY conditions. The current market environment appears primed for further Kiwi dollar weakness.
The Waiting Game: Consolidation and Range-Bound Play
While the dominant trend appears bearish, the possibility of consolidation or a range-bound period cannot be entirely dismissed, especially given the weak trend strength indicated by the ADX on the 4-hour (12.4) and 1-hour (17.77) charts. This suggests that the market might be coiling before a significant move, or that conflicting signals are causing indecision among traders. In a consolidation phase, NZDUSD would likely trade within the defined support and resistance levels, with the upper bound of this range being the $0.58074-$0.58309 resistance zone and the lower bound being the $0.57915-$0.57776 support area.
During such a period, technical indicators might offer mixed signals. For instance, while the daily chart RSI might be hovering in bearish territory, shorter timeframes could show temporary oversold or overbought conditions that lead to minor bounces or pullbacks within the range. The MACD might oscillate around the zero line, reflecting a lack of clear directional momentum. Trading within such a range would require a different strategy, focusing on shorter-term reversals at the boundaries of the range rather than a directional bet on a breakout. However, the overall trend and the prevailing macroeconomic headwinds make a prolonged period of consolidation less likely than a continued move lower.
The probability of a neutral, range-bound scenario is estimated at 20-25%. This scenario would typically play out if geopolitical tensions de-escalate significantly, or if the US Dollar takes a breather without a clear fundamental reason for a sustained reversal. It could also occur if the market is waiting for major economic data releases, such as upcoming US employment figures or New Zealand inflation data, to provide a clearer direction. Until such catalysts emerge, the market may exhibit choppy behavior around the current support levels.
The Most Likely Path Forward
Considering the confluence of technical indicators and fundamental drivers, the bearish scenario appears to be the most probable path for NZDUSD in the short to medium term. The strong downtrend signals on the daily chart, coupled with negative momentum across most timeframes and the prevailing risk-off sentiment driven by geopolitical uncertainty and a strengthening US dollar, create a formidable headwind for the Kiwi. The ADX reading of 33.2 on the daily chart strongly supports the continuation of the current downtrend.
The probability assigned to the bearish scenario is 65%, reflecting the overwhelming technical and fundamental evidence. While a short-term bounce from the current oversold levels on the 1-hour chart is possible, it is unlikely to sustain without a significant shift in the broader market narrative. The key trigger to watch remains a decisive break below the $0.57915 support. Should this level give way, the targets at $0.57776 and $0.57521 become highly probable.
The neutral scenario carries a 25% probability, contingent on market participants entering a holding pattern ahead of key economic data or a sudden de-escalation of geopolitical risks. The bullish scenario, with only a 10-15% probability, remains a distant possibility unless significant fundamental shifts occur. For now, the technical setup and the macro environment suggest that caution is warranted, and traders should be prepared for further downside pressure on NZDUSD.
What I'm Watching This Week
My focus this week will be on a few key triggers that could dictate the next significant move for NZDUSD. Firstly, I'll be watching the price action around the critical support level of $0.57915. A clear break below this level, especially on higher volume, would confirm the bearish outlook and align with my highest probability scenario. Secondly, I'm monitoring the US Dollar Index (DXY). Its ability to maintain strength above 99.48 and push towards 99.51 on the daily chart will be crucial in validating the continued pressure on NZDUSD.
Finally, I'll be keeping an eye on any significant shifts in geopolitical headlines. A sudden de-escalation in the Middle East could provide a temporary boost to risk sentiment and NZDUSD, but given the current entrenched downtrend and dollar strength, such rallies would likely be met with selling pressure. The upcoming US economic data, particularly employment figures, will also be critical in shaping the Federal Reserve's future policy outlook and, consequently, the direction of the US dollar and NZDUSD. The ADX at 33.2 on the daily chart suggests the downtrend is strong, making a sustained move above resistance levels unlikely without significant external catalysts.
Bearish Scenario: The Downside Continues
65% ProbabilityNeutral Scenario: Range-Bound Indecision
25% ProbabilityBullish Scenario: A Comeback Attempt
10% Probability| Indicator | Value | Signal | Interpretation |
|---|---|---|---|
| RSI (14) | 39.49 | Bearish | Below 50, indicating bearish momentum but not extreme oversold. |
| MACD Histogram | -0.001 | Bearish | Negative momentum confirms selling pressure. |
| Stochastic K | 32.87 | Bearish | Below 50, suggesting further downside potential. |
| ADX (14) | 33.2 | Strong Trend | Confirms a strong downtrend is in play. |
| Bollinger Bands | Lower Band | Bearish | Price below lower band indicates bearish pressure. |
Frequently Asked Questions: NZDUSD Analysis
What happens if NZDUSD breaks below the $0.57915 support level?
A break below the critical $0.57915 support level would likely trigger further selling pressure, aligning with the dominant bearish trend. The next downside targets would then be $0.57776 and potentially $0.57521, as indicated by the daily technical setup.
Should I consider buying NZDUSD at current levels around $0.57856 given the oversold RSI?
While the 1-hour RSI is oversold, the overall daily trend remains strongly bearish with an ADX of 33.2. Buying now carries significant risk as the downtrend may continue. A confirmed break above the $0.58309 resistance would be needed to invalidate the bearish outlook and suggest a safer entry point.
Is the MACD histogram at -0.001 a strong sell signal for NZDUSD on the daily chart?
A negative MACD histogram confirms bearish momentum, indicating that sellers are in control. While not an extreme signal on its own, combined with other bearish indicators like the RSI below 40 and a strong ADX, it reinforces the downside risk for NZDUSD.
How will continued DXY strength above 99.48 affect NZDUSD this week?
Continued strength in the US Dollar Index (DXY) above 99.48, driven by geopolitical tensions, is expected to exert further downward pressure on NZDUSD. This correlation suggests that as the dollar strengthens, the Kiwi is likely to weaken, potentially pushing it towards the $0.57776 support level.
Track markets in real-time
AI-powered analysis, technical indicators and real-time price data.
Join Our Telegram Channel
Breaking market news, AI analysis and trading signals instantly.
Join Channel